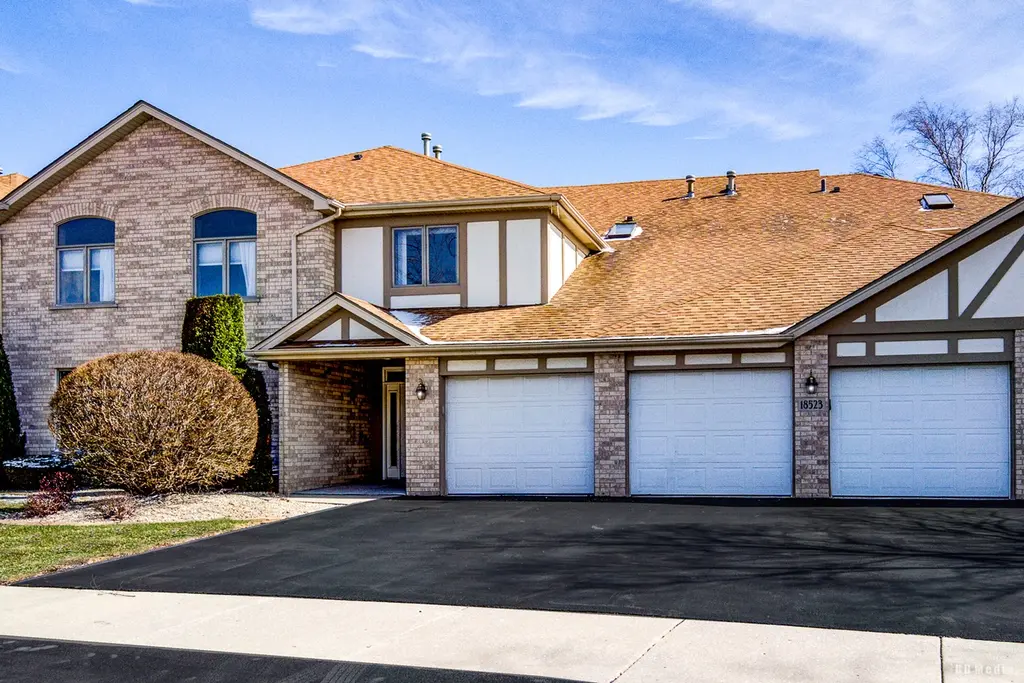
18523 Pine Lake Dr #4 · Tinley Park, IL
Flood risk 3/10 · Minor
- FEMA flood zone
- X (unshaded)
- Chance of flooding over 30 yrs
- 0.2%
- Est. flood insurance / yr
- $507 – $1,088
Fire risk 1/10 · Minimal
- Est. fire insurance / yr
- $804 – $1,492
Heat risk 3/10 · Minor
- Hot days now (above 102°F)
- 7 days/yr
- Hot days in 30 yrs
- 15 days/yr
Wind risk 2/10 · Minimal
- Chance of severe wind over 30 yrs
- —
Air-quality risk 4/10 · Minor
- Unhealthy air days now
- 4 days/yr
- Unhealthy air days in 30 yrs
- 5 days/yr
Risk factors via First Street. Map © Google.
Why this score? — see what drove the D- grade
The composite is a weighted blend of 9 inputs, each scored 0–100. Each bar is that input's sub-score; the figure is the points it added to the 100-point composite (weight × sub-score).
- Cash flow +13.8/30.0
- ARV discount +7.5/15.0
- DSCR +4.2/10.0
- 1% rule +3.8/10.0
- Livability +3.7/5.0
- Rent growth +2.5/5.0
- Condition / age +2.5/5.0
- Schools +0.9/10.0
- Appreciation +0.0/10.0
$274,900
🖨 Deal sheet (PDF) 📄 Offer letter ✓ Due diligence
Listing remarks MLS
Exceptionally lovely 2nd floor condo w/2 bdrm & 2 bths. Beautifully maintained w/many upgrades!! Engineered hdwd flrs, Newer Stove, Refrg,Microwave, HotWaterTank, Double Kit.Sinks, Faucet & CORIAN Counters. Roomy breakfast nook in Kit. overlooks Pond. Vaulted ceilings, Palladium Windows, Huge mastr. Includes STAIR-LIFT. Enjoy 2 hole Putting Green & Gazebo. Near Historic downt. 55+Community(Must be 18+)Attached gar
Key facts
- Attached garage
- Walk-in closet
- Eat in kitchen
Tags
Property features AI
Finance
- Other: One mile east of Harlem off 183rd to Pine Lake Drive (Tinley Park); Listing possession: tenant's rights
- HOA & community: Monthly association fee of $230; HOA covers exterior maintenance, lawn care, trash (scavenger), snow removal, and internet; Pets allowed (cats and dogs), maximum pet weight 30 lbs
Exterior
- Parking: Attached garage (1 car)
- Utilities: Lake Michigan water; Public sewer
- Home design: Attached single property; Townhouse — 2 story; Fee simple ownership with homeowners association
- Construction: Built 21–25 years ago; Construction: vinyl siding
- Exterior features: Vinyl siding; Adult community; Disability access
Interior
- Kitchen: Kitchen
- Bedrooms: Master bedroom (Main level, 16 x 10); Bedroom 2 (Main level, 12 x 10); Additional bedrooms listed
- Bathrooms: 2 full bathrooms; Master bedroom has a full bath
- Heating & cooling: Natural gas heating; Central air conditioning
- Interior features: Terrace; Dining room; Family room; Living room; Laundry
- Laundry & utility: Laundry room
Neighborhood map
What this means for you Summary
Snapshot
- This is a 2-bed/2.0-bath condo listed at $275k.
Deal economics
- At list price, monthly cash flow is $23 ($282/yr) — positive.
- The deal already cash-flows at list — no discount required.
- To meet the 1% rule (rent ≥ 1% of price), the offer needs to be $242k (12.0% below list).
- Recommended offer: $242k (12.0% below list) — sets the bar for 1% rule.
- Cap rate 6.4% vs local median 4.3% in Tinley Park — top-decile yield for the area; either an underpriced asset or a hidden risk that comps aren't pricing in. Stress-test before assuming the spread holds.
Location & tenants
- Location reads 74/100 on livability (#246 in IL, #4,453 nationally) — a middle-class / working-renter tenant base. Strengths: commute A+, employment A+, housing A+; Watch: amenities F, health & safety F.
- Rich Twp Hsd 227 (suburban): math 5% / reading 12% proficiency, ranked #577 of 620 in IL (top 93%) — low school quality limits family demand, transient renter base, plan for 1-2y turnover.
- Zoned schools: Colin Powell Middle Sch (math 8% / reading 12%, grade F, #592 of 665 statewide, top 90%, 586 students, 0% FRL); Rich Township High School (math 5% / reading 12%, grade F, #584 of 693 statewide, top 85%, 2,487 students, 0% FRL).
- Market conditions: 159 active listings in the ZIP; 4 comparable units currently listed for rent nearby; rentals leasing fast (median 0d on market — plan ~1-2 weeks tenant-placement turnaround); solid renter incomes; 6,272 units permitted in Cook County in 2024 (4,658 in 5+ unit buildings).
- This rent runs 31% of the median local income ($95k/yr) — at the standard rent-burdened threshold; future hikes will face affordability resistance.
Forward outlook
- Local home prices are declining (-3.0%/yr); year-one equity from $2k of loan paydown is wiped out by about $8k of value loss. Plan a longer hold.
Negotiation context
- It's been on market 16 days — a 2% lower offer ($271k) is reasonable based on typical stale-listing flexibility.
- 2 sale attempts since 18y ago; this cycle's ask is 107% above the opening price — seller raised mid-cycle; expect resistance to lowballs.
- Current owner paid $112k; list at $275k implies a 144% gain — meaningful room to come down on a strong offer.
Questions for the listing agent
- What does the HOA fee cover, when was the last increase, and are there any pending special assessments or reserve-fund shortfalls?
- Any open or pending special assessments — roof, HVAC, plumbing, elevator, façade? What's the per-unit balance and payoff schedule, and is the seller paying it off at close or rolling it to the buyer?
- Is there a deadline driving the sale (1031 exchange, divorce, estate, relocation)? That informs how much negotiation room exists.
- The area grade is low — what's the realistic commute time and amenity access for the typical tenant pool here? Any planned neighborhood developments (good or bad) we should know about?
- What's the average days-on-market for RENTAL listings here right now (not sales)? A rising rental-DOM trend means longer vacancies and softer asking-rent achievability than the comps imply.
- What's the recent tenant-quality profile in this submarket — average credit score on applications, eviction rate, late-payment / NSF rate, and stable-employment percentage? A property-management company in the area should have these aggregated.
- How much new apartment / multifamily construction is in the pipeline within 1–3 miles? Heavy new supply (>2% of stock underway) typically softens rents 12–24 months out; light construction supports rent growth.
Investment metrics
- 1% rule
- 0.88% ✗
- Cap rate
- 6.40%
- Cash-on-cash
- 0.37%
- DSCR
- 1.02
- GRM
- 9.5
CMA / ARV
No comps found within radius.
Projected returns pro-forma
-3.0% appreciation · 3.0% rent growth · sell at horizon
- IRR
- -15.7%
- Equity multiple
- 0.44×
- Total profit
- $-43,021
- Equity at exit
- $40,988
- IRR
- -7.2%
- Equity multiple
- 0.54×
- Total profit
- $-35,417
- Equity at exit
- $23,768
Cash invested: $76,972 (down + closing). Projections, not guarantees.
Landlord ↔ Tenant lean methodology
- Overall (STATE)
- 43 Moderately Tenant-Leaning
- State Illinois
- 43 Moderately Tenant-Leaning · D+7
- County
- — inherits STATE
- City
- — inherits STATE
ZIP-level market 60477
- Active inventory
- 159
- Price-to-rent
- 9.5×
Monthly cashflow live
- Estimated rent
- $2,420 medium interval (Pro) →
- Mortgage (P&I)
- −$1,442
- Tax from tax record
- −$102 /mo · $1,225/yr
- Insurance
- −$115
- HOA
- −$230
- Vacancy / Maint / Mgmt
- −$508
- Net cashflow
- $23
Break-even live
Sensitivity live
| Price | -10% $179 | -5% $101 | +0% $23 | +5% $-54 | +10% $-132 |
|---|---|---|---|---|---|
| Rent | -10% $-168 | -5% $-72 | +0% $23 | +5% $119 | +10% $215 |
| Rate | -1.0pp $162 | -0.5pp $93 | base $23 | +0.5pp $-48 | +1.0pp $-120 |
UW: 25.0% down · 7.5% · 30yr · 1.5% tax · 5.0% vac · 8.0% maint · 8.0% mgmt
Financing live
Cash to close
- Down payment
- $68,725
- Closing costs
- $8,247
- Reserves months
- —
- Total cash needed
- —
Loan-product check · same deal, 3 products live
Conventional
25% down · 7.5% · 30yr
- Down + closing
- —
- Monthly P&I
- —
- Monthly cashflow
- —
- DSCR
- —
- Eligible?
- —
Personal DTI + credit; lowest rate.
DSCR
20% down · 8.5% · 30yr
- Down + closing
- —
- Monthly P&I
- —
- Monthly cashflow
- —
- DSCR
- —
- Eligible?
- —
No personal income docs; deal must DSCR.
Hard money
10% down · 12.0% · 12mo
- Down + closing
- —
- Monthly P&I
- —
- Monthly cashflow
- —
- DSCR
- —
- Eligible?
- —
Short-term bridge; refi at stabilization.
Rent comps 4 comps
| Address | Beds | Baths | Sqft | Rent | $/sqft | DOM | Units | Dist |
|---|---|---|---|---|---|---|---|---|
| 7050 183rd St #411 Tinley Park, IL | 2.0 | 2.0 | 1500 | $2,600 | $1.73 | 0d | 1 | 0.89mi |
| 17871 Argos CT Orland Hills, IL | 3.0 | 2.5 | 1800 | $3,200 | $1.78 | 0d | 1 | 1.08mi |
| 17545 71st Ave Tinley Park, IL | 3.0 | 1.5 | 1144 | $1,800 | $1.57 | 3d | 1 | 1.48mi |
| 17537 70th Ct Tinley Park, IL | 3.0 | 1.5 | 1170 | $3,000 | $2.56 | 0d | 1 | 1.48mi |
HOA detail condo
- Monthly dues
- $230 · $2,760/yr
- Likely covers
- water
- Assessments
- None detected in remarks — confirm with the listing agent.
Listing history 10 events
-
2026-06-21days on market $274,900 Active 16 DOM
-
2026-06-18days on market $274,900 Active 13 DOM
-
2026-06-17days on market $274,900 Active 12 DOM
-
2026-06-16days on market $274,900 Active 11 DOM
-
2026-06-15days on market $274,900 Active 10 DOM
-
2026-06-13days on market $274,900 Active 8 DOM
-
2026-06-09days on market $274,900 Active 4 DOM
-
2026-06-08days on market $274,900 Active 3 DOM
-
2026-06-07remarks 691-char remark
-
2026-06-07$274,900 Active 2 DOM
ⓘ Source: listings_history table (triggers on properties + properties_extension) + one-shot
backfill from property_details.listing_events for pre-trigger history.
Tax reassessment forecast IL · Partial reset (capped growth)
- Current annual tax
- $1,225 · $102/mo
- Projected year-2 tax
- $3,733 · $311/mo
- Expected delta
- +$2,507/yr (+$209/mo · 204.6%)
ⓘ Screening estimate from a state-policy table — verify with the county assessor before closing.
Climate risk First Street
- Flood 3/10 Moderate FEMA zone X (unshaded) · 20% chance over 30 yrs
- Wildfire 1/10 Low
- Heat 3/10 Moderate 7 d/yr ≥102°F today · 15 d/yr by 30 yrs out
- Wind 2/10 Low
- Air quality 4/10 Moderate 4 unhealthy d/yr today · 5 by 30 yrs out
Nearby sold comps map
Loading sold comps map…
Walkable amenities ~0.75 mi
Loading nearby amenities…
Taxation est. · year 1
- Rental income
- $29,039
- − Mortgage interest
- −$15,399
- − Property taxes
- −$1,225
- − Insurance
- −$1,374
- − Repairs & maintenance
- −$2,323
- − Management
- −$2,323
- − HOA
- −$2,760
- − Depreciation
- −$7,997
- Taxable loss
- −$4,363
- Est. tax savings @ 24.0%
- +$1,047
- After-tax cash flow
- $1,329/yr
For passive investors: Depreciation is non-cash, so a rental often shows a tax loss while cash-flowing — sheltering income. Rental losses are passive: they offset passive income freely, and up to $25,000/yr can offset ordinary (W-2) income if you actively participate and your MAGI is under $100k (phasing out to $0 by $150k); unused losses carry forward. On sale, claimed depreciation is recaptured at up to 25%, and gains may owe capital-gains tax (a 1031 exchange can defer both). Figures are a year-1 estimate at your 24.0% rate — not tax advice; consult a CPA.
Schools (NCES district)
- District
- Rich Twp Hsd 227
- NCES district ID
- 1733420
- Math proficiency
- 5% ▼ -3.00%
- Reading proficiency
- 12% ▬ 0.00%
- Median HH income
- $56,056
- Composite
- 8.93/100
- National rank
- #9885
- State rank
- #577 of 620 in IL
Livability — Tinley Park
- Score
- 74/100
- State rank
- #246
- US rank
- #4453
Category grades
Schools grade is shown separately in the Schools card above.
Census & demographics
- Census place
- Tinley Park, IL
- County
- Cook County · 4,486,803 people
- City population
- 35,976
- Metro
- Chicago-Naperville-Elgin, IL-IN-WI
- Population (ZIP)
- 35,976
- Household income
- $94,927
- Rent vs Own
- Severe rent burden
- 753.0
Population outlook (Cook County) Hauer SSP2
- Today (2025)
- 5,347,519 people
- By 2030
- 5,357,703 · +0.2%
- By 2040
- 5,324,924 · -0.4%
- By 2050
- 5,230,762 · -2.2%
- By 2075
- 4,785,735 · -10.5%
- By 2100
- 4,188,836 · -21.7%
Race, ethnicity, and origin ACS 2023
- Neighborhood character
- Predominantly White (74%)
- Race & ethnicity
- White 74% Hispanic / Latino 12% Two or more races 9% Black 7% Asian 3%
- Hispanic origin (detail)
- Mexican 9% Puerto Rican 2%
- Common ancestry
- Romanian 14% Iranian 3% Lithuanian 2%
- Foreign-born
- 9% · Canada, China
- Languages at home
- 85% English-only · Spanish 6% Arabic 5% Other Indo-European 1%
Political lean MEDSL · Cook
- 2024 margin
- Solid D (+42.0) · D 70.4% · R 28.4% · Other 1.2%
- 2008→2024 swing
- -11.4pp toward R · 2008: 53.4pp · 2024: 42.0pp
- All cycles
- 2024: D+42.0 2020: D+50.3 2016: D+53.0 2012: D+49.4 2008: D+53.4
Not yet ingested
- Civics
- —
Market trends
- HPI YoY
- ▼ -272.64%
- Current HPI
- 190.7548
- Rent YoY
- —
- Metro
- Chicago-Naperville-Elgin, IL-IN-WI
- State GDP YoY
- ▲ 1.59%
- F500 in state
- 60
Industry mix (Fortune 500 HQ in IL)
| Industry | F500 HQs | Revenue |
|---|---|---|
| Insurance | 4 | $201B |
|
||
| Consumer Goods | 4 | $87B |
|
||
| Industrial Machinery | 3 | $64B |
|
||
| Healthcare | 2 | $55B |
|
||
| Retail / Pharmacy | 1 | $148B |
|
||
| Agriculture / Food | 1 | $86B |
|
||
Price history
+107.5% since first listed8 events — show timeline
- 2026-06-05 Price Changed $274,900 MRED as Distributed by MLS Grid
- 2013-02-25 Sold (Public Records) $112,500 Public Records
- 2013-01-30 Sold (MLS) $112,500 MRED as Distributed by MLS Grid
- 2013-01-11 Contingent — MRED as Distributed by MLS Grid
- 2012-07-12 Price Changed $127,500 MRED as Distributed by MLS Grid
- 2012-02-10 Listed $132,500 MRED as Distributed by MLS Grid
- 2008-08-04 Listing Removed — MRED as Distributed by MLS Grid
- 2008-05-26 Listed — MRED as Distributed by MLS Grid
Property tax history
-7.2%/yrLatest (2023): $1,225 · -24.4% YoY. Source: county tax records.
Cash-flow waterfall
monthlySold comps — $/sqft
last 12 mo · ≤1 miLoading sold comps…