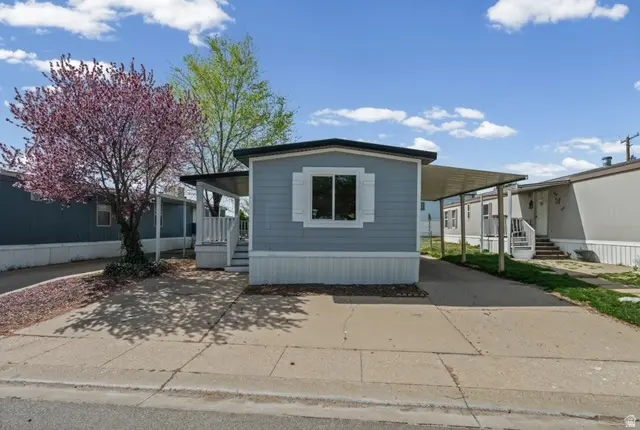
935 E 3000 N · Layton, UT
Flood risk 5/10 · Moderate
- FEMA flood zone
- X (unshaded)
- Chance of flooding over 30 yrs
- 0.24%
- Est. flood insurance / yr
- $507 – $1,088
Fire risk 6/10 · Moderate
- Est. fire insurance / yr
- $453 – $841
Heat risk 3/10 · Minor
- Hot days now (above 93°F)
- 7 days/yr
- Hot days in 30 yrs
- 17 days/yr
Wind risk 1/10 · Minimal
- Chance of severe wind over 30 yrs
- —
Air-quality risk 4/10 · Minor
- Unhealthy air days now
- 5 days/yr
- Unhealthy air days in 30 yrs
- 7 days/yr
Risk factors via First Street. Map © Google.
Why this score? — see what drove the C+ grade
The composite is a weighted blend of 9 inputs, each scored 0–100. Each bar is that input's sub-score; the figure is the points it added to the 100-point composite (weight × sub-score).
- Cash flow +23.6/30.0
- 1% rule +10.0/10.0
- DSCR +7.6/10.0
- ARV discount +7.5/15.0
- Livability +4.3/5.0
- Schools +4.1/10.0
- Condition / age +4.0/5.0
- Rent growth +2.5/5.0
- Appreciation +0.0/10.0
$70,000
🖨 Deal sheet 📄 Offer letter ✓ Due diligence
Listing remarks
Step into this newly remodeled mobile home in the heart of Layton and envision yourself home! Everything from the kitchen cabinets, appliances, bathrooms, down to the floors are new! This home features 3 bedrooms, 2 bathrooms (one of which is a primary bathroom), and a large kitchen giving you plenty of room to enjoy your new home. The community is clean and quiet with a swimming pool, playgrounds, and plenty of guest parking. Why rent an apartment when this lovely home could be all yours? Come see it today and make it yours!
Key facts
- Guest parking
- Swimming pool
- Large kitchen
Tags
Property features AI
Finance
- Other: Subdivision: Quail Ridge Manufactured Home Community
- HOA & community: Homeowners association (Quail Ridge); Monthly association fee of $1,100; Association covers grounds maintenance, sewer, trash, and water; Community amenities include clubhouse, pool, playground, picnic area, bocce ball court; pets permitted; managed maintenance
Exterior
- Parking: Covered parking; Carport (1 space); 1 total parking space
- Utilities: Natural gas connected; Electricity connected; Water connected; Sewer connected
- Home design: Manufactured home; Built and currently standing; Residential use
- Construction: Manufactured construction
- Exterior features: Partially fenced yard; Paved road access; Sidewalks; Balcony; Covered deck; Open porch; Landscaping (full and partial); Flat terrain
Interior
- Kitchen: Updated kitchen; Gas range; Microwave; Refrigerator; Portable dishwasher; Garbage disposal
- Bedrooms: Total rooms: 10
- Flooring: Carpet
- Bathrooms: 2 full bathrooms
- Heating & cooling: Gas central heating; Central air conditioning
- Interior features: Primary bathroom; Garbage disposal; Updated kitchen; Free-standing range/oven; Portable dishwasher; Microwave; Refrigerator
- Laundry & utility: Electric dryer hookup
Neighborhood map
What this means for you Summary
Snapshot
- This is a 3-bed/2.0-bath manufactured listed at $70k. Condition is rated good.
Deal economics
- At list price, monthly cash flow is $131 ($2k/yr) — positive.
- The deal already cash-flows at list — no discount required.
- Meets the 1% rule at list price ($2k rent vs $70k).
- Recommended offer: $66k (6.0% below list) — sets the bar for market timing.
Location & tenants
- Location reads 86/100 on livability (#11 in UT, #457 nationally) — a professional / high-income tenant draw. Strengths: commute A+, employment A+, housing A+.
- Davis District (suburban): math 43% / reading 47% proficiency, ranked #28 of 80 in UT (top 35%) — families likely to look elsewhere, expect single-tenant / working-renter base with shorter leases; only 19% free/reduced lunch — higher-income household profile.
- Zoned schools: Mountain View School (math 50% / reading 50%, grade D+, #161 of 585 statewide, top 29%, 781 students, 21% FRL); North Layton Jr High (math 39% / reading 40%, grade F, #75 of 138 statewide, top 56%, 1,009 students, 30% FRL); Northridge High (math 24% / reading 43%, grade F, #106 of 171 statewide, top 62%, 1,954 students, 23% FRL).
- Market conditions: 182 active listings in the ZIP; 4 comparable units currently listed for rent nearby; rentals at typical pace (median 14d on market — plan ~3-4 weeks tenant-placement turnaround); high-income renter base; 1,461 units permitted in Davis County in 2024 (508 in 5+ unit buildings).
Forward outlook
- Local home prices are declining (-3.0%/yr); year-one equity from $484 of loan paydown is wiped out by about $2k of value loss. Plan a longer hold.
- Davis County population projected at +39% by 2050 — long-run rental-demand tailwind backs the buy-and-hold thesis.
Negotiation context
- It's been on market 79 days — a 6% lower offer ($66k) is reasonable based on typical stale-listing flexibility.
- 14 sale attempts since 28y ago; this cycle's ask has dropped $5k (7%) from the opening price — seller is motivated, your offer sets the floor, not the list.
Risks & watch-outs
- Watch-outs: HOA is 51% of rent.
- Climate carrying-cost: moderate flood risk; major wildfire risk — expect insurance premiums to compound above CPI over the hold.
Questions for the listing agent
- It's been on market 79 days. Have you received any prior offers? Is the seller open to a 6% concession, seller financing, or rate buy-down credit?
- What does the HOA fee cover, when was the last increase, and are there any pending special assessments or reserve-fund shortfalls?
- Why hasn't it sold? Are there any deal-killer items the seller is aware of (foundation, flood, title, zoning, code violations)?
- Is there a deadline driving the sale (1031 exchange, divorce, estate, relocation)? That informs how much negotiation room exists.
- Schools are B-rated — typically a magnet for longer-tenancy family renters. What's the average tenant stay here, and is there a school-zone premium baked into asking?
- What's the average days-on-market for RENTAL listings here right now (not sales)? A rising rental-DOM trend means longer vacancies and softer asking-rent achievability than the comps imply.
- What's the recent tenant-quality profile in this submarket — average credit score on applications, eviction rate, late-payment / NSF rate, and stable-employment percentage? A property-management company in the area should have these aggregated.
- How much new for-sale + rental construction is in the pipeline within 1–3 miles? Heavy new supply typically softens prices + rents 12–24 months out; constrained supply supports both.
Investment metrics
- 1% rule
- 3.10% ✓
- Cap rate
- 8.55%
- Cash-on-cash
- 8.05%
- DSCR
- 1.36
- GRM
- 2.7
CMA / ARV
No comps found within radius.
Projected returns pro-forma
-3.0% appreciation · 3.0% rent growth · sell at horizon
- IRR
- -3.0%
- Equity multiple
- 0.88×
- Total profit
- $-2,261
- Equity at exit
- $10,437
- IRR
- 7.6%
- Equity multiple
- 1.60×
- Total profit
- $11,692
- Equity at exit
- $6,052
Cash invested: $19,600 (down + closing). Projections, not guarantees.
Landlord ↔ Tenant lean methodology
- Overall (STATE)
- 86 Strongly Landlord-Friendly
- State Utah
- 86 Strongly Landlord-Friendly · R+15
- County
- — inherits STATE
- City
- — inherits STATE
ZIP-level market 84040
- Active inventory
- 182
- Price-to-rent
- 2.7×
Monthly cashflow live
- Estimated rent
- $2,171 medium interval (Pro) →
- Mortgage (P&I)
- −$367
- Tax est. 1.5%
- −$88 /mo · $1,050/yr
- Insurance
- −$29
- HOA
- −$1,100
- Vacancy / Maint / Mgmt
- −$456
- Net cashflow
- $131
Break-even live
UW: 25.0% down · 7.5% · 30yr · 1.5% tax · 5.0% vac · 8.0% maint · 8.0% mgmt
Financing live
Cash to close
- Down payment
- $17,500
- Closing costs
- $2,100
- Reserves months
- —
- Total cash needed
- —
Loan-product check · same deal, 3 products live
Conventional
25% down · 7.5% · 30yr
- Down + closing
- —
- Monthly P&I
- —
- Monthly cashflow
- —
- DSCR
- —
- Eligible?
- —
Personal DTI + credit; lowest rate.
DSCR
20% down · 8.5% · 30yr
- Down + closing
- —
- Monthly P&I
- —
- Monthly cashflow
- —
- DSCR
- —
- Eligible?
- —
No personal income docs; deal must DSCR.
Hard money
10% down · 12.0% · 12mo
- Down + closing
- —
- Monthly P&I
- —
- Monthly cashflow
- —
- DSCR
- —
- Eligible?
- —
Short-term bridge; refi at stabilization.
Rent comps 4 comps
| Address | Beds | Baths | Sqft | Rent | $/sqft | DOM | Units | Dist |
|---|---|---|---|---|---|---|---|---|
| 1375 East Layton, UT | 1.0–3.0 | 1.0–2.5 | 1212 | $2,375 | $1.96 | 14d | 14 | 0.49mi |
| 2925 N Church St Layton, UT | 1.0–3.0 | 1.0–2.0 | 960 | $1,699 | $1.77 | 14d | 6 | 0.52mi |
| 2525 N Hill Field Rd Layton, UT | 2.0 | 1.0 | 775 | $1,659 | $2.14 | 23d | 1 | 1.36mi |
| 2955 N 400 W Layton, UT | 2.0 | 1.0 | 581 | $1,417 | $2.44 | 14d | 45 | 1.40mi |
HOA detail
- Monthly dues
- $1,100 · $13,200/yr
- Likely covers
- landscapingpool
Listing history 43 events
-
2026-06-18days on market $70,000 Active 79 DOM
-
2026-06-17days on market $70,000 Active 78 DOM
-
2026-06-16days on market $70,000 Active 77 DOM
-
2026-06-15days on market $70,000 Active 76 DOM
-
2026-06-14days on market $70,000 Active 74 DOM
-
2026-06-13days on market $70,000 Active 73 DOM
-
2026-06-10days on market $70,000 Active 71 DOM
-
2026-06-09days on market $70,000 Active 70 DOM
-
2026-06-08pricedays on market $70,000 Active 69 DOM
-
2026-06-07days on market $75,000 Active 68 DOM
-
2026-06-05days on market $75,000 Active 65 DOM
-
2026-06-03days on market $75,000 Active 64 DOM
-
2026-06-02days on market $75,000 Active 63 DOM
-
2026-06-01days on market $75,000 Active 62 DOM
-
2026-05-31days on market $75,000 Active 61 DOM
-
2026-05-31days on market $75,000 Active 60 DOM
-
2026-03-31$75,000 Active
-
2012-10-24historical
-
2012-04-24$32,500
-
2009-02-22historical
-
2008-09-25$35,000
-
2006-09-30historical
-
2006-08-24$37,500
-
2005-06-07historical
-
2005-05-10historical
-
2005-03-25$37,000
-
2005-03-21soldstatus
-
2005-03-07$8,000
-
2004-10-15soldstatus
-
2004-08-07$11,900
-
2004-03-17$19,000
-
2003-10-13historical
-
2003-08-11$23,900
-
2000-12-26historical
-
2000-07-07historical
-
2000-06-26$33,500
-
1999-08-17historical
-
1999-07-15historical
-
1999-07-07$27,500
-
1999-06-29$43,900
-
1999-03-29historical
-
1998-10-05$36,000
-
1998-08-19$28,500
ⓘ Source: listings_history table (triggers on properties + properties_extension) + one-shot
backfill from property_details.listing_events for pre-trigger history.
Climate risk First Street
- Flood 5/10 Major FEMA zone X (unshaded) · 24% chance over 30 yrs
- Wildfire 6/10 Major
- Heat 3/10 Moderate 7 d/yr ≥93°F today · 17 d/yr by 30 yrs out
- Wind 1/10 Low
- Air quality 4/10 Moderate 5 unhealthy d/yr today · 7 by 30 yrs out
Nearby sold comps map
Loading sold comps map…
Walkable amenities ~0.75 mi
Loading nearby amenities…
Taxation est. · year 1
- Rental income
- $26,054
- − Mortgage interest
- −$3,921
- − Property taxes
- −$1,050
- − Insurance
- −$350
- − Repairs & maintenance
- −$2,084
- − Management
- −$2,084
- − HOA
- −$13,200
- − Depreciation
- −$2,036
- Taxable income
- $1,328
- Est. tax owed @ 24.0%
- −$319
- After-tax cash flow
- $1,259/yr
For passive investors: Depreciation is non-cash, so a rental often shows a tax loss while cash-flowing — sheltering income. Rental losses are passive: they offset passive income freely, and up to $25,000/yr can offset ordinary (W-2) income if you actively participate and your MAGI is under $100k (phasing out to $0 by $150k); unused losses carry forward. On sale, claimed depreciation is recaptured at up to 25%, and gains may owe capital-gains tax (a 1031 exchange can defer both). Figures are a year-1 estimate at your 24.0% rate — not tax advice; consult a CPA.
Condition & rehab AI · 12 photos
This newly remodeled mobile home is in excellent condition with no visible damage. It features a good exterior, interior walls, flooring, bathrooms, kitchen, roof, windows, foundation, structure, HVAC, and landscaping. The home is move-in ready and would benefit from painting, landscaping, and flooring upgrades to further enhance its value.
Value-add opportunities
- Both Painting the exterior and interior walls — Fresh paint can enhance the curb appeal and interior aesthetics.
- Both Landscaping the front yard — A well-maintained front yard can improve curb appeal and add value to the property.
- Both Upgrading the flooring in the kitchen and bathrooms — Upgrading the flooring can improve the overall look and feel of the home and add value to the property.
Renovation cost estimate screening
Value-add ROI direction
- Both Painting the exterior and interior walls — Fresh paint can enhance the curb appeal and interior aesthetics. ↑
- Both Landscaping the front yard — A well-maintained front yard can improve curb appeal and add value to the property. ↑
- Both Upgrading the flooring in the kitchen and bathrooms — Upgrading the flooring can improve the overall look and feel of the home and add value to the property. ↑
ⓘ Cost ranges are severity-bucket heuristics (US national rule-of-thumb). Get contractor quotes + a written scope before underwriting a rehab budget.
Schools (NCES district)
- District
- Davis District
- NCES district ID
- 4900210
- Math proficiency
- 43% ▼ -9.00%
- Reading proficiency
- 47% ▼ -5.00%
- Median HH income
- $70,511
- Composite
- 40.59/100
- National rank
- #3698
- State rank
- #28 of 80 in UT
Livability — Layton
- Score
- 86/100
- State rank
- #11
- US rank
- #457
Category grades
Schools grade is shown separately in the Schools card above.
Census & demographics
- Census place
- Layton, UT
- County
- Davis County · 341,755 people
- City population
- 83,689
- Metro
- Ogden-Clearfield, UT
- Population (ZIP)
- 28,509
- Household income
- $128,365
- Rent vs Own
- Severe rent burden
- 137.0
Population outlook (Davis County) Hauer SSP2
- Today (2025)
- 399,271 people
- By 2030
- 430,528 · +7.8%
- By 2040
- 493,485 · +23.6%
- By 2050
- 555,187 · +39.1%
- By 2075
- 688,589 · +72.5%
- By 2100
- 769,646 · +92.8%
Race, ethnicity, and origin ACS 2023
- Neighborhood character
- Predominantly White (81%)
- Race & ethnicity
- White 81% Hispanic / Latino 11% Two or more races 7% Asian 2% Black 1%
- Hispanic origin (detail)
- Mexican 5%
- Common ancestry
- Italian 5% Slovak 5% Portuguese 2%
- Foreign-born
- 4% · Canada
- Languages at home
- 91% English-only · Spanish 5% Other Indo-European 1% Tagalog/Filipino 1%
Political lean MEDSL · Davis
- 2024 margin
- Strong R (+24.9) · D 36.0% · R 60.8% · Other 3.2%
- 2008→2024 swing
- +17.4pp toward D · 2008: -42.3pp · 2024: -24.9pp
- All cycles
- 2024: R+24.9 2020: R+27.5 2016: R+23.3 2012: R+61.8 2008: R+42.3
Not yet ingested
- Civics
- —
Market trends
- HPI YoY
- ▼ -328.02%
- Current HPI
- 295.6671
- Rent YoY
- —
- Metro
- Ogden-Clearfield, UT
- State GDP YoY
- ▲ 3.54%
- F500 in state
- 2
Industry mix (Fortune 500 HQ in UT)
| Industry | F500 HQs | Revenue |
|---|---|---|
| Financial Services | 1 | $3B |
|
||
Price history
+163.2% since first listed27 events — show timeline
- 2026-03-31 Listed $75,000 WFRMLS
- 2012-10-24 Listing Removed — WFRMLS
- 2012-04-24 Listed $32,500 WFRMLS
- 2009-02-22 Listing Removed — WFRMLS
- 2008-09-25 Listed $35,000 WFRMLS
- 2006-09-30 Listing Removed — WFRMLS
- 2006-08-24 Listed $37,500 WFRMLS
- 2005-06-07 Listing Removed — WFRMLS
- 2005-05-10 Listing Removed — WFRMLS
- 2005-03-25 Listed $37,000 WFRMLS
- 2005-03-21 Sold (MLS) — WFRMLS
- 2005-03-07 Listed $8,000 WFRMLS
- 2004-10-15 Sold (MLS) — WFRMLS
- 2004-08-07 Listed $11,900 WFRMLS
- 2004-03-17 Listed $19,000 WFRMLS
- 2003-10-13 Listing Removed — WFRMLS
- 2003-08-11 Listed $23,900 WFRMLS
- 2000-12-26 Listing Removed — WFRMLS
- 2000-07-07 Listing Removed — WFRMLS
- 2000-06-26 Listed $33,500 WFRMLS
- 1999-08-17 Listing Removed — WFRMLS
- 1999-07-15 Listing Removed — WFRMLS
- 1999-07-07 Listed $27,500 WFRMLS
- 1999-06-29 Listed $43,900 WFRMLS
- 1999-03-29 Listing Removed — WFRMLS
- 1998-10-05 Listed $36,000 WFRMLS
- 1998-08-19 Listed $28,500 WFRMLS
Cash-flow waterfall
monthlySold comps — $/sqft
last 12 mo · ≤1 miLoading sold comps…