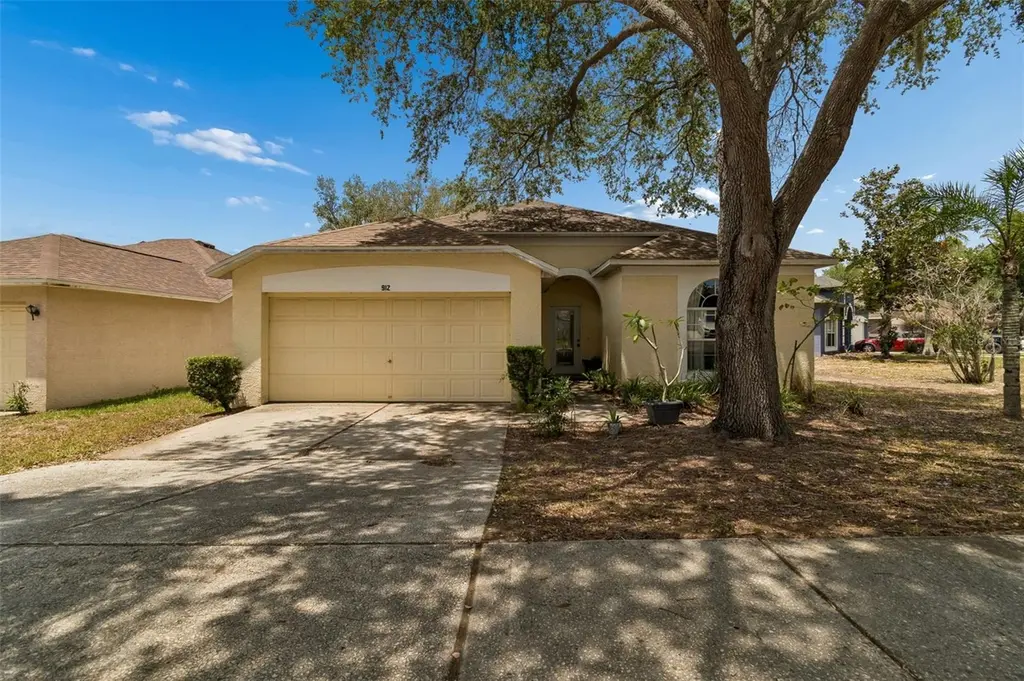
912 Grand Canyon Dr · Valrico, FL
Flood risk 1/10 · Minimal
- FEMA flood zone
- X (unshaded)
- Chance of flooding over 30 yrs
- 0.0%
- Est. flood insurance / yr
- $507 – $1,088
Fire risk 5/10 · Moderate
- Est. fire insurance / yr
- $947 – $1,759
Heat risk 10/10 · Severe
- Hot days now (above 109°F)
- 7 days/yr
- Hot days in 30 yrs
- 25 days/yr
Wind risk 9/10 · Severe
- Chance of severe wind over 30 yrs
- 99.0%
Air-quality risk 3/10 · Minor
- Unhealthy air days now
- 3 days/yr
- Unhealthy air days in 30 yrs
- 4 days/yr
Risk factors via First Street. Map © Google.
Why this score? — see what drove the D grade
The composite is a weighted blend of 9 inputs, each scored 0–100. Each bar is that input's sub-score; the figure is the points it added to the 100-point composite (weight × sub-score).
- Cash flow +13.1/30.0
- ARV discount +7.5/15.0
- Schools +4.2/10.0
- DSCR +3.9/10.0
- Livability +3.5/5.0
- 1% rule +3.2/10.0
- Rent growth +3.0/5.0
- Condition / age +2.5/5.0
- Appreciation +0.0/10.0
$279,000
🖨 Deal sheet (PDF) 📄 Offer letter ✓ Due diligence
Listing remarks MLS
NO REO OR SS. This MI built Harvard plan is an Immaculate 3/2/2 and has it all. Real hardwood floors in main living area and crown molding with corner finials in all rooms but kitchen. All door casing in main living area is upgraded with rosettes at corners. Kitchen includes all appliances and a huge closet pantry with eating space. Foyer and dining room have highend matching ceiling fixtures. When built builder used a 30 yr shingle, HVAC replaced in 2006. DONT MISS THIS ONE AS IT VERY CLEAN AND READY.
Key facts
- Updated ac
- Split floorplan
- Extra-wide pantry
Tags
Property features AI
Finance
- Other: Lot about 0.2 acres (under 1/4 acre); Zoned PD
- Financial info: No lease restrictions indicated
- HOA & community: Homeowners association required; HOA dues $100 quarterly (approx. $33.33/month); Association contact: Chris Crain; Pets allowed
Exterior
- Parking: Attached garage; 2-car garage
- Utilities: Public water; Public sewer; Public utilities
- Home design: Single-family residence; One story; East-facing
- Construction: Stucco construction; Shingle roof; Block foundation; Built on one level
- Exterior features: Sidewalk; Sliding doors; Asphalt road access
Interior
- Kitchen: Dishwasher; Disposal; Range; Refrigerator
- Bedrooms: 3 bedrooms
- Flooring: Carpet; Vinyl; Wood
- Bathrooms: 2 full bathrooms
- Heating & cooling: Central heating; Central air conditioning
- Interior features: Ceiling fans; Split-bedroom layout; Vaulted ceilings
- Laundry & utility: Washer; Dryer; Laundry area located in the garage
Neighborhood map
What this means for you Summary
Snapshot
- This is a 3-bed/2.0-bath single-family listed at $279k.
Deal economics
- At list price, monthly cash flow is $-10 ($-119/yr) — negative.
- To cash-flow at today's rent, offer at most $277k (0.6% below list).
- To meet the 1% rule (rent ≥ 1% of price), the offer needs to be $227k (18.5% below list).
- Recommended offer: $227k (18.5% below list) — sets the bar for 1% rule.
Location & tenants
- Location reads 70/100 on livability (#442 in FL) — a middle-class / working-renter tenant base. Strengths: housing A+, crime A, employment A; Watch: amenities F, commute F, health & safety F.
- Hillsborough (suburban): math 47% / reading 50% proficiency, ranked #41 of 73 in FL (top 56%) — families likely to look elsewhere, expect single-tenant / working-renter base with shorter leases.
- Zoned schools: Nelson Elementary School (math 50% / reading 47%, grade D, #1,152 of 2,144 statewide, top 55%, 719 students, 54% FRL); Mulrennan Middle School (math 55% / reading 59%, grade B, #164 of 571 statewide, top 30%, 1,185 students, 47% FRL); Durant High School (math 43% / reading 44%, grade F, #248 of 667 statewide, top 38%, 2,589 students, 42% FRL) — zoned schools at 48% FRL track the district average.
- Market conditions: Rents rising (+2.2%/yr); 217 active listings in the ZIP; 26 comparable units currently listed for rent nearby; rentals at typical pace (median 20d on market — plan ~3-4 weeks tenant-placement turnaround); solid renter incomes; 9,053 units permitted in Hillsborough County in 2024 (4,555 in 5+ unit buildings).
Forward outlook
- Local home prices are declining (-3.0%/yr); year-one equity from $2k of loan paydown is wiped out by about $8k of value loss. Plan a longer hold.
- Hillsborough County population projected at +37% by 2050 — long-run rental-demand tailwind backs the buy-and-hold thesis.
Negotiation context
- It's been on market 19 days — a 2% lower offer ($275k) is reasonable based on typical stale-listing flexibility.
- 2 sale attempts since 13y ago; this cycle's ask has dropped $26k (9%) from the opening price — seller is motivated, your offer sets the floor, not the list.
- Current owner paid $130k; list at $279k implies a 115% gain — meaningful room to come down on a strong offer.
Risks & watch-outs
- Climate carrying-cost: severe wind risk, 99% chance of damaging wind over 30y; moderate wildfire risk; extreme-heat days projected 7→25/yr by 2055 (HVAC capex compounding) — expect insurance premiums to compound above CPI over the hold.
Questions for the listing agent
- What do current leases actually rent for vs. the listed asking? Can we see a recent rent roll and the last 12 months of T-12 income?
- What does the HOA fee cover, when was the last increase, and are there any pending special assessments or reserve-fund shortfalls?
- Is there a deadline driving the sale (1031 exchange, divorce, estate, relocation)? That informs how much negotiation room exists.
- Schools are B-rated — typically a magnet for longer-tenancy family renters. What's the average tenant stay here, and is there a school-zone premium baked into asking?
- The area grade is low — what's the realistic commute time and amenity access for the typical tenant pool here? Any planned neighborhood developments (good or bad) we should know about?
- What's the average days-on-market for RENTAL listings here right now (not sales)? A rising rental-DOM trend means longer vacancies and softer asking-rent achievability than the comps imply.
- What's the recent tenant-quality profile in this submarket — average credit score on applications, eviction rate, late-payment / NSF rate, and stable-employment percentage? A property-management company in the area should have these aggregated.
- How much new for-sale + rental construction is in the pipeline within 1–3 miles? Heavy new supply typically softens prices + rents 12–24 months out; constrained supply supports both.
Investment metrics
- 1% rule
- 0.82% ✗
- Cap rate
- 6.25%
- Cash-on-cash
- -0.15%
- DSCR
- 0.99
- GRM
- 10.2
CMA / ARV
No comps found within radius.
Projected returns pro-forma
-3.0% appreciation · 2.19% rent growth · sell at horizon
- IRR
- -17.4%
- Equity multiple
- 0.39×
- Total profit
- $-47,720
- Equity at exit
- $41,600
- IRR
- -11.0%
- Equity multiple
- 0.36×
- Total profit
- $-49,955
- Equity at exit
- $24,123
Cash invested: $78,120 (down + closing). Projections, not guarantees.
Landlord ↔ Tenant lean methodology
- Overall (STATE)
- 87 Strongly Landlord-Friendly
- State Florida
- 87 Strongly Landlord-Friendly · R+3
- County
- — inherits STATE
- City
- — inherits STATE
ZIP-level market 33594
- Rents YoY
- 2.2%
- Active inventory
- 217
- Price-to-rent
- 10.2×
Monthly cashflow live
- Estimated rent
- $2,275 high interval (Pro) →
- Mortgage (P&I)
- −$1,463
- Tax from tax record
- −$195 /mo · $2,337/yr
- Insurance
- −$116
- HOA
- −$33
- Lot rent
- −$0
- Vacancy / Maint / Mgmt
- −$478
- Net cashflow
- $-10
Break-even live
Sensitivity live
| Price | -10% $148 | -5% $69 | +0% $-10 | +5% $-89 | +10% $-168 |
|---|---|---|---|---|---|
| Rent | -10% $-190 | -5% $-100 | +0% $-10 | +5% $80 | +10% $170 |
| Rate | -1.0pp $131 | -0.5pp $61 | base $-10 | +0.5pp $-82 | +1.0pp $-156 |
UW: 25.0% down · 7.5% · 30yr · 1.5% tax · 5.0% vac · 8.0% maint · 8.0% mgmt
Financing live
Cash to close
- Down payment
- $69,750
- Closing costs
- $8,370
- Reserves months
- —
- Total cash needed
- —
Loan-product check · same deal, 3 products live
Conventional
25% down · 7.5% · 30yr
- Down + closing
- —
- Monthly P&I
- —
- Monthly cashflow
- —
- DSCR
- —
- Eligible?
- —
Personal DTI + credit; lowest rate.
DSCR
20% down · 8.5% · 30yr
- Down + closing
- —
- Monthly P&I
- —
- Monthly cashflow
- —
- DSCR
- —
- Eligible?
- —
No personal income docs; deal must DSCR.
Hard money
10% down · 12.0% · 12mo
- Down + closing
- —
- Monthly P&I
- —
- Monthly cashflow
- —
- DSCR
- —
- Eligible?
- —
Short-term bridge; refi at stabilization.
Rent comps 26 comps
| Address | Beds | Baths | Sqft | Rent | $/sqft | DOM | Units | Dist |
|---|---|---|---|---|---|---|---|---|
| 918 Grand Canyon Dr Valrico, FL | 3.0 | 2.0 | 1330 | $2,200 | $1.65 | 26d | 1 | 0.00mi |
| 919 Grand Canyon Dr Valrico, FL | 3.0 | 2.0 | 1700 | $2,300 | $1.35 | 7d | 1 | 0.03mi |
| 4408 Horseshoe Pick Ln Valrico, FL | 3.0 | 2.0 | 1374 | $2,210 | $1.61 | 1d | 1 | 0.13mi |
| 1263 Piney Branch Cir Valrico, FL | 3.0 | 2.0 | 1314 | $1,800 | $1.37 | 17d | 1 | 0.20mi |
| 840 Rocky Mountain Ct Valrico, FL | 3.0 | 2.0 | 1847 | $2,350 | $1.27 | 1d | 1 | 0.29mi |
| 1209 Hawley Ct Valrico, FL | 3.0 | 2.0 | 1420 | $2,265 | $1.60 | 1d | 1 | 0.30mi |
| 4617 Newbourne Way Valrico, FL | 3.0 | 2.0 | 1516 | $2,100 | $1.39 | 7d | 1 | 0.38mi |
| 1102 Lumsden Trace Cir Valrico, FL | 3.0 | 2.0 | 1822 | $2,306 | $1.27 | 26d | 1 | 0.42mi |
| 3406 Palm Beach Dr Valrico, FL | 3.0 | 2.0 | 1272 | $1,855 | $1.46 | 1d | 1 | 0.45mi |
| 4906 Copper Canyon Blvd Valrico, FL | 3.0 | 2.0 | 1433 | $2,105 | $1.47 | 20d | 1 | 0.48mi |
| 914 Cape Cod Cir Valrico, FL | 4.0 | 2.0 | 1438 | $2,139 | $1.49 | 24d | 1 | 0.51mi |
| 3510 Petticoat Jct Valrico, FL | 2.0 | 2.0 | 1595 | $1,650 | $1.03 | 26d | 1 | 0.56mi |
| 1707 Tallowtree Cir Valrico, FL | 3.0 | 2.0 | 1615 | $2,220 | $1.37 | 1d | 1 | 0.73mi |
| 4318 Brooke Dr Valrico, FL | 3.0 | 2.0 | 1852 | $2,486 | $1.34 | 26d | 1 | 0.78mi |
| 209 Woodknoll Pl Valrico, FL | 4.0 | 2.5 | 1734 | $2,200 | $1.27 | 26d | 1 | 0.83mi |
| 207 English Channel Pl Dover, FL | 3.0 | 2.0 | 1555 | $2,079 | $1.34 | 7d | 1 | 0.85mi |
| 109 Woodknoll Pl Valrico, FL | 2.0 | 1.5 | 1315 | $2,000 | $1.52 | 20d | 1 | 0.94mi |
| 3419 Dragon View Ct Valrico, FL | 2.0 | 2.5 | 1560 | $1,775 | $1.14 | 26d | 1 | 0.99mi |
| 3425 Dragon View Ct Valrico, FL | 3.0 | 2.5 | 1408 | $1,750 | $1.24 | 26d | 1 | 0.99mi |
| 228 Draw Bridge Ln Valrico, FL | 3.0 | 2.5 | 1408 | $1,816 | $1.29 | 1d | 1 | 1.03mi |
| 3338 Spy Tower Ct Valrico, FL | 3.0 | 2.5 | 1408 | $1,823 | $1.29 | 26d | 1 | 1.06mi |
| 3324 Spy Tower Ct Valrico, FL | 3.0 | 2.5 | 1408 | $1,795 | $1.27 | 19d | 1 | 1.06mi |
| 545 Summer Sails Dr Valrico, FL | 3.0 | 2.0 | 1334 | $1,995 | $1.50 | 26d | 1 | 1.12mi |
| 2947 Royal Tuscan Ln Valrico, FL | 3.0 | 2.5 | 1573 | $2,250 | $1.43 | 1d | 1 | 1.23mi |
| 3126 Pine Top Dr Valrico, FL | 4.0 | 2.0 | 1464 | $1,850 | $1.26 | 26d | 1 | 1.47mi |
| 3126 Pine Top Dr Valrico, FL | 4.0 | 2.0 | 1464 | $1,850 | $1.26 | 7d | 1 | 1.47mi |
HOA detail
- Monthly dues
- $33 · $396/yr
Listing history 5 events
-
2026-05-11price $289,000 1028-char remark
-
2026-05-08$305,000 Active 1028-char remark
-
2013-04-26soldstatus $130,000
-
2013-04-25soldstatus $130,000 507-char remark
Show marketing remark (507 chars)
NO REO OR SS. This MI built Harvard plan is an Immaculate 3/2/2 and has it all. Real hardwood floors in main living area and crown molding with corner finials in all rooms but kitchen. All door casing in main living area is upgraded with rosettes at corners. Kitchen includes all appliances and a huge closet pantry with eating space. Foyer and dining room have highend matching ceiling fixtures. When built builder used a 30 yr shingle, HVAC replaced in 2006. DONT MISS THIS ONE AS IT VERY CLEAN AND READY.
-
2013-01-14$131,500 507-char remark
Show marketing remark (507 chars)
NO REO OR SS. This MI built Harvard plan is an Immaculate 3/2/2 and has it all. Real hardwood floors in main living area and crown molding with corner finials in all rooms but kitchen. All door casing in main living area is upgraded with rosettes at corners. Kitchen includes all appliances and a huge closet pantry with eating space. Foyer and dining room have highend matching ceiling fixtures. When built builder used a 30 yr shingle, HVAC replaced in 2006. DONT MISS THIS ONE AS IT VERY CLEAN AND READY.
ⓘ Source: listings_history table (triggers on properties + properties_extension) + one-shot
backfill from property_details.listing_events for pre-trigger history.
Tax reassessment forecast FL · Resets to sale price
- Current annual tax
- $2,337 · $195/mo
- Projected year-2 tax
- $2,337 · $195/mo
- Expected delta
- $0/yr ($0/mo · 0.0%)
ⓘ Screening estimate from a state-policy table — verify with the county assessor before closing.
Climate risk First Street
- Flood 1/10 Low FEMA zone X (unshaded) · 0% chance over 30 yrs
- Wildfire 5/10 Major
- Heat 10/10 Extreme 7 d/yr ≥109°F today · 25 d/yr by 30 yrs out
- Wind 9/10 Extreme 99% chance of damaging wind over 30 yrs
- Air quality 3/10 Moderate 3 unhealthy d/yr today · 4 by 30 yrs out
Nearby sold comps map
Loading sold comps map…
Walkable amenities ~0.75 mi
Loading nearby amenities…
Taxation est. · year 1
- Rental income
- $27,300
- − Mortgage interest
- −$15,628
- − Property taxes
- −$2,337
- − Insurance
- −$1,395
- − Repairs & maintenance
- −$2,184
- − Management
- −$2,184
- − HOA
- −$396
- − Depreciation
- −$8,116
- Taxable loss
- −$4,941
- Est. tax savings @ 24.0%
- +$1,186
- After-tax cash flow
- $1,067/yr
For passive investors: Depreciation is non-cash, so a rental often shows a tax loss while cash-flowing — sheltering income. Rental losses are passive: they offset passive income freely, and up to $25,000/yr can offset ordinary (W-2) income if you actively participate and your MAGI is under $100k (phasing out to $0 by $150k); unused losses carry forward. On sale, claimed depreciation is recaptured at up to 25%, and gains may owe capital-gains tax (a 1031 exchange can defer both). Figures are a year-1 estimate at your 24.0% rate — not tax advice; consult a CPA.
Schools (NCES district)
- District
- Hillsborough
- NCES district ID
- 1200870
- Math proficiency
- 47% ▼ -8.00%
- Reading proficiency
- 50% ▼ -4.00%
- Median HH income
- $50,622
- Composite
- 41.6/100
- National rank
- #3435
- State rank
- #41 of 73 in FL
Livability — Valrico
- Score
- 70/100
- State rank
- #442
- US rank
- #7901
Category grades
Schools grade is shown separately in the Schools card above.
Census & demographics
- Census place
- Valrico, FL
- County
- Hillsborough County · 1,540,968 people
- City population
- 65,118
- Metro
- Tampa-St. Petersburg-Clearwater, FL
- Population (ZIP)
- 37,361
- Household income
- $96,628
- Rent vs Own
- Severe rent burden
- 568.0
Population outlook (Hillsborough County) Hauer SSP2
- Today (2025)
- 1,607,022 people
- By 2030
- 1,733,968 · +7.9%
- By 2040
- 1,979,565 · +23.2%
- By 2050
- 2,203,427 · +37.1%
- By 2075
- 2,667,893 · +66.0%
- By 2100
- 2,891,558 · +79.9%
Race, ethnicity, and origin ACS 2023
- Neighborhood character
- Diverse neighborhood (Simpson 0.65)
- Race & ethnicity
- White 52% Hispanic / Latino 25% Two or more races 17% Black 15% Asian 4%
- Hispanic origin (detail)
- Mexican 4% Puerto Rican 8% Cuban 3% Dominican 2%
- Common ancestry
- Romanian 2% Hispanic 2% Lithuanian 2%
- Foreign-born
- 17% · Canada, Jamaica, Dominican Republic
- Languages at home
- 72% English-only · Spanish 19% Other Indo-European 2% Other Asian/Pacific 2%
Political lean MEDSL · Hillsborough
- 2024 margin
- Toss-up / Even · D 47.8% · R 50.9% · Other 1.3%
- 2008→2024 swing
- -10.2pp toward R · 2008: 7.1pp · 2024: -3.1pp
- All cycles
- 2024: R+3.1 2020: D+6.9 2016: D+6.8 2012: D+6.7 2008: D+7.1
Not yet ingested
- Civics
- —
Market trends
- HPI YoY
- ▼ -226.31%
- Current HPI
- 317.0404
- Rent YoY
- ▲ 2.19%
- Metro
- Tampa-St. Petersburg-Clearwater, FL
- State GDP YoY
- ▲ 3.28%
- F500 in state
- 36
Industry mix (Fortune 500 HQ in FL)
| Industry | F500 HQs | Revenue |
|---|---|---|
| Industrial Technology | 2 | $29B |
|
||
| Insurance | 2 | $17B |
|
||
| Retail | 1 | $60B |
|
||
| Technology Distribution | 1 | $58B |
|
||
| Homebuilding | 1 | $35B |
|
||
| Technology Manufacturing | 1 | $35B |
|
||
Price history
+112.2% since first listed7 events — show timeline
- 2026-05-27 Pending — Stellar MLS as Distributed by MLS Grid
- 2026-05-19 Price Changed $279,000 Stellar MLS as Distributed by MLS Grid
- 2026-05-11 Price Changed $289,000 Stellar MLS as Distributed by MLS Grid
- 2026-05-08 Listed $305,000 Stellar MLS as Distributed by MLS Grid
- 2013-04-26 Sold (Public Records) $130,000 Public Records
- 2013-04-25 Sold (MLS) $130,000 Stellar MLS as Distributed by MLS Grid
- 2013-01-14 Listed $131,500 Stellar MLS as Distributed by MLS Grid
Property tax history
+3.8%/yrLatest (2025): $2,337 · +9.8% YoY. Source: county tax records.
Cash-flow waterfall
monthlySold comps — $/sqft
last 12 mo · ≤1 miLoading sold comps…