 🌊 Lakefront
1384 Highway 23 Unit 3 · Kanabec, MN
Flood risk 6/10 · Moderate
- FEMA flood zone
- —
- Chance of flooding over 30 yrs
- 0.68%
- Est. flood insurance / yr
- —
Fire risk 3/10 · Minor
- Est. fire insurance / yr
- $888 – $1,650
Heat risk 1/10 · Minimal
- Hot days now (above 96°F)
- 7 days/yr
- Hot days in 30 yrs
- 13 days/yr
Wind risk 1/10 · Minimal
- Chance of severe wind over 30 yrs
- —
Air-quality risk 2/10 · Minimal
- Unhealthy air days now
- 1 days/yr
- Unhealthy air days in 30 yrs
- 1 days/yr
Risk factors via First Street. Map © Google.
Why this score? — see what drove the D grade
The composite is a weighted blend of 9 inputs, each scored 0–100. Each bar is that input's sub-score; the figure is the points it added to the 100-point composite (weight × sub-score).
- Appreciation +10.0/10.0
- Cash flow +8.4/30.0
- ARV discount +7.5/15.0
- Schools +3.0/10.0
- Rent growth +2.5/5.0
- Livability +2.5/5.0
- Condition / age +2.5/5.0
- DSCR +2.3/10.0
- 1% rule +1.3/10.0
$169,900
🖨 Deal sheet (PDF) 📄 Offer letter ✓ Due diligence
Listing remarks
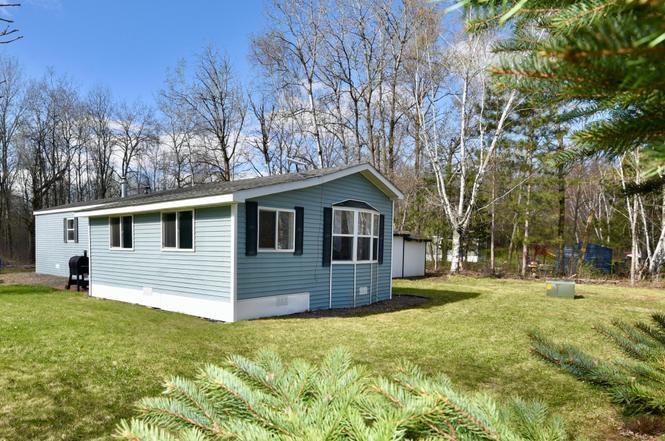
Don’t miss this opportunity to own an affordable, well-maintained 2-bedroom, 1-bath single-wide mobile home with a charming enclosed 8x19 three-season porch. Set on 4 private acres just off State Highway 23 on the west edge of Ogilvie, this property offers a peaceful, tucked-away setting surrounded by woods. Enjoy a beautiful open-water pond and a spacious, park-like yard featuring a fire ring, garden space, and plenty of room for outdoor entertaining—all with scenic pond views. The property has a warm, “up-north” feel that makes it especially inviting. The nearby town of Ogilvie provides convenient amenities, including local dining spots, a gas station/general stor
Key facts
- Private acres
- Fire ring
- Open-water pond
Tags
Property features AI
Exterior
- Parking: Gravel parking
- Utilities: Drilled private well; Private septic (mound system, compliant, tank with drainage field); Propane fuel; 100 amp electric service with circuit breakers; Electric service provided by East Central Energy
- Home design: Residential manufactured home; Single-story; Entry level: Main; Road frontage on paved streets / state road; public maintained road
- Construction: Pillar/post/pier foundation; Roof older than 8 years; Foundation dimensions approximately 14 x 56
- Exterior features: Vinyl exterior; Enclosed porch and open porch; Storage shed; Irregular lot with medium tree coverage; Shared pond waterfront (approximately 210 feet)
Interior
- Kitchen: Range; Refrigerator
- Bedrooms: Two bedrooms (both on main level)
- Bathrooms: One full bathroom (main floor)
- Heating & cooling: Forced air heating; No central cooling
- Interior features: All living facilities on one level; Main floor primary bedroom; Main floor bedroom; Main floor laundry; Enclosed porch / three-season porch; No interior stairs
- Laundry & utility: Washer hookup; Dryer hookup; Main level laundry
Neighborhood map
What this means for you Summary
Snapshot
- This is a 2-bed/1.0-bath manufactured listed at $170k.
Deal economics
- At list price, monthly cash flow is $-153 ($-2k/yr) — negative.
- To cash-flow at today's rent, offer at most $143k (15.9% below list).
- To meet the 1% rule (rent ≥ 1% of price), the offer needs to be $108k (36.7% below list).
- Recommended offer: $108k (36.7% below list) — sets the bar for 1% rule.
Location & tenants
- Location reads: area grade D — affects rentability + tenant quality, not the cash-flow math above.
- Ogilvie Public School District (rural): math 34% / reading 36% proficiency, ranked #252 of 301 in MN (top 84%) — families likely to look elsewhere, expect single-tenant / working-renter base with shorter leases.
- Zoned schools: Ogilvie Elementary (math 42% / reading 42%, grade F, #579 of 857 statewide, top 69%, 287 students, 53% FRL) — zoned schools average 53% FRL vs 37% district-wide (16 pts higher); higher-poverty schools than district average — tighter screening recommended.
- Market conditions: 16 active listings in the ZIP; 59 units permitted in Kanabec County in 2024 (0 in 5+ unit buildings).
Forward outlook
- In year one you build about $18k of equity ($1k loan paydown + $17k appreciation (10.0% local appreciation)).
- Kanabec County population projected at -25% by 2050 — secular population decline; favor cash flow + early exit over multi-decade hold.
- By year 3, paydown + projected appreciation supports a ~$46k cash-out refi (75% LTV) — recoverable capital for the next deal without selling this one.
Negotiation context
- It's been on market 45 days — a 3% lower offer ($165k) is reasonable based on typical stale-listing flexibility.
- Current owner paid $115k; 48% above their basis — modest negotiation headroom, anchor on the comps not their cost.
Risks & watch-outs
- Climate carrying-cost: major flood risk — expect insurance premiums to compound above CPI over the hold.
Questions for the listing agent
- What do current leases actually rent for vs. the listed asking? Can we see a recent rent roll and the last 12 months of T-12 income?
- It's been on market 45 days. Have you received any prior offers? Is the seller open to a 37% concession, seller financing, or rate buy-down credit?
- Is there a deadline driving the sale (1031 exchange, divorce, estate, relocation)? That informs how much negotiation room exists.
- The area grade is low — what's the realistic commute time and amenity access for the typical tenant pool here? Any planned neighborhood developments (good or bad) we should know about?
- This sits on a lake — are riparian / water-frontage rights deeded with the parcel? Any dock permits, shoreline easements, or HOA water-use restrictions?
- What's the documented flood / surge / shoreline-erosion history here (FEMA AND non-FEMA — e.g., storm surge, creek backup, septic-field saturation)?
- Any water-quality or seasonal algae-bloom issues that affect tenant satisfaction or short-term-rental demand?
- What's the average days-on-market for RENTAL listings here right now (not sales)? A rising rental-DOM trend means longer vacancies and softer asking-rent achievability than the comps imply.
- What's the recent tenant-quality profile in this submarket — average credit score on applications, eviction rate, late-payment / NSF rate, and stable-employment percentage? A property-management company in the area should have these aggregated.
- How much new for-sale + rental construction is in the pipeline within 1–3 miles? Heavy new supply typically softens prices + rents 12–24 months out; constrained supply supports both.
Investment metrics
- 1% rule
- 0.63% ✗
- Cap rate
- 5.21%
- Cash-on-cash
- -3.86%
- DSCR
- 0.83
- GRM
- 13.2
CMA / ARV
No comps found within radius.
Projected returns pro-forma
10.0% appreciation · 3.0% rent growth · sell at horizon
- IRR
- 21.5%
- Equity multiple
- 2.74×
- Total profit
- $82,708
- Equity at exit
- $153,059
- IRR
- 19.4%
- Equity multiple
- 6.28×
- Total profit
- $251,039
- Equity at exit
- $330,078
Cash invested: $47,572 (down + closing). Projections, not guarantees.
Landlord ↔ Tenant lean methodology
- Overall (STATE)
- 46 Balanced
- State Minnesota
- 46 Balanced · D+2
- County
- — inherits STATE
- City
- — inherits STATE
ZIP-level market 56358
- Home prices YoY
- 6.2%
- Active inventory
- 16
- Price-to-rent
- 13.2×
Monthly cashflow live
- Estimated rent
- $1,075 medium interval (Pro) →
- Mortgage (P&I)
- −$891
- Tax from tax record
- −$40 /mo · $486/yr
- Insurance
- −$71
- HOA
- −$0
- Vacancy / Maint / Mgmt
- −$226
- Net cashflow
- $-153
Break-even live
Sensitivity live
| Price | -10% $-57 | -5% $-105 | +0% $-153 | +5% $-201 | +10% $-249 |
|---|---|---|---|---|---|
| Rent | -10% $-238 | -5% $-195 | +0% $-153 | +5% $-110 | +10% $-68 |
| Rate | -1.0pp $-67 | -0.5pp $-110 | base $-153 | +0.5pp $-197 | +1.0pp $-242 |
UW: 25.0% down · 7.5% · 30yr · 1.5% tax · 5.0% vac · 8.0% maint · 8.0% mgmt
Financing live
Cash to close
- Down payment
- $42,475
- Closing costs
- $5,097
- Reserves months
- —
- Total cash needed
- —
Loan-product check · same deal, 3 products live
Conventional
25% down · 7.5% · 30yr
- Down + closing
- —
- Monthly P&I
- —
- Monthly cashflow
- —
- DSCR
- —
- Eligible?
- —
Personal DTI + credit; lowest rate.
DSCR
20% down · 8.5% · 30yr
- Down + closing
- —
- Monthly P&I
- —
- Monthly cashflow
- —
- DSCR
- —
- Eligible?
- —
No personal income docs; deal must DSCR.
Hard money
10% down · 12.0% · 12mo
- Down + closing
- —
- Monthly P&I
- —
- Monthly cashflow
- —
- DSCR
- —
- Eligible?
- —
Short-term bridge; refi at stabilization.
Listing history 17 events
-
2026-06-16status $169,900 Pending 45 DOM
-
2026-06-15days on market $169,900 Contingent - Inspection 45 DOM
-
2026-06-13days on market $169,900 Contingent - Inspection 43 DOM
-
2026-06-12days on market $169,900 Contingent - Inspection 42 DOM
-
2026-06-09days on market $169,900 Contingent - Inspection 39 DOM
-
2026-06-08days on market $169,900 Contingent - Inspection 38 DOM
-
2026-06-07days on market $169,900 Contingent - Inspection 37 DOM
-
2026-06-05days on market $169,900 Contingent - Inspection 35 DOM
-
2026-06-04days on market $169,900 Contingent - Inspection 33 DOM
-
2026-06-02days on market $169,900 Contingent - Inspection 32 DOM
-
2026-06-01days on market $169,900 Contingent - Inspection 31 DOM
-
2026-05-31days on market $169,900 Contingent - Inspection 30 DOM
-
2026-05-31days on market $169,900 Contingent - Inspection 29 DOM
-
2026-05-01$169,900 Active 1214-char remark
-
2022-08-26soldstatus $115,000
-
2021-03-29soldstatus $75,000
-
1997-10-28soldstatus $24,900
ⓘ Source: listings_history table (triggers on properties + properties_extension) + one-shot
backfill from property_details.listing_events for pre-trigger history.
Tax reassessment forecast MN · Partial reset (capped growth)
- Current annual tax
- $486 · $40/mo
- Projected year-2 tax
- $1,194 · $100/mo
- Expected delta
- +$708/yr (+$59/mo · 145.8%)
ⓘ Screening estimate from a state-policy table — verify with the county assessor before closing.
Climate risk First Street
- Flood 6/10 Major 68% chance over 30 yrs
- Wildfire 3/10 Moderate
- Heat 1/10 Low 7 d/yr ≥96°F today · 13 d/yr by 30 yrs out
- Wind 1/10 Low
- Air quality 2/10 Low 1 unhealthy d/yr today · 1 by 30 yrs out
Nearby sold comps map
Loading sold comps map…
Walkable amenities ~0.75 mi
Loading nearby amenities…
Taxation est. · year 1
- Rental income
- $12,903
- − Mortgage interest
- −$9,517
- − Property taxes
- −$486
- − Insurance
- −$850
- − Repairs & maintenance
- −$1,032
- − Management
- −$1,032
- − Depreciation
- −$4,943
- Taxable loss
- −$4,957
- Est. tax savings @ 24.0%
- +$1,190
- After-tax cash flow
- $-644/yr
For passive investors: Depreciation is non-cash, so a rental often shows a tax loss while cash-flowing — sheltering income. Rental losses are passive: they offset passive income freely, and up to $25,000/yr can offset ordinary (W-2) income if you actively participate and your MAGI is under $100k (phasing out to $0 by $150k); unused losses carry forward. On sale, claimed depreciation is recaptured at up to 25%, and gains may owe capital-gains tax (a 1031 exchange can defer both). Figures are a year-1 estimate at your 24.0% rate — not tax advice; consult a CPA.
Schools (NCES district)
- District
- Ogilvie Public School District
- NCES district ID
- 2723970
- Math proficiency
- 34% ▼ -18.00%
- Reading proficiency
- 36% ▼ -9.00%
- Median HH income
- $50,420
- Composite
- 30.39/100
- National rank
- #6251
- State rank
- #252 of 301 in MN
Livability — Kanabec
No livability data for this city. (Only ~50 U.S. cities are tracked.)
Census & demographics
- Population (ZIP)
- 3,172
Population outlook (Kanabec County) Hauer SSP2
- Today (2025)
- 14,998 people
- By 2030
- 14,363 · -4.2%
- By 2040
- 12,841 · -14.4%
- By 2050
- 11,299 · -24.7%
- By 2075
- 8,458 · -43.6%
- By 2100
- 6,283 · -58.1%
Race, ethnicity, and origin ACS 2023
- Neighborhood character
- Predominantly White (94%)
- Race & ethnicity
- White 94% Two or more races 4% Hispanic / Latino 2%
- Common ancestry
- Portuguese 11% Romanian 4% Iranian 4%
- Foreign-born
- 1% · Canada
Political lean MEDSL · Kanabec
- 2024 margin
- Solid R (+42.4) · D 28.1% · R 70.4% · Other 1.5%
- 2008→2024 swing
- -33.7pp toward R · 2008: -8.7pp · 2024: -42.4pp
- All cycles
- 2024: R+42.4 2020: R+37.9 2016: R+35.7 2012: R+9.0 2008: R+8.7
Not yet ingested
- Civics
- —
Market trends
- HPI YoY
- ▲ 17.57%
- Current HPI
- 302.8175
- Rent YoY
- —
- Metro
- —
- State GDP YoY
- ▲ 2.41%
- F500 in state
- 34
Industry mix (Fortune 500 HQ in MN)
| Industry | F500 HQs | Revenue |
|---|---|---|
| Healthcare | 2 | $407B |
|
||
| Retail | 2 | $150B |
|
||
| Consumer Goods | 2 | $32B |
|
||
| Industrial Machinery | 2 | $6B |
|
||
| Agriculture | 1 | $40B |
|
||
| Healthcare / Medical Devices | 1 | $32B |
|
||
Price history
+582.3% since first listed6 events — show timeline
- 2026-06-15 Pending — NORTHSTARMLS as Distributed by MLS Grid
- 2026-05-19 Contingent — NORTHSTARMLS as Distributed by MLS Grid
- 2026-05-01 Listed $169,900 NORTHSTARMLS as Distributed by MLS Grid
- 2022-08-26 Sold (Public Records) $115,000 Public Records
- 2021-03-29 Sold (Public Records) $75,000 Public Records
- 1997-10-28 Sold (Public Records) $24,900 Public Records
Property tax history
+0.2%/yrLatest (2025): $486 · +4.3% YoY. Source: county tax records.
Cash-flow waterfall
monthlySold comps — $/sqft
last 12 mo · ≤1 miLoading sold comps…