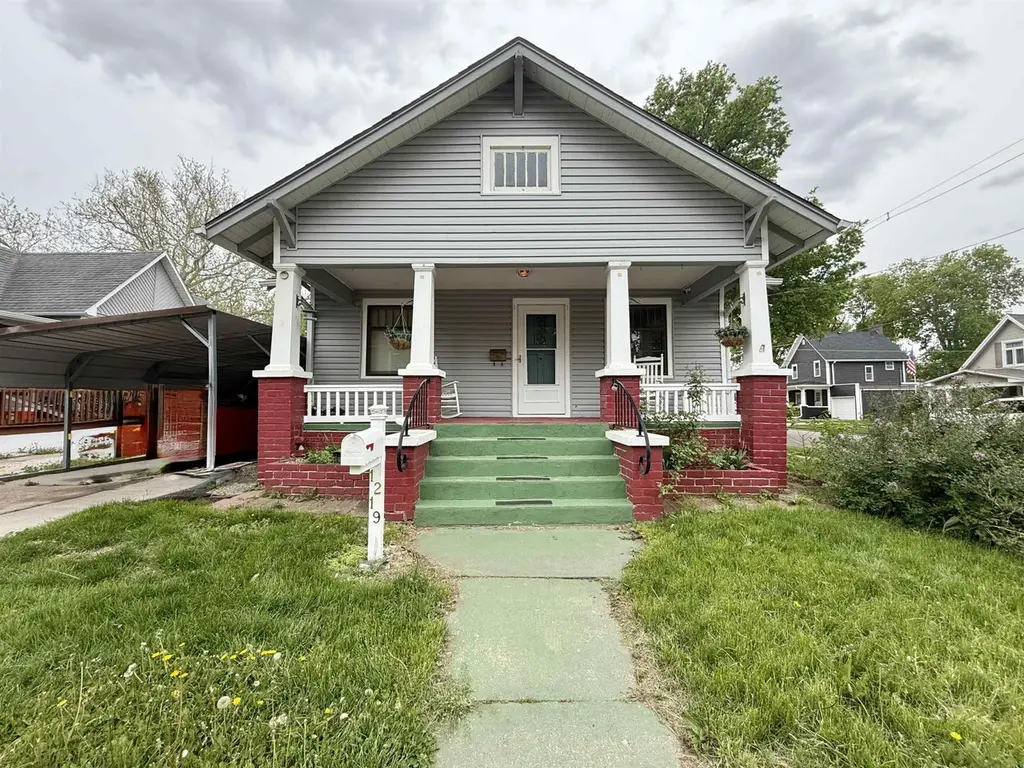
1219 W 7th St · Hastings, NE
Flood risk 1/10 · Minimal
- FEMA flood zone
- X (unshaded)
- Chance of flooding over 30 yrs
- 0.0%
- Est. flood insurance / yr
- $473 – $860
Fire risk 1/10 · Minimal
- Est. fire insurance / yr
- $1,161 – $2,155
Heat risk 3/10 · Minor
- Hot days now (above 101°F)
- 7 days/yr
- Hot days in 30 yrs
- 17 days/yr
Wind risk 2/10 · Minimal
- Chance of severe wind over 30 yrs
- —
Air-quality risk 1/10 · Minimal
- Unhealthy air days now
- 0 days/yr
- Unhealthy air days in 30 yrs
- 0 days/yr
Risk factors via First Street. Map © Google.
Why this score? — see what drove the C- grade
The composite is a weighted blend of 9 inputs, each scored 0–100. Each bar is that input's sub-score; the figure is the points it added to the 100-point composite (weight × sub-score).
- Cash flow +16.9/30.0
- ARV discount +13.4/15.0
- DSCR +5.2/10.0
- 1% rule +4.2/10.0
- Livability +4.0/5.0
- Schools +3.4/10.0
- Rent growth +2.5/5.0
- Condition / age +2.5/5.0
- Appreciation +0.0/10.0
$168,000
🖨 Deal sheet 📄 Offer letter ✓ Due diligence
Listing remarks
Welcome Home! Check out this open concept, 3 bedroom, 1 bathroom home which features beautiful hardwood floors, main floor and basement laundry, formal dining area, and a walk-in shower. Downstairs, there is a partially plumbed area for a bathroom. The unfinished basement is a blank canvas for you to make it your own. The home is situated on a fenced-in corner lot and offers a detached garage, carport, and a covered front porch. The home is being Sold-As-Is. Call for a showing today!
Key facts
- 3,049 sq ft lot
- Garage
- Built 1920
Property features AI
Exterior
- Parking: Detached 1-car garage
- Utilities: Public water; Public sewer; Natural gas available
- Home design: Single-family residential; Frame construction
- Construction: Frame construction
- Exterior features: Patio; Wood fencing
Interior
- Kitchen: Dishwasher; Cooktop; Oven; Refrigerator
- Bathrooms: One main-level bathroom
- Heating & cooling: Forced air heating; Central air conditioning
- Interior features: Living room fireplace (1); Water softener; Gas water heater
- Laundry & utility: Laundry on main level; Laundry in basement
Neighborhood map
What this means for you Summary
Snapshot
- This is a 3-bed/1.0-bath single-family listed at $168k.
Deal economics
- At list price, monthly cash flow is $109 ($1k/yr) — positive.
- The deal already cash-flows at list — no discount required.
- To meet the 1% rule (rent ≥ 1% of price), the offer needs to be $155k (8.0% below list).
- Recommended offer: $155k (8.0% below list) — sets the bar for 1% rule.
- Cap rate 7.1% vs local median 4.4% in Hastings — top-decile yield for the area; either an underpriced asset or a hidden risk that comps aren't pricing in. Stress-test before assuming the spread holds.
Location & tenants
- Location reads 79/100 on livability (#41 in NE, #2,188 nationally) — a middle-class / working-renter tenant base. Strengths: cost of living A+, housing A+, health & safety A+; Watch: crime C-, amenities D-, commute F.
- Hastings Public Schools (town): math 38% / reading 42% proficiency, ranked #96 of 111 in NE (top 86%) — families likely to look elsewhere, expect single-tenant / working-renter base with shorter leases.
- Market conditions: 191 active listings in the ZIP; 217 units permitted in Adams County in 2024 (132 in 5+ unit buildings).
Forward outlook
- Local home prices are declining (-3.0%/yr); year-one equity from $1k of loan paydown is wiped out by about $5k of value loss. Plan a longer hold.
Negotiation context
- Only 7 days on market — expect competitive offers; lowballing is unlikely to land.
- 2 sale attempts with the ask held roughly flat each time — persistent listings suggest the price (not the market) is what's stuck; bring a comps-based counter.
- Current owner paid $132k; 27% above their basis — modest negotiation headroom, anchor on the comps not their cost.
Risks & watch-outs
- Watch-outs: built in 1920 — expect roof / HVAC / electrical / plumbing capex.
Questions for the listing agent
- Built in 1920 — when were the roof, HVAC, electrical panel, plumbing, and water heater last replaced?
- Is there a deadline driving the sale (1031 exchange, divorce, estate, relocation)? That informs how much negotiation room exists.
- What's the average days-on-market for RENTAL listings here right now (not sales)? A rising rental-DOM trend means longer vacancies and softer asking-rent achievability than the comps imply.
- What's the recent tenant-quality profile in this submarket — average credit score on applications, eviction rate, late-payment / NSF rate, and stable-employment percentage? A property-management company in the area should have these aggregated.
- How much new for-sale + rental construction is in the pipeline within 1–3 miles? Heavy new supply typically softens prices + rents 12–24 months out; constrained supply supports both.
Investment metrics
- 1% rule
- 0.92% ✗
- Cap rate
- 7.07%
- Cash-on-cash
- 2.79%
- DSCR
- 1.12
- GRM
- 9.1
CMA / ARV
- ARV (median comp)
- $193,117
- List price
- $168,000
- Delta
- -13.01%
- Verdict
- UNDERPRICED
- Comps
- 20 within 1.0 mi
Show comp detail 5 sales within ~0.75 mi
| Address | Dist | Beds/Ba | Sqft | Sold | Price | $/sf | Match |
|---|---|---|---|---|---|---|---|
| 1742 W 5th St | 0.44mi | 2/1.0 (-1) | 1,170 (+4%) | 9mo | $140,000 | $120 | 60 |
| 1139 W 5th St | 0.14mi | 2/1.0 (-1) | 1,247 (+11%) | 13mo | $120,000 | $96 | 59 |
| 1608 W 4th St | 0.33mi | 2/1.0 (-1) | 1,152 (+3%) | 19mo | $120,000 | $104 | 59 |
| 1244 N Webster Ave | 0.63mi | 2/1.0 (-1) | 1,066 (-5%) | 4mo | $100,000 | $94 | 54 |
| 1910 W 5th St | 0.58mi | 2/1.0 (-1) | 1,218 (+9%) | 24mo | $88,000 | $72 | 34 |
Match score weights: distance 35% · size 25% · config 20% · recency 20%. Top-matched comps best support the ARV.
Projected returns pro-forma
-3.0% appreciation · 3.0% rent growth · sell at horizon
- IRR
- -11.9%
- Equity multiple
- 0.57×
- Total profit
- $-20,262
- Equity at exit
- $25,049
- IRR
- -2.7%
- Equity multiple
- 0.82×
- Total profit
- $-8,700
- Equity at exit
- $14,526
Cash invested: $47,040 (down + closing). Projections, not guarantees.
Landlord ↔ Tenant lean methodology
- Overall (STATE)
- 83 Strongly Landlord-Friendly
- State Nebraska
- 83 Strongly Landlord-Friendly · R+13
- County
- — inherits STATE
- City
- — inherits STATE
ZIP-level market 68901
- Active inventory
- 191
- Price-to-rent
- 9.1×
Monthly cashflow live
- Estimated rent
- $1,545 medium interval (Pro) →
- Mortgage (P&I)
- −$881
- Tax from tax record
- −$160 /mo · $1,924/yr
- Insurance
- −$70
- HOA
- −$0
- Vacancy / Maint / Mgmt
- −$324
- Net cashflow
- $109
Break-even live
UW: 25.0% down · 7.5% · 30yr · 1.5% tax · 5.0% vac · 8.0% maint · 8.0% mgmt
Financing live
Cash to close
- Down payment
- $42,000
- Closing costs
- $5,040
- Reserves months
- —
- Total cash needed
- —
Loan-product check · same deal, 3 products live
Conventional
25% down · 7.5% · 30yr
- Down + closing
- —
- Monthly P&I
- —
- Monthly cashflow
- —
- DSCR
- —
- Eligible?
- —
Personal DTI + credit; lowest rate.
DSCR
20% down · 8.5% · 30yr
- Down + closing
- —
- Monthly P&I
- —
- Monthly cashflow
- —
- DSCR
- —
- Eligible?
- —
No personal income docs; deal must DSCR.
Hard money
10% down · 12.0% · 12mo
- Down + closing
- —
- Monthly P&I
- —
- Monthly cashflow
- —
- DSCR
- —
- Eligible?
- —
Short-term bridge; refi at stabilization.
Listing history 8 events
-
2026-05-13status Pending 494-char remark
-
2026-05-05$168,000 Active 494-char remark
-
2025-06-05price $175,000
-
2025-06-05price $175,000
-
2025-05-14price $190,000
-
2025-05-14price $190,000
-
2025-04-16$220,000 Active
-
2022-02-18soldstatus $132,000
ⓘ Source: listings_history table (triggers on properties + properties_extension) + one-shot
backfill from property_details.listing_events for pre-trigger history.
Tax reassessment forecast NE · Resets to sale price
- Current annual tax
- $1,924 · $160/mo
- Projected year-2 tax
- $2,906 · $242/mo
- Expected delta
- +$983/yr (+$82/mo · 51.1%)
ⓘ Screening estimate from a state-policy table — verify with the county assessor before closing.
Climate risk First Street
- Flood 1/10 Low FEMA zone X (unshaded) · 0% chance over 30 yrs
- Wildfire 1/10 Low
- Heat 3/10 Moderate 7 d/yr ≥101°F today · 17 d/yr by 30 yrs out
- Wind 2/10 Low
- Air quality 1/10 Low 0 unhealthy d/yr today · 0 by 30 yrs out
Nearby sold comps map
Loading sold comps map…
Walkable amenities ~0.75 mi
Loading nearby amenities…
Taxation est. · year 1
- Rental income
- $18,543
- − Mortgage interest
- −$9,411
- − Property taxes
- −$1,924
- − Insurance
- −$840
- − Repairs & maintenance
- −$1,483
- − Management
- −$1,483
- − Depreciation
- −$4,887
- Taxable loss
- −$1,486
- Est. tax savings @ 24.0%
- +$357
- After-tax cash flow
- $1,670/yr
For passive investors: Depreciation is non-cash, so a rental often shows a tax loss while cash-flowing — sheltering income. Rental losses are passive: they offset passive income freely, and up to $25,000/yr can offset ordinary (W-2) income if you actively participate and your MAGI is under $100k (phasing out to $0 by $150k); unused losses carry forward. On sale, claimed depreciation is recaptured at up to 25%, and gains may owe capital-gains tax (a 1031 exchange can defer both). Figures are a year-1 estimate at your 24.0% rate — not tax advice; consult a CPA.
Schools (NCES district)
- District
- Hastings Public Schools
- NCES district ID
- 3171580
- Math proficiency
- 38% ▼ -8.00%
- Reading proficiency
- 42% ▼ -4.00%
- Median HH income
- $42,942
- Composite
- 33.81/100
- National rank
- #5363
- State rank
- #96 of 111 in NE
Livability — Hastings
- Score
- 79/100
- State rank
- #41
- US rank
- #2188
Category grades
Schools grade is shown separately in the Schools card above.
Census & demographics
- Census place
- Hastings, NE
- City population
- 26,208
- Population (ZIP)
- 26,208
Population outlook (Adams County) Hauer SSP2
- Today (2025)
- 31,965 people
- By 2030
- 32,079 · +0.4%
- By 2040
- 31,999 · +0.1%
- By 2050
- 31,586 · -1.2%
- By 2075
- 30,856 · -3.5%
- By 2100
- 29,948 · -6.3%
Race, ethnicity, and origin ACS 2023
- Neighborhood character
- Predominantly White (81%)
- Race & ethnicity
- White 81% Hispanic / Latino 14% Two or more races 8% Black 1% Asian 1%
- Hispanic origin (detail)
- Mexican 9% Cuban 1%
- Common ancestry
- Lithuanian 2% Romanian 2% Italian 2%
- Foreign-born
- 7% · Canada, Vietnam
- Languages at home
- 89% English-only · Spanish 9% Vietnamese 1%
Political lean MEDSL · Adams
- 2024 margin
- Solid R (+41.6) · D 28.5% · R 70.2% · Other 1.3%
- 2008→2024 swing
- -14.6pp toward R · 2008: -27.0pp · 2024: -41.6pp
- All cycles
- 2024: R+41.6 2020: R+40.1 2016: R+45.0 2012: R+34.1 2008: R+27.0
Not yet ingested
- Civics
- —
Market trends
- HPI YoY
- ▼ -255.77%
- Current HPI
- 232.0444
- Rent YoY
- —
- Metro
- —
- State GDP YoY
- ▲ 0.68%
- F500 in state
- 2
Industry mix (Fortune 500 HQ in NE)
| Industry | F500 HQs | Revenue |
|---|---|---|
| Conglomerate | 1 | $371B |
|
||
Price history
+27.3% since first listed8 events — show timeline
- 2026-05-13 Pending — GMNMLS
- 2026-05-05 Listed $168,000 GMNMLS
- 2025-06-05 Price Changed $175,000 GMNMLS
- 2025-06-05 Price Changed $175,000 GIBOR
- 2025-05-14 Price Changed $190,000 GMNMLS
- 2025-05-14 Price Changed $190,000 GIBOR
- 2025-04-16 Listed $220,000 GMNMLS
- 2022-02-18 Sold (Public Records) $132,000 Public Records
Property tax history
+2.0%/yrLatest (2025): $1,924 · +11.6% YoY. Source: county tax records.
Cash-flow waterfall
monthlySold comps — $/sqft
last 12 mo · ≤1 miLoading sold comps…