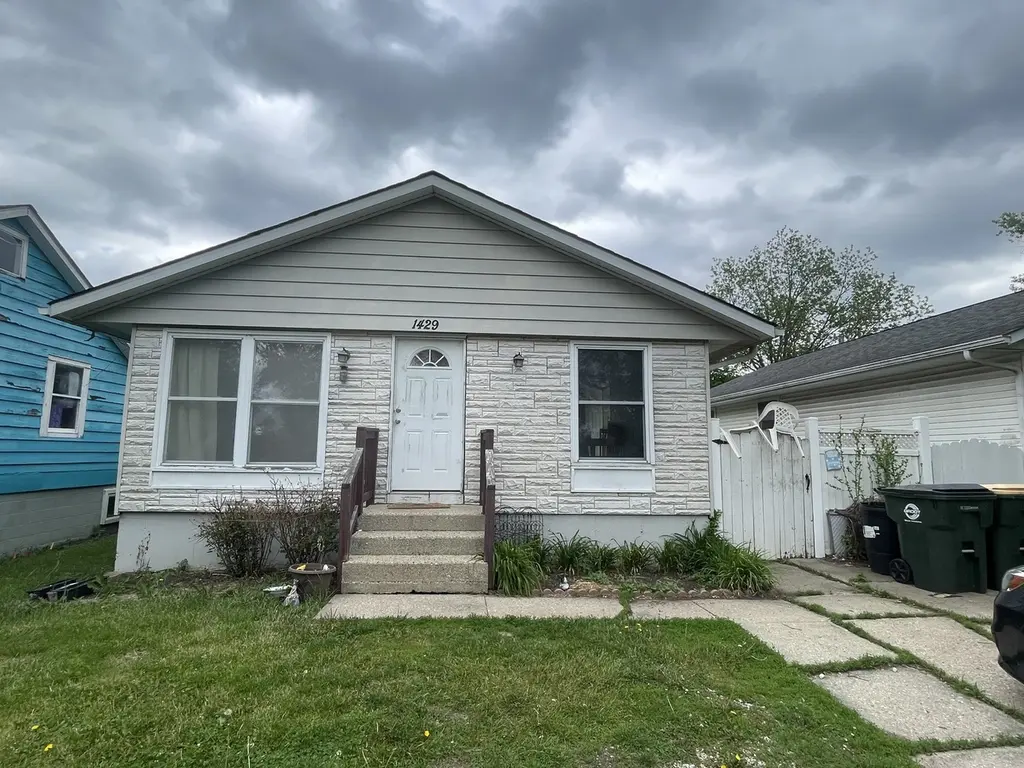
1429 N Pleasant Dr · Round Lake Beach, IL
Flood risk 1/10 · Minimal
- FEMA flood zone
- X (unshaded)
- Chance of flooding over 30 yrs
- 0.0%
- Est. flood insurance / yr
- $473 – $860
Fire risk 2/10 · Minimal
- Est. fire insurance / yr
- $804 – $1,492
Heat risk 2/10 · Minimal
- Hot days now (above 100°F)
- 7 days/yr
- Hot days in 30 yrs
- 14 days/yr
Wind risk 2/10 · Minimal
- Chance of severe wind over 30 yrs
- —
Air-quality risk 3/10 · Minor
- Unhealthy air days now
- 2 days/yr
- Unhealthy air days in 30 yrs
- 3 days/yr
Risk factors via First Street. Map © Google.
Why this score? — see what drove the B- grade
The composite is a weighted blend of 9 inputs, each scored 0–100. Each bar is that input's sub-score; the figure is the points it added to the 100-point composite (weight × sub-score).
- Cash flow +26.7/30.0
- ARV discount +15.0/15.0
- DSCR +9.1/10.0
- 1% rule +7.7/10.0
- Livability +4.0/5.0
- Rent growth +3.2/5.0
- Condition / age +2.5/5.0
- Schools +1.0/10.0
- Appreciation +0.0/10.0
$229,000
🖨 Deal sheet 📄 Offer letter ✓ Due diligence
Listing remarks MLS
This 4 bedroom 1 bath home has a full basement. Move in condition, ready for a quick sale. Great investment history for you investors. Home being sold as is,
Key facts
- 5,200 sq ft lot
- 6 parking spots
- Built 1972
Neighborhood map
What this means for you Summary
Snapshot
- This is a 4-bed/1.0-bath single-family listed at $229k.
Deal economics
- At list price, monthly cash flow is $618 ($7k/yr) — positive.
- The deal already cash-flows at list — no discount required.
- Meets the 1% rule at list price ($3k rent vs $229k).
- Cap rate 9.5% vs local median 5.8% in Round Lake Beach — top-decile yield for the area; either an underpriced asset or a hidden risk that comps aren't pricing in. Stress-test before assuming the spread holds.
Location & tenants
- Location reads 79/100 on livability (#125 in IL, #2,172 nationally) — a middle-class / working-renter tenant base. Strengths: crime A+, cost of living A+, housing A+; Watch: schools F, commute F.
- Round Lake CUSD 116 (suburban): math 7% / reading 14% proficiency, ranked #560 of 620 in IL (top 90%) — low school quality limits family demand, transient renter base, plan for 1-2y turnover; 67% free/reduced lunch — lower-income household profile, screen leases tightly.
- Market conditions: Rents rising (+2.9%/yr); 97 active listings in the ZIP; 6 comparable units currently listed for rent nearby; rentals leasing fast (median 1d on market — plan ~1-2 weeks tenant-placement turnaround); solid renter incomes; 948 units permitted in Lake County in 2024 (424 in 5+ unit buildings).
- This rent runs 35% of the median local income ($99k/yr) — at the standard rent-burdened threshold; future hikes will face affordability resistance.
Forward outlook
- Local home prices are declining (-3.0%/yr); year-one equity from $2k of loan paydown is wiped out by about $7k of value loss. Plan a longer hold.
- Lake County population projected to shrink 8% by 2050 — rents likely to lag national; underwrite the cash flow, not the appreciation.
- At projected returns (-3.0% appreciation + 2.9% rent growth), your $64k cash investment doubles in ~10 years — after that, you're playing with house money.
Negotiation context
- Only 5 days on market — expect competitive offers; lowballing is unlikely to land.
- 8 sale attempts since 20y ago; this cycle's ask is 12% above the opening price — seller raised mid-cycle; expect resistance to lowballs.
- Current owner paid $85k; list at $229k implies a 169% gain — meaningful room to come down on a strong offer.
Questions for the listing agent
- Built in 1972 — when were the roof, HVAC, electrical panel, plumbing, and water heater last replaced?
- Is there a deadline driving the sale (1031 exchange, divorce, estate, relocation)? That informs how much negotiation room exists.
- Schools are F-rated, which usually means shorter tenancies and higher turnover. Who's the typical renter profile here, and what's been the actual vacancy rate?
- What's the average days-on-market for RENTAL listings here right now (not sales)? A rising rental-DOM trend means longer vacancies and softer asking-rent achievability than the comps imply.
- What's the recent tenant-quality profile in this submarket — average credit score on applications, eviction rate, late-payment / NSF rate, and stable-employment percentage? A property-management company in the area should have these aggregated.
- How much new for-sale + rental construction is in the pipeline within 1–3 miles? Heavy new supply typically softens prices + rents 12–24 months out; constrained supply supports both.
Investment metrics
- 1% rule
- 1.27% ✓
- Cap rate
- 9.53%
- Cash-on-cash
- 11.57%
- DSCR
- 1.51
- GRM
- 6.6
CMA / ARV
- ARV (on-the-fly)
- $297,475
- Comps found
- 12
Show comp detail 12 sales within ~0.75 mi
| Address | Dist | Beds/Ba | Sqft | Sold | Price | $/sf | Match |
|---|---|---|---|---|---|---|---|
| 1321 N Cedar Lake Rd | 0.18mi | 3/1.0 (-1) | 1,920 (+5%) | 2mo | $248,000 | $129 | 76 |
| 1336 Ardmore Dr | 0.29mi | 3/2.0 (-1) | 1,800 (-1%) | 11mo | $255,000 | $142 | 66 |
| 1410 Juneway Ter | 0.16mi | 4/2.5 | 1,628 (-11%) | 8mo | $295,000 | $181 | 62 |
| 808 Central Park Dr | 0.75mi | 4/2.0 | 1,850 (+1%) | 2mo | $295,000 | $159 | 57 |
| 128 S Channel Dr | 0.49mi | 4/2.0 | 1,600 (-12%) | 2mo | $325,000 | $203 | 52 |
| 1320 Glenview Ct | 0.40mi | 3/2.0 (-1) | 1,650 (-10%) | 6mo | $290,000 | $176 | 51 |
| 121 E Clarendon Dr | 0.61mi | 4/2.0 | 1,988 (+9%) | 2mo | $285,000 | $143 | 51 |
| 1228 N Lake Shore Dr | 0.36mi | 3/2.0 (-1) | 1,632 (-11%) | 10mo | $290,000 | $178 | 48 |
| 215 Glenwood Dr | 0.68mi | 3/1.0 (-1) | 1,936 (+6%) | 10mo | $248,000 | $128 | 45 |
| 1417 Melrose Ave | 0.62mi | 4/2.0 | 2,023 (+11%) | 6mo | $320,500 | $158 | 44 |
| 1326 N Poplar Ave | 0.72mi | 3/2.0 (-1) | 1,682 (-8%) | 10mo | $275,000 | $163 | 36 |
| 68 E Lakeview Ave | 0.64mi | 3/2.5 (-1) | 1,588 (-13%) | 4mo | $321,000 | $202 | 34 |
Match score weights: distance 35% · size 25% · config 20% · recency 20%. Top-matched comps best support the ARV.
Projected returns pro-forma
-3.0% appreciation · 2.87% rent growth · sell at horizon
- IRR
- 0.8%
- Equity multiple
- 1.03×
- Total profit
- $2,001
- Equity at exit
- $34,145
- IRR
- 10.4%
- Equity multiple
- 1.80×
- Total profit
- $51,312
- Equity at exit
- $19,800
Cash invested: $64,120 (down + closing). Projections, not guarantees.
Landlord ↔ Tenant lean methodology
- Overall (STATE)
- 43 Moderately Tenant-Leaning
- State Illinois
- 43 Moderately Tenant-Leaning · D+7
- County
- — inherits STATE
- City
- — inherits STATE
ZIP-level market 60073
- Rents YoY
- 2.9%
- Active inventory
- 97
- Price-to-rent
- 6.6×
Monthly cashflow live
- Estimated rent
- $2,898 high interval (Pro) →
- Mortgage (P&I)
- −$1,201
- Tax from tax record
- −$375 /mo · $4,496/yr
- Insurance
- −$95
- HOA
- −$0
- Vacancy / Maint / Mgmt
- −$609
- Net cashflow
- $618
Break-even live
UW: 25.0% down · 7.5% · 30yr · 1.5% tax · 5.0% vac · 8.0% maint · 8.0% mgmt
Financing live
Cash to close
- Down payment
- $57,250
- Closing costs
- $6,870
- Reserves months
- —
- Total cash needed
- —
Loan-product check · same deal, 3 products live
Conventional
25% down · 7.5% · 30yr
- Down + closing
- —
- Monthly P&I
- —
- Monthly cashflow
- —
- DSCR
- —
- Eligible?
- —
Personal DTI + credit; lowest rate.
DSCR
20% down · 8.5% · 30yr
- Down + closing
- —
- Monthly P&I
- —
- Monthly cashflow
- —
- DSCR
- —
- Eligible?
- —
No personal income docs; deal must DSCR.
Hard money
10% down · 12.0% · 12mo
- Down + closing
- —
- Monthly P&I
- —
- Monthly cashflow
- —
- DSCR
- —
- Eligible?
- —
Short-term bridge; refi at stabilization.
Rent comps 6 comps
| Address | Beds | Baths | Sqft | Rent | $/sqft | DOM | Units | Dist |
|---|---|---|---|---|---|---|---|---|
| 1521 N Lake Shore Dr Round Lake Beach, IL | 3.0 | 2.0 | 1800 | $2,999 | $1.67 | 1d | 1 | 0.28mi |
| 1207 Sunset Dr Round Lake Beach, IL | 3.0 | 1.0 | 2000 | $2,150 | $1.07 | 12d | 1 | 0.44mi |
| 460 Meadow Hill Ln Round Lake Beach, IL | 3.0 | 1.5 | 1276 | $2,300 | $1.80 | 1d | 1 | 0.64mi |
| 67 W Rustic Ln Round Lake Beach, IL | 3.0 | 2.5 | 1504 | $2,600 | $1.73 | 1d | 1 | 0.94mi |
| 915 Mayfield Dr Round Lake Beach, IL | 4.0 | 2.0 | 1850 | $2,700 | $1.46 | 1d | 1 | 0.96mi |
| 510 E Clarendon Dr Round Lake Beach, IL | 4.0 | 1.5 | 1229 | $2,341 | $1.90 | 20d | 1 | 1.12mi |
Listing history 12 events
-
2026-06-18days on market $229,000 Active 5 DOM
-
2026-06-17days on market $229,000 Active 4 DOM
-
2026-06-16days on market $229,000 Active 3 DOM
-
2026-06-15pricestatusdays on market $229,000 Active 2 DOM
-
2026-06-13days on market $205,000 Temporarily No Showings 8 DOM
-
2026-06-09days on market $205,000 Temporarily No Showings 5 DOM
-
2026-06-08days on market $205,000 Temporarily No Showings 4 DOM
-
2026-06-07statusdays on market $205,000 Temporarily No Showings 3 DOM
-
2026-06-04status $205,000 Pending 2 DOM
-
2026-06-03days on market $205,000 Active 2 DOM
-
2026-06-02remarks 55-char remark
-
2026-06-02$205,000 Active 1 DOM
ⓘ Source: listings_history table (triggers on properties + properties_extension) + one-shot
backfill from property_details.listing_events for pre-trigger history.
Tax reassessment forecast IL · Partial reset (capped growth)
- Current annual tax
- $4,496 · $375/mo
- Projected year-2 tax
- $4,847 · $404/mo
- Expected delta
- +$351/yr (+$29/mo · 7.8%)
ⓘ Screening estimate from a state-policy table — verify with the county assessor before closing.
Climate risk First Street
- Flood 1/10 Low FEMA zone X (unshaded) · 0% chance over 30 yrs
- Wildfire 2/10 Low
- Heat 2/10 Low 7 d/yr ≥100°F today · 14 d/yr by 30 yrs out
- Wind 2/10 Low
- Air quality 3/10 Moderate 2 unhealthy d/yr today · 3 by 30 yrs out
Nearby sold comps map
Loading sold comps map…
Walkable amenities ~0.75 mi
Loading nearby amenities…
Taxation est. · year 1
- Rental income
- $34,776
- − Mortgage interest
- −$12,828
- − Property taxes
- −$4,496
- − Insurance
- −$1,145
- − Repairs & maintenance
- −$2,782
- − Management
- −$2,782
- − Depreciation
- −$6,662
- Taxable income
- $4,082
- Est. tax owed @ 24.0%
- −$980
- After-tax cash flow
- $6,442/yr
For passive investors: Depreciation is non-cash, so a rental often shows a tax loss while cash-flowing — sheltering income. Rental losses are passive: they offset passive income freely, and up to $25,000/yr can offset ordinary (W-2) income if you actively participate and your MAGI is under $100k (phasing out to $0 by $150k); unused losses carry forward. On sale, claimed depreciation is recaptured at up to 25%, and gains may owe capital-gains tax (a 1031 exchange can defer both). Figures are a year-1 estimate at your 24.0% rate — not tax advice; consult a CPA.
Schools (NCES district)
- District
- Round Lake CUSD 116
- NCES district ID
- 1734990
- Math proficiency
- 7% ▼ -6.00%
- Reading proficiency
- 14% ▼ -2.00%
- Median HH income
- $53,477
- Composite
- 10.35/100
- National rank
- #9789
- State rank
- #560 of 620 in IL
Livability — Round Lake Beach
- Score
- 79/100
- State rank
- #125
- US rank
- #2172
Category grades
Schools grade is shown separately in the Schools card above.
Census & demographics
- Census place
- Round Lake Beach, IL
- County
- Lake County · 591,991 people
- Metro
- Chicago-Naperville-Elgin, IL-IN-WI
- Population (ZIP)
- 62,868
- Household income
- $98,514
- Rent vs Own
- Severe rent burden
- 1225.0
Population outlook (Lake County) Hauer SSP2
- Today (2025)
- 700,217 people
- By 2030
- 693,290 · -1.0%
- By 2040
- 673,588 · -3.8%
- By 2050
- 643,556 · -8.1%
- By 2075
- 562,792 · -19.6%
- By 2100
- 457,715 · -34.6%
Race, ethnicity, and origin ACS 2023
- Neighborhood character
- Diverse neighborhood (Simpson 0.63)
- Race & ethnicity
- Hispanic / Latino 45% White 40% Two or more races 20% Asian 7% Black 4% Native American 2%
- Hispanic origin (detail)
- Mexican 37% Puerto Rican 3%
- Common ancestry
- Romanian 8% Portuguese 1% Lithuanian 1%
- Foreign-born
- 25% · Canada, South Korea, Vietnam
- Languages at home
- 56% English-only · Spanish 35% Russian/Polish/Slavic 2% Other Indo-European 2%
Political lean MEDSL · Lake
- 2024 margin
- Strong D (+20.8) · D 59.7% · R 38.9% · Other 1.4%
- 2008→2024 swing
- +1.1pp toward D · 2008: 19.6pp · 2024: 20.8pp
- All cycles
- 2024: D+20.8 2020: D+24.1 2016: D+20.3 2012: D+8.1 2008: D+19.6
Not yet ingested
- Civics
- —
Market trends
- HPI YoY
- ▼ -140.95%
- Current HPI
- 229.1762
- Rent YoY
- ▲ 2.87%
- Metro
- Chicago-Naperville-Elgin, IL-IN-WI
- State GDP YoY
- ▲ 1.59%
- F500 in state
- 60
Industry mix (Fortune 500 HQ in IL)
| Industry | F500 HQs | Revenue |
|---|---|---|
| Insurance | 4 | $201B |
|
||
| Consumer Goods | 4 | $87B |
|
||
| Industrial Machinery | 3 | $64B |
|
||
| Healthcare | 2 | $55B |
|
||
| Retail / Pharmacy | 1 | $148B |
|
||
| Agriculture / Food | 1 | $86B |
|
||
Price history
+310.8% since first listed22 events — show timeline
- 2026-05-31 Listed $205,000 MRED as Distributed by MLS Grid
- 2015-11-09 Sold (Public Records) $85,000 Public Records
- 2015-10-30 Sold (MLS) $85,000 MRED as Distributed by MLS Grid
- 2015-08-20 Contingent — MRED as Distributed by MLS Grid
- 2015-08-18 Relisted — MRED as Distributed by MLS Grid
- 2015-08-10 Contingent — MRED as Distributed by MLS Grid
- 2015-07-15 Listed $92,000 MRED as Distributed by MLS Grid
- 2015-07-12 Listing Removed — MRED as Distributed by MLS Grid
- 2015-04-07 Relisted — MRED as Distributed by MLS Grid
- 2015-04-02 Pending — MRED as Distributed by MLS Grid
- 2015-01-12 Listed — MRED as Distributed by MLS Grid
- 2008-08-18 Listing Removed — MRED as Distributed by MLS Grid
- 2008-08-18 Sold (MLS) $88,250 MRED as Distributed by MLS Grid
- 2008-06-17 Contingent — MRED as Distributed by MLS Grid
- 2008-05-28 Sold (Public Records) $88,250 Public Records
- 2007-08-31 Listed $130,000 MRED as Distributed by MLS Grid
- 2007-04-30 Sold (Public Records) $159,000 Public Records
- 2007-03-23 Listing Removed — MRED as Distributed by MLS Grid
- 2007-03-05 Listed — MRED as Distributed by MLS Grid
- 2007-03-04 Listing Removed — MRED as Distributed by MLS Grid
- 2006-12-04 Listed — MRED as Distributed by MLS Grid
- 1986-06-01 Sold (Public Records) $49,900 Public Records
Property tax history
+2.1%/yrLatest (2024): $4,496 · +16.0% YoY. Source: county tax records.
Cash-flow waterfall
monthlySold comps — $/sqft
last 12 mo · ≤1 miLoading sold comps…