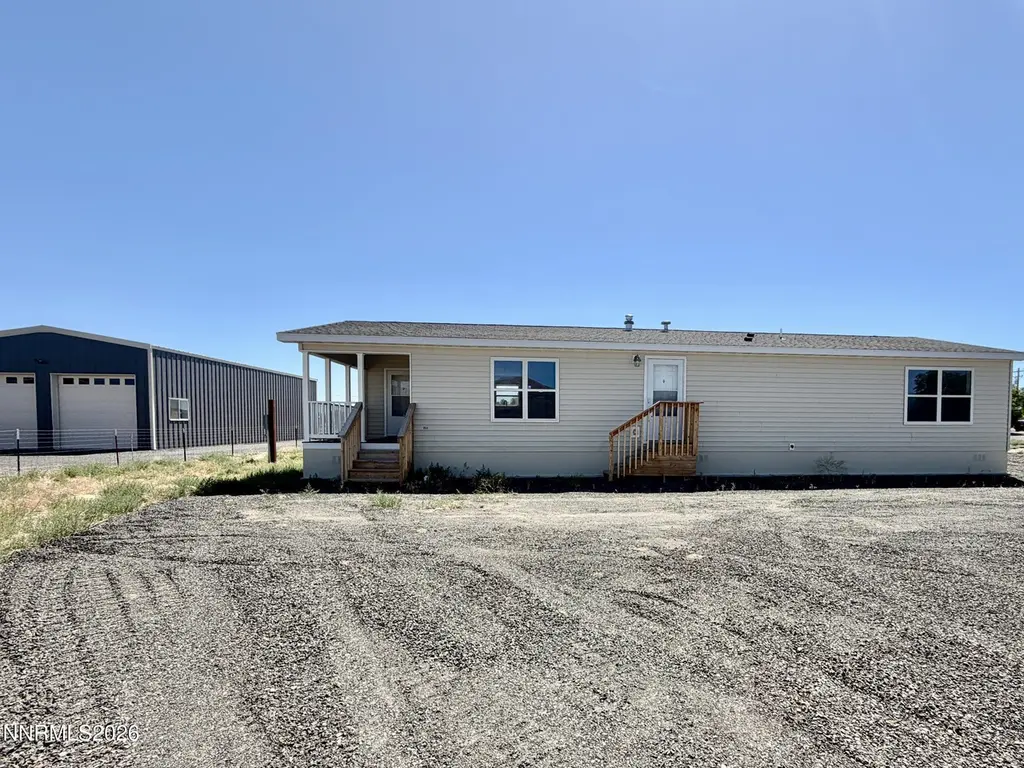
7730 Remington Rd · Silver Springs, NV
Flood risk 1/10 · Minimal
- FEMA flood zone
- X (unshaded)
- Chance of flooding over 30 yrs
- 0.0%
- Est. flood insurance / yr
- $507 – $1,088
Fire risk 4/10 · Minor
- Est. fire insurance / yr
- $490 – $910
Heat risk 6/10 · Moderate
- Hot days now (above 96°F)
- 7 days/yr
- Hot days in 30 yrs
- 18 days/yr
Wind risk 1/10 · Minimal
- Chance of severe wind over 30 yrs
- —
Air-quality risk 8/10 · Major
- Unhealthy air days now
- 16 days/yr
- Unhealthy air days in 30 yrs
- 17 days/yr
Risk factors via First Street. Map © Google.
Why this score? — see what drove the F grade
The composite is a weighted blend of 9 inputs, each scored 0–100. Each bar is that input's sub-score; the figure is the points it added to the 100-point composite (weight × sub-score).
- Appreciation +8.2/10.0
- Cash flow +4.7/30.0
- Livability +3.2/5.0
- Rent growth +2.5/5.0
- Condition / age +2.5/5.0
- Schools +2.4/10.0
- 1% rule +0.6/10.0
- DSCR +0.0/10.0
- ARV discount +0.0/15.0
$399,000
🖨 Deal sheet (PDF) 📄 Offer letter ✓ Due diligence
Listing remarks MLS
This charming plot of land, snuggled just off Highway 50, offers an effortless journey to 95A, USA Parkway, and the delightful towns of Fernley, Fallon, Reno, and Sparks. The neighborhood is a cozy mix of manufactured and site-built homes, creating a warm and welcoming atmosphere. Imagine having an acre of space just for you - plenty of room for a dream home, your beloved pets, fun toys, and even storage. , The views are nothing short of spectacular with sprawling valleys, the serene desert, and majestic mountains painting a daily masterpiece for you. Rest assured, you have access to water on the street and nearby power sources.
Key facts
- Outdoor space
- Massive garage
- 1 acre lot
Tags
Property features AI
Finance
- Other: Zoning: RR3T
- HOA & community: Subdivision: Sagebrush Ph 3; Not a senior community
Exterior
- Parking: Detached garage (2 vehicles) with man door
- Utilities: Well water; Septic tank; Electricity connected; Leased propane
- Home design: Manufactured double-wide home; One story
- Construction: Vinyl siding; Asphalt/composition roof; 8-point foundation; Built as a manufactured home
- Exterior features: Level lot; No fencing; No pool or spa; Publicly maintained county road frontage
Interior
- Kitchen: Dishwasher; Microwave
- Flooring: Carpet; Vinyl
- Bathrooms: 2 full bathrooms
- Heating & cooling: Propane heating; Central air conditioning
- Interior features: Ceiling fans; Kitchen island; Pantry; Double-pane windows
- Laundry & utility: Laundry room with washer hookup
Neighborhood map
What this means for you Summary
Snapshot
- This is a 3-bed/2.0-bath manufactured listed at $399k.
Deal economics
- At list price, monthly cash flow is $-993 ($-12k/yr) — negative.
- To cash-flow at today's rent, offer at most $255k (36.0% below list).
- To meet the 1% rule (rent ≥ 1% of price), the offer needs to be $223k (44.0% below list).
- Recommended offer: $223k (44.0% below list) — sets the bar for 1% rule.
Location & tenants
- Location reads 65/100 on livability (#42 in NV) — a middle-class / working-renter tenant base. Strengths: cost of living A+, housing A+, health & safety A-; Watch: amenities F, commute F, employment D-.
- Lyon County School District (town): math 21% / reading 35% proficiency, ranked #14 of 17 in NV (top 82%) — low school quality limits family demand, transient renter base, plan for 1-2y turnover.
- Zoned schools: Silver Stage Middle School (math 18% / reading 33%, grade F, #62 of 109 statewide, top 58%, 329 students, 100% FRL); Silver Stage High School (math 17% / reading 42%, grade F, #67 of 131 statewide, top 53%, 333 students, 100% FRL) — zoned schools average 100% FRL vs 42% district-wide (58 pts higher); higher-poverty schools than district average — tighter screening recommended.
- Market conditions: 247 active listings in the ZIP; 1 comparable units currently listed for rent nearby; 297 units permitted in Lyon County in 2024 (80 in 5+ unit buildings).
Forward outlook
- In year one you build about $28k of equity ($3k loan paydown + $25k appreciation (6.4% local appreciation)).
- Lyon County population projected at -20% by 2050 — secular population decline; favor cash flow + early exit over multi-decade hold.
- By year 2, paydown + projected appreciation supports a ~$45k cash-out refi (75% LTV) — recoverable capital for the next deal without selling this one.
Negotiation context
- It's been on market 16 days — a 2% lower offer ($393k) is reasonable based on typical stale-listing flexibility.
- 5 sale attempts since 22y ago with the ask held roughly flat each time — persistent listings suggest the price (not the market) is what's stuck; bring a comps-based counter.
- Current owner paid $25k; list at $399k implies a 1496% gain — meaningful room to come down on a strong offer.
Risks & watch-outs
- Climate carrying-cost: extreme-heat days projected 7→18/yr by 2055 (HVAC capex compounding) — expect insurance premiums to compound above CPI over the hold.
Questions for the listing agent
- What do current leases actually rent for vs. the listed asking? Can we see a recent rent roll and the last 12 months of T-12 income?
- Is there a deadline driving the sale (1031 exchange, divorce, estate, relocation)? That informs how much negotiation room exists.
- Schools are F-rated, which usually means shorter tenancies and higher turnover. Who's the typical renter profile here, and what's been the actual vacancy rate?
- The area grade is low — what's the realistic commute time and amenity access for the typical tenant pool here? Any planned neighborhood developments (good or bad) we should know about?
- What's the average days-on-market for RENTAL listings here right now (not sales)? A rising rental-DOM trend means longer vacancies and softer asking-rent achievability than the comps imply.
- What's the recent tenant-quality profile in this submarket — average credit score on applications, eviction rate, late-payment / NSF rate, and stable-employment percentage? A property-management company in the area should have these aggregated.
- How much new for-sale + rental construction is in the pipeline within 1–3 miles? Heavy new supply typically softens prices + rents 12–24 months out; constrained supply supports both.
Investment metrics
- 1% rule
- 0.56% ✗
- Cap rate
- 3.31%
- Cash-on-cash
- -10.67%
- DSCR
- 0.53
- GRM
- 14.9
CMA / ARV
- ARV (on-the-fly)
- $319,395
- Comps found
- 12
Show comp detail 12 sales within ~0.75 mi
| Address | Dist | Beds/Ba | Sqft | Sold | Price | $/sf | Match |
|---|---|---|---|---|---|---|---|
| 7575 Remington Rd | 0.16mi | 3/2.0 | 1,605 (0%) | 6mo | $299,000 | $186 | 87 |
| 7605 Remington Rd | 0.14mi | 3/2.0 | 1,605 (0%) | 9mo | $320,000 | $199 | 86 |
| 7515 Remington Rd | 0.22mi | 3/2.0 | 1,605 (0%) | 10mo | $325,000 | $202 | 82 |
| 7570 Remington Rd | 0.16mi | 3/2.0 | 1,605 (0%) | 16mo | $325,000 | $202 | 80 |
| 7565 Springfield Rd | 0.17mi | 3/2.0 | 1,512 (-6%) | 4mo | $363,000 | $240 | 79 |
| 1715 E 10th | 0.57mi | 3/2.0 | 1,584 (-1%) | 7mo | $358,000 | $226 | 66 |
| 7635 Remington Rd | 0.11mi | 3/2.5 | 1,771 (+10%) | 12mo | $329,000 | $186 | 65 |
| 7590 Remington Rd | 0.13mi | 3/2.5 | 1,771 (+10%) | 13mo | $329,000 | $186 | 64 |
| 7545 Remington Rd | 0.17mi | 3/2.5 | 1,771 (+10%) | 13mo | $332,000 | $187 | 62 |
| 7540 Remington Rd | 0.18mi | 3/2.5 | 1,771 (+10%) | 14mo | $329,000 | $186 | 61 |
| 2215 9th St | 0.67mi | 3/2.0 | 1,716 (+7%) | 10mo | $465,000 | $271 | 49 |
| 7925 Remington Rd | 0.25mi | 4/2.0 (+1) | 1,813 (+13%) | 15mo | $339,900 | $187 | 49 |
Match score weights: distance 35% · size 25% · config 20% · recency 20%. Top-matched comps best support the ARV.
Projected returns pro-forma
6.36% appreciation · 3.0% rent growth · sell at horizon
- IRR
- 7.8%
- Equity multiple
- 1.54×
- Total profit
- $60,575
- Equity at exit
- $259,984
- IRR
- 9.5%
- Equity multiple
- 3.02×
- Total profit
- $225,688
- Equity at exit
- $479,581
Cash invested: $111,720 (down + closing). Projections, not guarantees.
Landlord ↔ Tenant lean methodology
- Overall (STATE)
- 71 Landlord-Friendly
- State Nevada
- 71 Landlord-Friendly · R+1
- County
- — inherits STATE
- City
- — inherits STATE
ZIP-level market 89429
- Home prices YoY
- 2.4%
- Active inventory
- 247
- Price-to-rent
- 14.9×
Monthly cashflow live
- Estimated rent
- $2,233 medium interval (Pro) →
- Mortgage (P&I)
- −$2,092
- Tax est. 1.5%
- −$499 /mo · $5,985/yr
- Insurance
- −$166
- HOA
- −$0
- Lot rent leased land?
- −$0
- Vacancy / Maint / Mgmt
- −$469
- Net cashflow
- $-993
Break-even live
Sensitivity live
| Price | -10% $-718 | -5% $-855 | +0% $-993 | +5% $-1,131 | +10% $-1,269 |
|---|---|---|---|---|---|
| Rent | -10% $-1,170 | -5% $-1,082 | +0% $-993 | +5% $-905 | +10% $-817 |
| Rate | -1.0pp $-792 | -0.5pp $-892 | base $-993 | +0.5pp $-1,097 | +1.0pp $-1,202 |
UW: 25.0% down · 7.5% · 30yr · 1.5% tax · 5.0% vac · 8.0% maint · 8.0% mgmt
Financing live
Cash to close
- Down payment
- $99,750
- Closing costs
- $11,970
- Reserves months
- —
- Total cash needed
- —
Loan-product check · same deal, 3 products live
Conventional
25% down · 7.5% · 30yr
- Down + closing
- —
- Monthly P&I
- —
- Monthly cashflow
- —
- DSCR
- —
- Eligible?
- —
Personal DTI + credit; lowest rate.
DSCR
20% down · 8.5% · 30yr
- Down + closing
- —
- Monthly P&I
- —
- Monthly cashflow
- —
- DSCR
- —
- Eligible?
- —
No personal income docs; deal must DSCR.
Hard money
10% down · 12.0% · 12mo
- Down + closing
- —
- Monthly P&I
- —
- Monthly cashflow
- —
- DSCR
- —
- Eligible?
- —
Short-term bridge; refi at stabilization.
Rent comps 1 comps
| Address | Beds | Baths | Sqft | Rent | $/sqft | DOM | Units | Dist |
|---|---|---|---|---|---|---|---|---|
| 1785 E Antelope St Silver Springs, NV | 4.0 | 2.0 | 1922 | $2,900 | $1.51 | 46d | 1 | 0.87mi |
Listing history 12 events
-
2026-06-22days on market $399,000 Active 16 DOM
-
2026-06-18days on market $399,000 Active 13 DOM
-
2026-06-17days on market $399,000 Active 12 DOM
-
2026-06-16days on market $399,000 Active 11 DOM
-
2026-06-15days on market $399,000 Active 10 DOM
-
2026-06-14days on market $399,000 Active 8 DOM
-
2026-06-13days on market $399,000 Active 7 DOM
-
2026-06-10days on market $399,000 Active 5 DOM
-
2026-06-09days on market $399,000 Active 4 DOM
-
2026-06-08days on market $399,000 Active 3 DOM
-
2026-06-07remarks 695-char remark
-
2026-06-07$399,000 Active 2 DOM
ⓘ Source: listings_history table (triggers on properties + properties_extension) + one-shot
backfill from property_details.listing_events for pre-trigger history.
Climate risk First Street
- Flood 1/10 Low FEMA zone X (unshaded) · 0% chance over 30 yrs
- Wildfire 4/10 Moderate
- Heat 6/10 Major 7 d/yr ≥96°F today · 18 d/yr by 30 yrs out
- Wind 1/10 Low
- Air quality 8/10 Severe 16 unhealthy d/yr today · 17 by 30 yrs out
Nearby sold comps map
Loading sold comps map…
Walkable amenities ~0.75 mi
Loading nearby amenities…
Taxation est. · year 1
- Rental income
- $26,796
- − Mortgage interest
- −$22,350
- − Property taxes
- −$5,985
- − Insurance
- −$1,995
- − Repairs & maintenance
- −$2,144
- − Management
- −$2,144
- − Depreciation
- −$11,607
- Taxable loss
- −$19,429
- Est. tax savings @ 24.0%
- +$4,663
- After-tax cash flow
- $-7,257/yr
For passive investors: Depreciation is non-cash, so a rental often shows a tax loss while cash-flowing — sheltering income. Rental losses are passive: they offset passive income freely, and up to $25,000/yr can offset ordinary (W-2) income if you actively participate and your MAGI is under $100k (phasing out to $0 by $150k); unused losses carry forward. On sale, claimed depreciation is recaptured at up to 25%, and gains may owe capital-gains tax (a 1031 exchange can defer both). Figures are a year-1 estimate at your 24.0% rate — not tax advice; consult a CPA.
Schools (NCES district)
- District
- Lyon County School District
- NCES district ID
- 3200300
- Math proficiency
- 21% ▼ -11.00%
- Reading proficiency
- 35% ▼ -7.00%
- Median HH income
- $48,197
- Composite
- 24.32/100
- National rank
- #7707
- State rank
- #14 of 17 in NV
Livability — Silver Springs
- Score
- 65/100
- State rank
- #42
- US rank
- #13362
Category grades
Schools grade is shown separately in the Schools card above.
Census & demographics
- Census place
- Silver Springs, NV
- City population
- 7,949
- Population (ZIP)
- 7,949
Population outlook (Lyon County) Hauer SSP2
- Today (2025)
- 51,655 people
- By 2030
- 50,194 · -2.8%
- By 2040
- 46,155 · -10.6%
- By 2050
- 41,580 · -19.5%
- By 2075
- 32,687 · -36.7%
- By 2100
- 24,111 · -53.3%
Race, ethnicity, and origin ACS 2023
- Neighborhood character
- Predominantly White (83%)
- Race & ethnicity
- White 83% Two or more races 8% Hispanic / Latino 8% Native American 2%
- Hispanic origin (detail)
- Mexican 7%
- Common ancestry
- Slovak 3% Lithuanian 2% Italian 2%
- Foreign-born
- 5% · Canada, China
- Languages at home
- 92% English-only · Spanish 5% Arabic 1% Chinese 1%
Political lean MEDSL · Lyon
- 2024 margin
- Solid R (+44.4) · D 26.7% · R 71.1% · Other 2.2%
- 2008→2024 swing
- -26.5pp toward R · 2008: -17.9pp · 2024: -44.4pp
- All cycles
- 2024: R+44.4 2020: R+41.1 2016: R+41.5 2012: R+28.6 2008: R+17.9
Not yet ingested
- Civics
- —
Market trends
- HPI YoY
- ▲ 6.36%
- Current HPI
- 271.5945
- Rent YoY
- —
- Metro
- —
- State GDP YoY
- ▲ 3.08%
- F500 in state
- 6
Industry mix (Fortune 500 HQ in NV)
| Industry | F500 HQs | Revenue |
|---|---|---|
| Hotels / Casinos | 3 | $36B |
|
||
Price history
+2855.6% since first listed14 events — show timeline
- 2026-06-05 Listed $399,000 NNRMLS
- 2024-04-26 Sold (Public Records) $25,000 Public Records
- 2024-04-26 Sold (MLS) $25,000 NNRMLS
- 2024-04-11 Contingent — NNRMLS
- 2023-12-29 Price Changed $25,000 NNRMLS
- 2023-08-14 Listed $30,000 NNRMLS
- 2011-01-01 Listing Removed — NNRMLS
- 2008-05-03 Listed $20,000 NNRMLS
- 2007-01-01 Listing Removed — NNRMLS
- 2006-07-29 Listed $55,000 NNRMLS
- 2004-09-23 Sold (Public Records) $13,000 Public Records
- 2004-09-23 Sold (MLS) $13,000 NNRMLS
- 2004-07-21 Listing Removed — NNRMLS
- 2004-07-14 Listed $13,500 NNRMLS
Property tax history
+17.7%/yrLatest (2025): $504 · +224.4% YoY. Source: county tax records.
Cash-flow waterfall
monthlySold comps — $/sqft
last 12 mo · ≤1 miLoading sold comps…