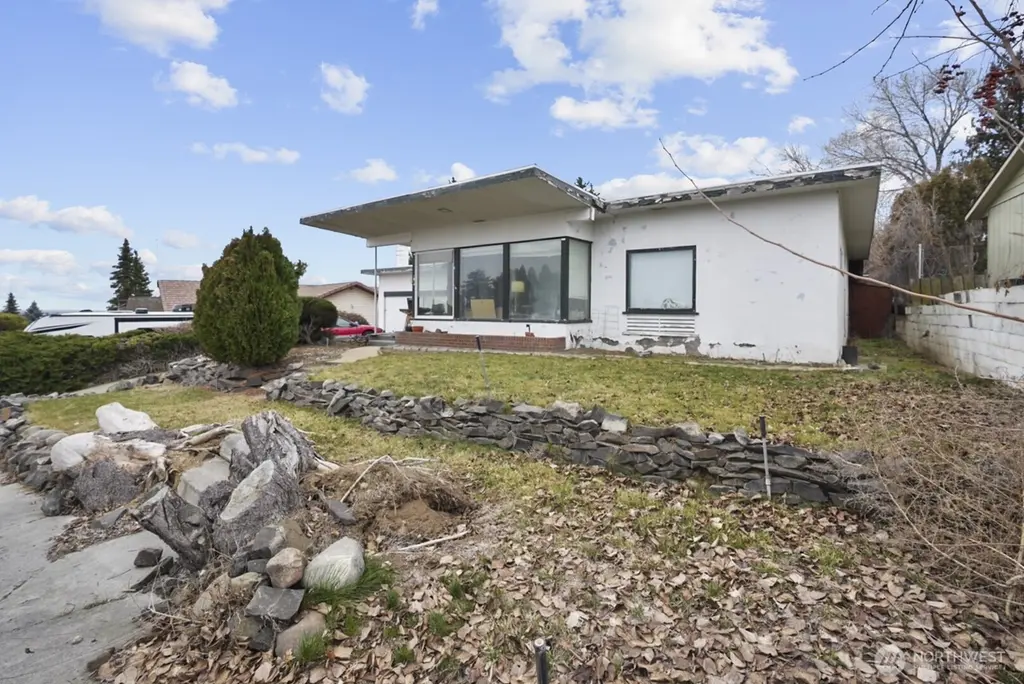
321 Maringo Rd · Ephrata, WA
Flood risk 1/10 · Minimal
- FEMA flood zone
- X (unshaded)
- Chance of flooding over 30 yrs
- 0.0%
- Est. flood insurance / yr
- $507 – $1,088
Fire risk 5/10 · Moderate
- Est. fire insurance / yr
- $604 – $1,122
Heat risk 4/10 · Minor
- Hot days now (above 97°F)
- 7 days/yr
- Hot days in 30 yrs
- 15 days/yr
Wind risk 1/10 · Minimal
- Chance of severe wind over 30 yrs
- —
Air-quality risk 9/10 · Severe
- Unhealthy air days now
- 18 days/yr
- Unhealthy air days in 30 yrs
- 18 days/yr
Risk factors via First Street. Map © Google.
Why this score? — see what drove the D+ grade
The composite is a weighted blend of 9 inputs, each scored 0–100. Each bar is that input's sub-score; the figure is the points it added to the 100-point composite (weight × sub-score).
- ARV discount +15.0/15.0
- Cash flow +13.5/30.0
- Schools +5.2/10.0
- DSCR +4.1/10.0
- Livability +4.0/5.0
- 1% rule +3.1/10.0
- Rent growth +2.5/5.0
- Condition / age +2.5/5.0
- Appreciation +0.0/10.0
$230,000
🖨 Deal sheet 📄 Offer letter ✓ Due diligence
Listing remarks
Have you been looking for a home with one of the best views in Ephrata? This is your opportunity to own a property with sweeping city views and incredible sunrise and sunset scenery. Large windows throughout the home provide an abundance of natural light while perfectly framing the beautiful views overlooking the city below. This 3-bedroom, 1.75-bath home offers 1,513 square feet of living space and is ready for your vision. With solid bones and a desirable layout, this fixer-upper is ideal for buyers looking to customize and add value. Bring your tool belt and imagination to transform this home into something truly special and uniquely yours. Located in an established area, this property o
Key facts
- Desirable layout
- Space and potential
- Sweeping city views
Tags
Neighborhood map
What this means for you Summary
Snapshot
- This is a 3-bed/2.0-bath single-family listed at $230k.
Deal economics
- At list price, monthly cash flow is $10 ($123/yr) — positive.
- The deal already cash-flows at list — no discount required.
- To meet the 1% rule (rent ≥ 1% of price), the offer needs to be $186k (19.1% below list).
- Recommended offer: $186k (19.1% below list) — sets the bar for 1% rule.
- Cap rate 6.3% vs local median 3.4% in Ephrata — top-decile yield for the area; either an underpriced asset or a hidden risk that comps aren't pricing in. Stress-test before assuming the spread holds.
Location & tenants
- Location reads 80/100 on livability (#83 in WA, #1,613 nationally) — a professional / high-income tenant draw. Strengths: commute A+, cost of living A+, housing A+; Watch: amenities F.
- Ephrata School District (town): math 56% / reading 62% proficiency, ranked #72 of 291 in WA (top 25%) — acceptable for families but not a draw, mixed tenant base, ~2y average lease.
- Market conditions: 232 active listings in the ZIP; 9 comparable units currently listed for rent nearby; rentals lingering (median 44d on market — plan ~5-8 weeks vacancy on turnover, expect pricing pressure); 100% of comp listings sitting > 30 days — soft ceiling on asking rent; 559 units permitted in Grant County in 2024 (35 in 5+ unit buildings).
- This rent runs 31% of the median local income ($73k/yr) — at the standard rent-burdened threshold; future hikes will face affordability resistance.
Forward outlook
- Local home prices are declining (-3.0%/yr); year-one equity from $2k of loan paydown is wiped out by about $7k of value loss. Plan a longer hold.
- Grant County population projected at +16% by 2050 — long-run rental-demand tailwind backs the buy-and-hold thesis.
Negotiation context
- It's been on market 137 days — a 12% lower offer ($202k) is reasonable based on typical stale-listing flexibility.
- 3 sale attempts since 22y ago; this cycle's ask has dropped $20k (8%) from the opening price — seller is motivated, your offer sets the floor, not the list.
- Current owner paid $109k; list at $230k implies a 111% gain — meaningful room to come down on a strong offer.
Risks & watch-outs
- Watch-outs: built in 1949 — expect roof / HVAC / electrical / plumbing capex.
- Climate carrying-cost: moderate wildfire risk — expect insurance premiums to compound above CPI over the hold.
Questions for the listing agent
- It's been on market 137 days. Have you received any prior offers? Is the seller open to a 19% concession, seller financing, or rate buy-down credit?
- Built in 1949 — when were the roof, HVAC, electrical panel, plumbing, and water heater last replaced?
- Why hasn't it sold? Are there any deal-killer items the seller is aware of (foundation, flood, title, zoning, code violations)?
- Is there a deadline driving the sale (1031 exchange, divorce, estate, relocation)? That informs how much negotiation room exists.
- The area grade is low — what's the realistic commute time and amenity access for the typical tenant pool here? Any planned neighborhood developments (good or bad) we should know about?
- What's the average days-on-market for RENTAL listings here right now (not sales)? A rising rental-DOM trend means longer vacancies and softer asking-rent achievability than the comps imply.
- What's the recent tenant-quality profile in this submarket — average credit score on applications, eviction rate, late-payment / NSF rate, and stable-employment percentage? A property-management company in the area should have these aggregated.
- How much new for-sale + rental construction is in the pipeline within 1–3 miles? Heavy new supply typically softens prices + rents 12–24 months out; constrained supply supports both.
Investment metrics
- 1% rule
- 0.81% ✗
- Cap rate
- 6.35%
- Cash-on-cash
- 0.19%
- DSCR
- 1.01
- GRM
- 10.3
CMA / ARV
- ARV (median comp)
- $327,890
- List price
- $230,000
- Delta
- -29.85%
- Verdict
- UNDERPRICED
- Comps
- 20 within 1.0 mi
Show comp detail 9 sales within ~0.75 mi
| Address | Dist | Beds/Ba | Sqft | Sold | Price | $/sf | Match |
|---|---|---|---|---|---|---|---|
| 329 Maringo Rd | 0.01mi | 3/1.5 | 1,540 (+2%) | 22mo | $293,000 | $190 | 76 |
| 481 Patrick Rd | 0.33mi | 3/2.0 | 1,470 (-3%) | 17mo | $349,900 | $238 | 66 |
| 203 Columbia Rd | 0.19mi | 3/1.5 | 1,712 (+13%) | 6mo | $355,000 | $207 | 62 |
| 209 Maringo Rd | 0.18mi | 4/2.0 (+1) | 1,712 (+13%) | 10mo | $245,000 | $143 | 56 |
| 411 Patrick Rd | 0.21mi | 3/1.0 | 1,352 (-11%) | 18mo | $275,000 | $203 | 54 |
| 221 Statter Rd | 0.19mi | 3/2.0 | 1,296 (-14%) | 17mo | $355,000 | $274 | 53 |
| 258 D St SW | 0.70mi | 2/2.0 (-1) | 1,440 (-5%) | 12mo | $290,000 | $201 | 44 |
| 246 E St SW | 0.65mi | 3/2.0 | 1,444 (-5%) | 23mo | $310,000 | $215 | 43 |
| 303 C St NW | 0.56mi | 2/1.0 (-1) | 1,357 (-10%) | 22mo | $245,000 | $181 | 29 |
Match score weights: distance 35% · size 25% · config 20% · recency 20%. Top-matched comps best support the ARV.
Projected returns pro-forma
-3.0% appreciation · 3.0% rent growth · sell at horizon
- IRR
- -16.0%
- Equity multiple
- 0.43×
- Total profit
- $-36,671
- Equity at exit
- $34,294
- IRR
- -7.7%
- Equity multiple
- 0.51×
- Total profit
- $-31,306
- Equity at exit
- $19,886
Cash invested: $64,400 (down + closing). Projections, not guarantees.
Landlord ↔ Tenant lean methodology
- Overall (STATE)
- 28 Tenant-Leaning
- State Washington
- 28 Tenant-Leaning · D+8
- County
- — inherits STATE
- City
- — inherits STATE
ZIP-level market 98823
- Active inventory
- 232
- Price-to-rent
- 10.3×
Monthly cashflow live
- Estimated rent
- $1,861 high interval (Pro) →
- Mortgage (P&I)
- −$1,206
- Tax from tax record
- −$158 /mo · $1,892/yr
- Insurance
- −$96
- HOA
- −$0
- Vacancy / Maint / Mgmt
- −$391
- Net cashflow
- $10
Break-even live
UW: 25.0% down · 7.5% · 30yr · 1.5% tax · 5.0% vac · 8.0% maint · 8.0% mgmt
Financing live
Cash to close
- Down payment
- $57,500
- Closing costs
- $6,900
- Reserves months
- —
- Total cash needed
- —
Loan-product check · same deal, 3 products live
Conventional
25% down · 7.5% · 30yr
- Down + closing
- —
- Monthly P&I
- —
- Monthly cashflow
- —
- DSCR
- —
- Eligible?
- —
Personal DTI + credit; lowest rate.
DSCR
20% down · 8.5% · 30yr
- Down + closing
- —
- Monthly P&I
- —
- Monthly cashflow
- —
- DSCR
- —
- Eligible?
- —
No personal income docs; deal must DSCR.
Hard money
10% down · 12.0% · 12mo
- Down + closing
- —
- Monthly P&I
- —
- Monthly cashflow
- —
- DSCR
- —
- Eligible?
- —
Short-term bridge; refi at stabilization.
Rent comps 9 comps
| Address | Beds | Baths | Sqft | Rent | $/sqft | DOM | Units | Dist |
|---|---|---|---|---|---|---|---|---|
| 613 3rd Ave NE Apt 5 Ephrata, WA | 3.0 | 2.5 | 1300 | $1,650 | $1.27 | 43d | 1 | 0.99mi |
| 707 3rd Ave NE Unit 5 Ephrata, WA | 3.0 | 2.5 | 1300 | $1,650 | $1.27 | 43d | 1 | 1.00mi |
| 710 7th Ave NE Ephrata, WA | 3.0 | 2.5 | 1925 | $2,195 | $1.14 | 43d | 1 | 1.01mi |
| 711 3rd Ave NE Unit 5 Ephrata, WA | 3.0 | 2.5 | 1360 | $1,650 | $1.21 | 43d | 1 | 1.02mi |
| 713 3rd Ave NE Unit 4 Ephrata, WA | 3.0 | 2.5 | 1350 | $1,395 | $1.03 | 43d | 1 | 1.03mi |
| 807 3rd Ave NE Unit 5 Ephrata, WA | 3.0 | 2.5 | 1350 | $1,600 | $1.19 | 43d | 1 | 1.06mi |
| 370 Ivy St NE Ephrata, WA | 3.0 | 2.5 | 1500 | $2,300 | $1.53 | 43d | 1 | 1.12mi |
| 255 J St NE Ephrata, WA | 3.0 | 1.5 | 1400 | $1,550 | $1.11 | 43d | 1 | 1.15mi |
| 1311 2nd Ave Ephrata, WA | 3.0 | 2.5 | 1294 | $1,900 | $1.47 | 43d | 1 | 1.36mi |
Listing history 24 events
-
2026-06-19days on market $230,000 Active 137 DOM
-
2026-06-18days on market $230,000 Active 136 DOM
-
2026-06-17days on market $230,000 Active 135 DOM
-
2026-06-16days on market $230,000 Active 134 DOM
-
2026-06-15pricedays on market $230,000 Active 133 DOM
-
2026-06-14days on market $240,000 Active 131 DOM
-
2026-06-13days on market $240,000 Active 130 DOM
-
2026-06-10days on market $240,000 Active 128 DOM
-
2026-06-09days on market $240,000 Active 127 DOM
-
2026-06-08days on market $240,000 Active 126 DOM
-
2026-06-07days on market $240,000 Active 125 DOM
-
2026-06-05days on market $240,000 Active 122 DOM
-
2026-06-03days on market $240,000 Active 121 DOM
-
2026-06-02days on market $240,000 Active 120 DOM
-
2026-06-01days on market $240,000 Active 119 DOM
-
2026-05-31days on market $240,000 Active 118 DOM
-
2026-05-30days on market $240,000 Active 117 DOM
-
2026-03-17status Active
-
2026-03-08status Pending
-
2026-02-18price $240,000
-
2026-01-24$250,000 Active
-
2005-02-08soldstatus $109,000
-
2005-02-04soldstatus $109,000
-
2004-10-04$115,000
ⓘ Source: listings_history table (triggers on properties + properties_extension) + one-shot
backfill from property_details.listing_events for pre-trigger history.
Tax reassessment forecast WA · Resets to sale price
- Current annual tax
- $1,892 · $158/mo
- Projected year-2 tax
- $2,254 · $188/mo
- Expected delta
- +$362/yr (+$30/mo · 19.1%)
ⓘ Screening estimate from a state-policy table — verify with the county assessor before closing.
Climate risk First Street
- Flood 1/10 Low FEMA zone X (unshaded) · 0% chance over 30 yrs
- Wildfire 5/10 Major
- Heat 4/10 Moderate 7 d/yr ≥97°F today · 15 d/yr by 30 yrs out
- Wind 1/10 Low
- Air quality 9/10 Extreme 18 unhealthy d/yr today · 18 by 30 yrs out
Nearby sold comps map
Loading sold comps map…
Walkable amenities ~0.75 mi
Loading nearby amenities…
Taxation est. · year 1
- Rental income
- $22,327
- − Mortgage interest
- −$12,884
- − Property taxes
- −$1,892
- − Insurance
- −$1,150
- − Repairs & maintenance
- −$1,786
- − Management
- −$1,786
- − Depreciation
- −$6,691
- Taxable loss
- −$3,862
- Est. tax savings @ 24.0%
- +$927
- After-tax cash flow
- $1,049/yr
For passive investors: Depreciation is non-cash, so a rental often shows a tax loss while cash-flowing — sheltering income. Rental losses are passive: they offset passive income freely, and up to $25,000/yr can offset ordinary (W-2) income if you actively participate and your MAGI is under $100k (phasing out to $0 by $150k); unused losses carry forward. On sale, claimed depreciation is recaptured at up to 25%, and gains may owe capital-gains tax (a 1031 exchange can defer both). Figures are a year-1 estimate at your 24.0% rate — not tax advice; consult a CPA.
Schools (NCES district)
- District
- Ephrata School District
- NCES district ID
- 5302610
- Math proficiency
- 56% ▼ -1.00%
- Reading proficiency
- 62% ▲ 1.00%
- Median HH income
- $49,652
- Composite
- 51.86/100
- National rank
- #3574
- State rank
- #72 of 291 in WA
Livability — Ephrata
- Score
- 80/100
- State rank
- #83
- US rank
- #1613
Category grades
Schools grade is shown separately in the Schools card above.
Census & demographics
- Census place
- Ephrata, WA
- County
- Grant County · 61,643 people
- City population
- 12,188
- Metro
- Moses Lake, WA
- Population (ZIP)
- 12,188
- Household income
- $73,074
- Rent vs Own
- Severe rent burden
- 182.0
Population outlook (Grant County) Hauer SSP2
- Today (2025)
- 99,356 people
- By 2030
- 102,107 · +2.8%
- By 2040
- 108,318 · +9.0%
- By 2050
- 114,712 · +15.5%
- By 2075
- 131,376 · +32.2%
- By 2100
- 146,163 · +47.1%
Race, ethnicity, and origin ACS 2023
- Neighborhood character
- Majority White (64%)
- Race & ethnicity
- White 64% Hispanic / Latino 30% Two or more races 13%
- Hispanic origin (detail)
- Mexican 29%
- Common ancestry
- Italian 4% Scottish 3% Portuguese 3%
- Foreign-born
- 7% · Canada
- Languages at home
- 77% English-only · Spanish 23%
Political lean MEDSL · Grant
- 2024 margin
- Solid R (+37.5) · D 30.0% · R 67.4% · Other 2.6%
- 2008→2024 swing
- -9.9pp toward R · 2008: -27.5pp · 2024: -37.5pp
- All cycles
- 2024: R+37.5 2020: R+34.4 2016: R+37.9 2012: R+32.6 2008: R+27.5
Not yet ingested
- Civics
- —
Market trends
- HPI YoY
- ▼ -356.36%
- Current HPI
- 219.8763
- Rent YoY
- —
- Metro
- Moses Lake, WA
- State GDP YoY
- ▲ 4.65%
- F500 in state
- 22
Industry mix (Fortune 500 HQ in WA)
| Industry | F500 HQs | Revenue |
|---|---|---|
| Retail | 2 | $269B |
|
||
| Technology / Retail | 1 | $638B |
|
||
| Technology | 1 | $245B |
|
||
| Telecommunications | 1 | $38B |
|
||
| Food / Beverage | 1 | $36B |
|
||
| Automotive / Trucks | 1 | $34B |
|
||
Price history
+108.7% since first listed7 events — show timeline
- 2026-03-17 Relisted — NWMLS as Distributed by MLS Grid
- 2026-03-08 Pending — NWMLS as Distributed by MLS Grid
- 2026-02-18 Price Changed $240,000 NWMLS as Distributed by MLS Grid
- 2026-01-24 Listed $250,000 NWMLS as Distributed by MLS Grid
- 2005-02-08 Sold (Public Records) $109,000 Public Records
- 2005-02-04 Sold (MLS) $109,000 NWMLS as Distributed by MLS Grid
- 2004-10-04 Listed $115,000 NWMLS as Distributed by MLS Grid
Property tax history
+0.3%/yrLatest (2026): $1,892 · +0.0% YoY. Source: county tax records.
Cash-flow waterfall
monthlySold comps — $/sqft
last 12 mo · ≤1 miLoading sold comps…