 25-Plex
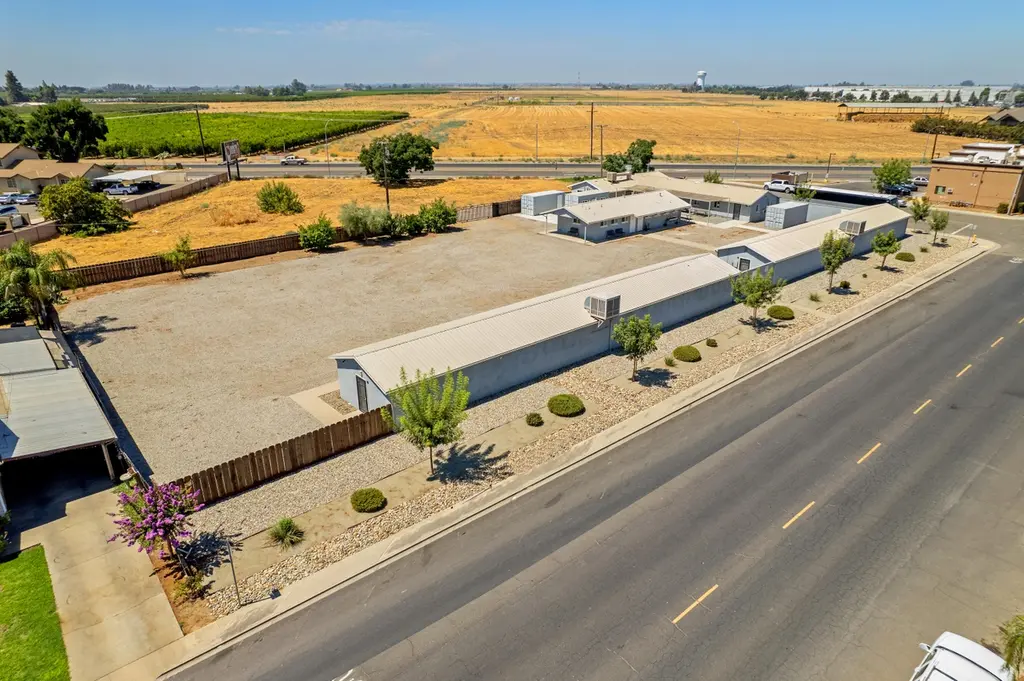
636 W Kern St · Dinuba, CA
Flood risk 7/10 · Major
- FEMA flood zone
- AO
- Chance of flooding over 30 yrs
- 0.99%
- Est. flood insurance / yr
- $848 – $2,087
Fire risk 8/10 · Major
- Est. fire insurance / yr
- $659 – $1,223
Heat risk 8/10 · Major
- Hot days now (above 106°F)
- 7 days/yr
- Hot days in 30 yrs
- 17 days/yr
Wind risk 1/10 · Minimal
- Chance of severe wind over 30 yrs
- —
Air-quality risk 10/10 · Severe
- Unhealthy air days now
- 47 days/yr
- Unhealthy air days in 30 yrs
- 53 days/yr
Risk factors via First Street. Map © Google.
Why this score? — see what drove the B grade
The composite is a weighted blend of 9 inputs, each scored 0–100. Each bar is that input's sub-score; the figure is the points it added to the 100-point composite (weight × sub-score).
- Cash flow +30.0/30.0
- 1% rule +10.0/10.0
- DSCR +10.0/10.0
- ARV discount +7.5/15.0
- Condition / age +4.0/5.0
- Schools +3.7/10.0
- Livability +3.1/5.0
- Rent growth +2.5/5.0
- Appreciation +0.0/10.0
$1,850,000
🖨 Deal sheet 📄 Offer letter ✓ Due diligence
Multi-family units
County records classify this as Multi-Family (5+ Unit). Listing-text estimate: 25 units. confirmed
5+ unit building — per-unit beds/baths from public records are typically unavailable; the breakdown below (if shown) is an estimate from the listing text.
Listing remarks MLS
Multi-Unit Property that is currently used for H-2A Housing. Permitted for 74 Beds making this an ideal property for Supported Housing Senior, Transitional, Afgan, California Department of Social Services, Rehabilitation. Remodeled in 2020 and ready for a new owner or tenant. Commercial Grade Kitchen with Walk-In Refrigerator and Freezer. Kitchen has the capacity to prepare and store +1,000 meals per day. Fenced and gated grounds create an ideal property for privacy and security. Laundry facility, Restrooms and Showers, Outdoor eating and staging area. See Marketing Flyer for more details. .. Currently Permitted for 74 Beds with room for Expansion Two 20' sea trains for additional storage 1,000sf shaded outdoor concrete eating area Gravel yard for staging and storing equipment and vehicles Interior and Exteriors have been remodeled, landscaped and fenced Metal roofs, new flooring, light fixtures, rain gutters, video security system.
Key facts
- Walk-in refrigerator
- Outdoor eating area
- Laundry facility
Tags
Neighborhood map
What this means for you Summary
Snapshot
- This is a 25 × 3-bed/?-bath units multifamily listed at $1.85M. Condition is rated good.
Deal economics
- At list price, monthly cash flow is $13k ($151k/yr) — positive. Per door: $504/mo.
- The deal already cash-flows at list — no discount required.
- Meets the 1% rule at list price ($32k rent vs $1.85M).
- Recommended offer: $1.79M (3.0% below list) — sets the bar for market timing.
- Cap rate 14.5% vs local median 2.7% in Dinuba — top-decile yield for the area; either an underpriced asset or a hidden risk that comps aren't pricing in. Stress-test before assuming the spread holds.
Location & tenants
- Location reads 61/100 on livability (#517 in CA) — a middle-class / working-renter tenant base. Strengths: commute A+, housing A+; Watch: schools F, crime F, amenities F.
- Dinuba Unified (town): math 26% / reading 62% proficiency, ranked #215 of 517 in CA (top 42%) — families likely to look elsewhere, expect single-tenant / working-renter base with shorter leases; 74% free/reduced lunch — lower-income household profile, screen leases tightly.
- Market conditions: 99 active listings in the ZIP; 1,447 units permitted in Tulare County in 2024 (307 in 5+ unit buildings).
Forward outlook
- Local home prices are declining (-3.0%/yr); year-one equity from $13k of loan paydown is wiped out by about $56k of value loss. Plan a longer hold.
- Tulare County population projected at +10% by 2050 — modest demand growth; plan on rents tracking national, not racing it.
- At projected returns (-3.0% appreciation + 3.0% rent growth), your $518k cash investment doubles in ~5 years — after that, you're playing with house money.
Negotiation context
- It's been on market 38 days — a 3% lower offer ($1.79M) is reasonable based on typical stale-listing flexibility.
Risks & watch-outs
- Watch-outs: flood insurance adds $122/mo.
- Climate carrying-cost: in FEMA flood zone AO (mandatory federal flood insurance); severe wildfire risk; extreme-heat days projected 7→17/yr by 2055 (HVAC capex compounding) — expect insurance premiums to compound above CPI over the hold.
Questions for the listing agent
- It's been on market 38 days. Have you received any prior offers? Is the seller open to a 3% concession, seller financing, or rate buy-down credit?
- Can we see the unit-by-unit rent roll, current vacancy, and any below-market leases? What's the average tenancy length?
- What capital expenditures (roof, boiler, parking lot, exteriors) have been made in the last 5 years, and what's planned in the next 2?
- What's the actual annual flood-insurance premium (NFIP or private), and is the property in a SFHA with mandatory coverage?
- Is there a deadline driving the sale (1031 exchange, divorce, estate, relocation)? That informs how much negotiation room exists.
- Schools are F-rated, which usually means shorter tenancies and higher turnover. Who's the typical renter profile here, and what's been the actual vacancy rate?
- Crime grade is F in this area — have there been break-ins, vandalism, or insurance claims at this property in the last 3 years? What carrier currently insures it and at what premium?
- What's the average days-on-market for RENTAL listings here right now (not sales)? A rising rental-DOM trend means longer vacancies and softer asking-rent achievability than the comps imply.
- What's the recent tenant-quality profile in this submarket — average credit score on applications, eviction rate, late-payment / NSF rate, and stable-employment percentage? A property-management company in the area should have these aggregated.
- How much new apartment / multifamily construction is in the pipeline within 1–3 miles? Heavy new supply (>2% of stock underway) typically softens rents 12–24 months out; light construction supports rent growth.
Investment metrics
- 1% rule
- 1.74% ✓
- Cap rate
- 14.54%
- Cash-on-cash
- 29.46%
- DSCR
- 2.31
- GRM
- 4.8
CMA / ARV
- ARV (median comp)
- $679,541
- List price
- $1,850,000
- Delta
- 172.24%
- Verdict
- OVERPRICED
- Comps
- 3 within 1.0 mi
Projected returns pro-forma
-3.0% appreciation · 3.0% rent growth · sell at horizon
- IRR
- 23.6%
- Equity multiple
- 1.97×
- Total profit
- $503,000
- Equity at exit
- $275,841
- IRR
- 31.5%
- Equity multiple
- 3.84×
- Total profit
- $1,473,271
- Equity at exit
- $159,954
Cash invested: $518,000 (down + closing). Projections, not guarantees.
Landlord ↔ Tenant lean methodology
- Overall (STATE)
- 18 Strongly Tenant-Friendly
- State California
- 18 Strongly Tenant-Friendly · D+13
- County
- — inherits STATE
- City
- — inherits STATE
ZIP-level market 93618
- Active inventory
- 99
- Price-to-rent
- 119.4×
Monthly cashflow live
- Estimated rent
- $32,282 medium interval (Pro) →
- Mortgage (P&I)
- −$9,702
- Tax est. 1.5%
- −$2,312 /mo · $27,750/yr
- Insurance
- −$771
- Flood insurance flood zone
- −$122 /mo · $1,468/yr
- HOA
- −$0
- Vacancy / Maint / Mgmt
- −$6,779
- Net cashflow
- $12,596
Break-even live
25-unit breakdown (identical units grouped — click to expand)
| Units | Beds | Baths | Est. rent |
|---|---|---|---|
| 25× units | 3 | — | $32,275 |
| #1 | 3 | — | $1,291 |
| #2 | 3 | — | $1,291 |
| #3 | 3 | — | $1,291 |
| #4 | 3 | — | $1,291 |
| #5 | 3 | — | $1,291 |
| #6 | 3 | — | $1,291 |
| #7 | 3 | — | $1,291 |
| #8 | 3 | — | $1,291 |
| #9 | 3 | — | $1,291 |
| #10 | 3 | — | $1,291 |
| #11 | 3 | — | $1,291 |
| #12 | 3 | — | $1,291 |
| #13 | 3 | — | $1,291 |
| #14 | 3 | — | $1,291 |
| #15 | 3 | — | $1,291 |
| #16 | 3 | — | $1,291 |
| #17 | 3 | — | $1,291 |
| #18 | 3 | — | $1,291 |
| #19 | 3 | — | $1,291 |
| #20 | 3 | — | $1,291 |
| #21 | 3 | — | $1,291 |
| #22 | 3 | — | $1,291 |
| #23 | 3 | — | $1,291 |
| #24 | 3 | — | $1,291 |
| #25 | 3 | — | $1,291 |
| Total (25 units) | $32,282 | ||
UW: 25.0% down · 7.5% · 30yr · 1.5% tax · 5.0% vac · 8.0% maint · 8.0% mgmt
Financing live
Cash to close
- Down payment
- $462,500
- Closing costs
- $55,500
- Reserves months
- —
- Total cash needed
- —
Loan-product check · same deal, 3 products live
Conventional
25% down · 7.5% · 30yr
- Down + closing
- —
- Monthly P&I
- —
- Monthly cashflow
- —
- DSCR
- —
- Eligible?
- —
Personal DTI + credit; lowest rate.
DSCR
20% down · 8.5% · 30yr
- Down + closing
- —
- Monthly P&I
- —
- Monthly cashflow
- —
- DSCR
- —
- Eligible?
- —
No personal income docs; deal must DSCR.
Hard money
10% down · 12.0% · 12mo
- Down + closing
- —
- Monthly P&I
- —
- Monthly cashflow
- —
- DSCR
- —
- Eligible?
- —
Short-term bridge; refi at stabilization.
Listing history 21 events
-
2026-06-18days on market $1,850,000 Active 38 DOM
-
2026-06-17days on market $1,850,000 Active 37 DOM
-
2026-06-16days on market $1,850,000 Active 36 DOM
-
2026-06-15days on market $1,850,000 Active 35 DOM
-
2026-06-14days on market $1,850,000 Active 33 DOM
-
2026-06-13days on market $1,850,000 Active 32 DOM
-
2026-06-10days on market $1,850,000 Active 30 DOM
-
2026-06-09days on market $1,850,000 Active 29 DOM
-
2026-06-08days on market $1,850,000 Active 28 DOM
-
2026-06-07days on market $1,850,000 Active 27 DOM
-
2026-06-05days on market $1,850,000 Active 24 DOM
-
2026-06-03days on market $1,850,000 Active 23 DOM
-
2026-06-03price $1,850,000 Active 22 DOM
-
2026-06-02days on market $1,900,000 Active 22 DOM
-
2026-06-01days on market $1,900,000 Active 21 DOM
-
2026-05-31days on market $1,900,000 Active 20 DOM
-
2026-05-30days on market $1,900,000 Active 19 DOM
-
2026-05-11$1,900,000 Active 946-char remark
Show marketing remark (946 chars)
Multi-Unit Property that is currently used for H-2A Housing. Permitted for 74 Beds making this an ideal property for Supported Housing Senior, Transitional, Afgan, California Department of Social Services, Rehabilitation. Remodeled in 2020 and ready for a new owner or tenant. Commercial Grade Kitchen with Walk-In Refrigerator and Freezer. Kitchen has the capacity to prepare and store +1,000 meals per day. Fenced and gated grounds create an ideal property for privacy and security. Laundry facility, Restrooms and Showers, Outdoor eating and staging area. See Marketing Flyer for more details. .. Currently Permitted for 74 Beds with room for Expansion Two 20' sea trains for additional storage 1,000sf shaded outdoor concrete eating area Gravel yard for staging and storing equipment and vehicles Interior and Exteriors have been remodeled, landscaped and fenced Metal roofs, new flooring, light fixtures, rain gutters, video security system.
-
2026-02-15price $2,100,000
-
2026-01-22price $2,250,000
-
2025-12-10price $2,400,000
ⓘ Source: listings_history table (triggers on properties + properties_extension) + one-shot
backfill from property_details.listing_events for pre-trigger history.
Climate risk First Street
- Flood 7/10 Severe FEMA zone AO · 99% chance over 30 yrs
- Wildfire 8/10 Severe
- Heat 8/10 Severe 7 d/yr ≥106°F today · 17 d/yr by 30 yrs out
- Wind 1/10 Low
- Air quality 10/10 Extreme 47 unhealthy d/yr today · 53 by 30 yrs out
Nearby sold comps map
Loading sold comps map…
Walkable amenities ~0.75 mi
Loading nearby amenities…
Taxation est. · year 1
- Rental income
- $387,384
- − Mortgage interest
- −$103,629
- − Property taxes
- −$27,750
- − Insurance
- −$10,718
- − Repairs & maintenance
- −$30,991
- − Management
- −$30,991
- − Depreciation
- −$53,818
- Taxable income
- $129,488
- Est. tax owed @ 24.0%
- −$31,077
- After-tax cash flow
- $120,069/yr
For passive investors: Depreciation is non-cash, so a rental often shows a tax loss while cash-flowing — sheltering income. Rental losses are passive: they offset passive income freely, and up to $25,000/yr can offset ordinary (W-2) income if you actively participate and your MAGI is under $100k (phasing out to $0 by $150k); unused losses carry forward. On sale, claimed depreciation is recaptured at up to 25%, and gains may owe capital-gains tax (a 1031 exchange can defer both). Figures are a year-1 estimate at your 24.0% rate — not tax advice; consult a CPA.
Condition & rehab AI · 12 photos
This multi-family property is in good condition with a cosmetic rehab level, ready for a new owner or tenant. Minor improvements to landscaping and curb appeal can significantly enhance its value.
Value-add opportunities
- Both Landscaping and curb appeal improvements — Enhanced landscaping can improve both resale and rental value.
- Both Painting exterior walls — Fresh paint can improve the home's curb appeal and perceived value.
- Both Upgrading common area flooring — Upgraded flooring can enhance the common areas and improve the overall aesthetic appeal.
Renovation cost estimate screening
Value-add ROI direction
- Both Landscaping and curb appeal improvements — Enhanced landscaping can improve both resale and rental value. ↑
- Both Painting exterior walls — Fresh paint can improve the home's curb appeal and perceived value. ↑
- Both Upgrading common area flooring — Upgraded flooring can enhance the common areas and improve the overall aesthetic appeal. ↑
ⓘ Cost ranges are severity-bucket heuristics (US national rule-of-thumb). Get contractor quotes + a written scope before underwriting a rehab budget.
Schools (NCES district)
- District
- Dinuba Unified
- NCES district ID
- 0600065
- Math proficiency
- 26% ▼ -8.00%
- Reading proficiency
- 62% ▲ 17.00%
- Median HH income
- $39,763
- Composite
- 36.68/100
- National rank
- #4603
- State rank
- #215 of 517 in CA
Livability — Dinuba
- Score
- 61/100
- State rank
- #517
- US rank
- #17466
Category grades
Schools grade is shown separately in the Schools card above.
Census & demographics
- Census place
- Dinuba, CA
- Population (ZIP)
- 32,223
Population outlook (Tulare County) Hauer SSP2
- Today (2025)
- 484,681 people
- By 2030
- 496,241 · +2.4%
- By 2040
- 518,507 · +7.0%
- By 2050
- 534,920 · +10.4%
- By 2075
- 548,417 · +13.2%
- By 2100
- 513,085 · +5.9%
Race, ethnicity, and origin ACS 2023
- Neighborhood character
- Predominantly Hispanic (87%)
- Race & ethnicity
- Hispanic / Latino 87% Two or more races 21% White 11%
- Hispanic origin (detail)
- Mexican 83%
- Foreign-born
- 25% · Canada
- Languages at home
- 36% English-only · Spanish 63%
Political lean MEDSL · Tulare
- 2024 margin
- Strong R (+20.7) · D 38.5% · R 59.2% · Other 2.3%
- 2008→2024 swing
- -5.4pp toward R · 2008: -15.3pp · 2024: -20.7pp
- All cycles
- 2024: R+20.7 2020: R+7.8 2016: R+12.1 2012: R+17.8 2008: R+15.3
Not yet ingested
- Civics
- —
Market trends
- HPI YoY
- ▼ -295.76%
- Current HPI
- 360.2783
- Rent YoY
- —
- Metro
- —
- State GDP YoY
- ▲ 3.21%
- F500 in state
- 116
Industry mix (Fortune 500 HQ in CA)
| Industry | F500 HQs | Revenue |
|---|---|---|
| Technology | 27 | $1,492B |
|
||
| Financial Services | 3 | $174B |
|
||
| Retail | 3 | $44B |
|
||
| Insurance | 3 | $26B |
|
||
| Media / Entertainment | 2 | $115B |
|
||
| Pharmaceuticals / Biotech | 2 | $62B |
|
||
Price history
-20.8% since first listed4 events — show timeline
- 2026-05-11 Listed $1,900,000 TCMLS
- 2026-02-15 Price Changed $2,100,000 TCMLS
- 2026-01-22 Price Changed $2,250,000 TCMLS
- 2025-12-10 Price Changed $2,400,000 TCMLS
Cash-flow waterfall
monthlySold comps — $/sqft
last 12 mo · ≤1 miLoading sold comps…