 Multi-family
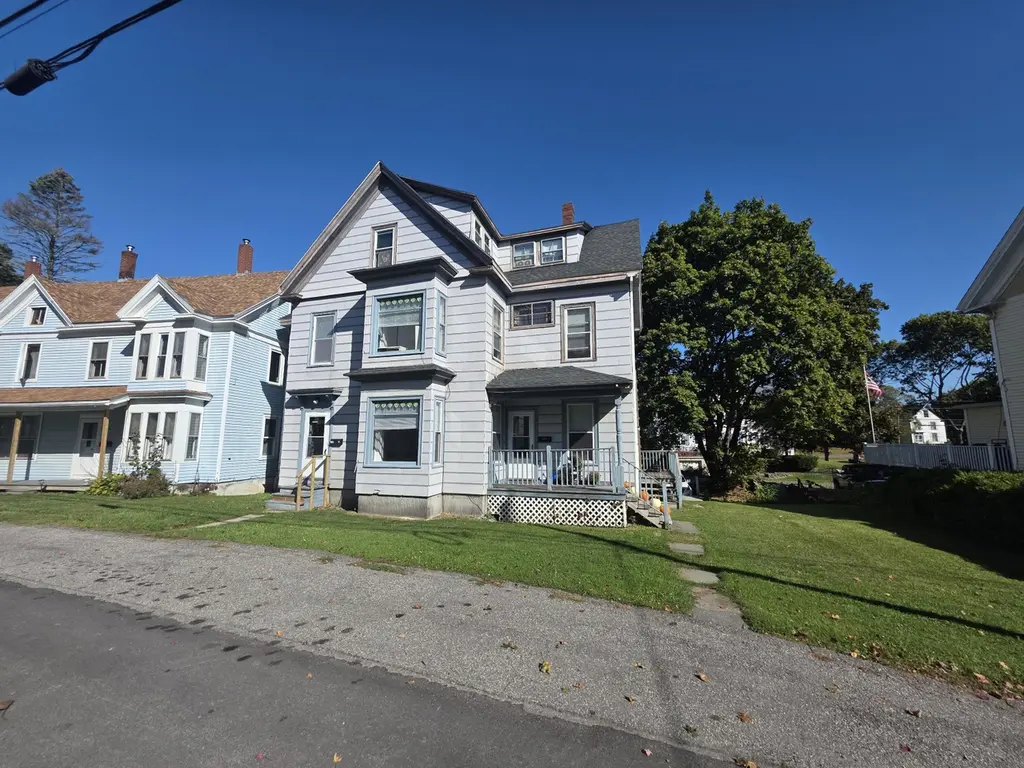
115 Limerock St · Rockland, ME
Flood risk 6/10 · Moderate
- FEMA flood zone
- X (unshaded)
- Chance of flooding over 30 yrs
- 0.73%
- Est. flood insurance / yr
- $473 – $860
Fire risk 1/10 · Minimal
- Est. fire insurance / yr
- $669 – $1,243
Heat risk 5/10 · Moderate
- Hot days now (above 85°F)
- 7 days/yr
- Hot days in 30 yrs
- 17 days/yr
Wind risk 6/10 · Moderate
- Chance of severe wind over 30 yrs
- 73.0%
Air-quality risk 1/10 · Minimal
- Unhealthy air days now
- 0 days/yr
- Unhealthy air days in 30 yrs
- 0 days/yr
Risk factors via First Street. Map © Google.
Why this score? — see what drove the B- grade
The composite is a weighted blend of 9 inputs, each scored 0–100. Each bar is that input's sub-score; the figure is the points it added to the 100-point composite (weight × sub-score).
- Cash flow +30.0/30.0
- 1% rule +10.0/10.0
- DSCR +10.0/10.0
- Schools +6.8/10.0
- ARV discount +3.2/15.0
- Livability +3.1/5.0
- Rent growth +2.5/5.0
- Condition / age +2.2/5.0
- Appreciation +0.0/10.0
$445,000
🖨 Deal sheet (PDF) 📄 Offer letter ✓ Due diligence
Multi-family units
County records classify this as Multi-Family (2-4 Unit). Listing-text estimate: 1 unit. estimate disagrees with records
Listing remarks MLS
Four-Plex with Strong Rental History and Prime In-Town Location Four-plex with a strong rental history in a prime in-town location. The building features 2 - two bedrooms, 1-bath unit, 1- one bedroom, 1 bath unit and an efficiency, each offering a functional layout and dependable rental appeal—making it an attractive option for a variety of tenant needs. Ideally situated just a short distance from Main and Park Streets, the property provides tenants with easy access to banks, restaurants, and shops. Its central setting makes it especially desirable for those seeking a balance of residential comfort and urban convenience. With its proven rental performance, efficient unit mix, and proximity to Rockland's downtown amenities, this property presents an exceptional opportunity for investors looking to expand their portfolio or for owner-occupants seeking supplemental rental income. Being sold separately
Key facts
- Functional layout
- Central setting
- 6,534 sq ft lot
Tags
Neighborhood map
What this means for you Summary
Snapshot
- This is a 4-bed/4.0-bath multifamily listed at $445k. Condition is rated fair.
Deal economics
- At list price, monthly cash flow is $2k ($28k/yr) — positive.
- The deal already cash-flows at list — no discount required.
- Meets the 1% rule at list price ($7k rent vs $445k).
- Recommended offer: $392k (12.0% below list) — sets the bar for market timing.
- Cap rate 12.5% vs local median 3.2% in Rockland — top-decile yield for the area; either an underpriced asset or a hidden risk that comps aren't pricing in. Stress-test before assuming the spread holds.
Location & tenants
- Location reads 62/100 on livability (#116 in ME) — a middle-class / working-renter tenant base. Strengths: cost of living A+, housing A+, crime A-; Watch: schools D, amenities F, commute F.
- RSU 13 (town): math 77% / reading 85% proficiency, ranked #84 of 112 in ME (top 75%) — strong family-tenant draw, lease renewals of 3-5y typical.
- Market conditions: 72 active listings in the ZIP; 160 units permitted in Knox County in 2024 (58 in 5+ unit buildings).
- At $6,818/mo this rent would consume 145% of the median local household income ($57k/yr) (locally 279% of renters already pay >50% of income on rent) — very limited rent-growth headroom before tenants either downsize or default.
Forward outlook
- Local home prices are declining (-3.0%/yr); year-one equity from $3k of loan paydown is wiped out by about $13k of value loss. Plan a longer hold.
- Knox County population projected at -14% by 2050 — secular population decline; favor cash flow + early exit over multi-decade hold.
- At projected returns (-3.0% appreciation + 3.0% rent growth), your $125k cash investment doubles in ~6 years — after that, you're playing with house money.
Negotiation context
- It's been on market 256 days — a 12% lower offer ($392k) is reasonable based on typical stale-listing flexibility.
Risks & watch-outs
- Watch-outs: built in 1890 — expect roof / HVAC / electrical / plumbing capex.
- Climate carrying-cost: major flood risk; major wind risk, 73% chance of damaging wind over 30y; extreme-heat days projected 7→17/yr by 2055 (HVAC capex compounding) — expect insurance premiums to compound above CPI over the hold.
Questions for the listing agent
- It's been on market 256 days. Have you received any prior offers? Is the seller open to a 12% concession, seller financing, or rate buy-down credit?
- Have any recent inspections been done? Can we get a copy of the seller's disclosures and any deferred-maintenance estimates?
- Built in 1890 — when were the roof, HVAC, electrical panel, plumbing, and water heater last replaced?
- Why hasn't it sold? Are there any deal-killer items the seller is aware of (foundation, flood, title, zoning, code violations)?
- Is there a deadline driving the sale (1031 exchange, divorce, estate, relocation)? That informs how much negotiation room exists.
- Schools are D-rated, which usually means shorter tenancies and higher turnover. Who's the typical renter profile here, and what's been the actual vacancy rate?
- What's the average days-on-market for RENTAL listings here right now (not sales)? A rising rental-DOM trend means longer vacancies and softer asking-rent achievability than the comps imply.
- What's the recent tenant-quality profile in this submarket — average credit score on applications, eviction rate, late-payment / NSF rate, and stable-employment percentage? A property-management company in the area should have these aggregated.
- How much new apartment / multifamily construction is in the pipeline within 1–3 miles? Heavy new supply (>2% of stock underway) typically softens rents 12–24 months out; light construction supports rent growth.
Investment metrics
- 1% rule
- 1.53% ✓
- Cap rate
- 12.52%
- Cash-on-cash
- 22.26%
- DSCR
- 1.99
- GRM
- 5.4
CMA / ARV
- ARV (median comp)
- $406,253
- List price
- $445,000
- Delta
- 9.54%
- Verdict
- FAIR
- Comps
- 20 within 1.0 mi
Show comp detail 4 sales within ~0.75 mi
| Address | Dist | Beds/Ba | Sqft | Sold | Price | $/sf | Match |
|---|---|---|---|---|---|---|---|
| 17 State St | 0.47mi | 3/2.5 (-1) | 2,894 (+2%) | 5mo | $435,000 | $150 | 59 |
| 25 James St | 0.61mi | 4/2.0 | 2,886 (+2%) | 11mo | $350,000 | $121 | 51 |
| 92 Pleasant St | 0.39mi | 4/3.0 | 2,636 (-7%) | 21mo | $350,000 | $133 | 49 |
| 354 Broadway | 0.54mi | 5/3.5 (+1) | 2,488 (-12%) | 11mo | $435,000 | $175 | 39 |
Match score weights: distance 35% · size 25% · config 20% · recency 20%. Top-matched comps best support the ARV.
Projected returns pro-forma
-3.0% appreciation · 3.0% rent growth · sell at horizon
- IRR
- 15.0%
- Equity multiple
- 1.60×
- Total profit
- $75,178
- Equity at exit
- $66,351
- IRR
- 23.7%
- Equity multiple
- 3.05×
- Total profit
- $255,404
- Equity at exit
- $38,475
Cash invested: $124,600 (down + closing). Projections, not guarantees.
Landlord ↔ Tenant lean methodology
- Overall (STATE)
- 41 Moderately Tenant-Leaning
- State Maine
- 41 Moderately Tenant-Leaning · D+2
- County
- — inherits STATE
- City
- — inherits STATE
ZIP-level market 04841
- Home prices YoY
- -17.8%
- Active inventory
- 72
- Price-to-rent
- 21.1×
Monthly cashflow live
- Estimated rent
- $6,818 high interval (Pro) →
- Mortgage (P&I)
- −$2,334
- Tax est. 1.5%
- −$556 /mo · $6,675/yr
- Insurance
- −$185
- HOA
- −$0
- Vacancy / Maint / Mgmt
- −$1,432
- Net cashflow
- $2,311
Break-even live
Sensitivity live
| Price | -10% $2,618 | -5% $2,465 | +0% $2,311 | +5% $2,157 | +10% $2,003 |
|---|---|---|---|---|---|
| Rent | -10% $1,772 | -5% $2,042 | +0% $2,311 | +5% $2,580 | +10% $2,850 |
| Rate | -1.0pp $2,535 | -0.5pp $2,424 | base $2,311 | +0.5pp $2,196 | +1.0pp $2,078 |
4-unit breakdown (identical units grouped — click to expand)
| Units | Beds | Baths | Est. rent |
|---|---|---|---|
| 2× units | 2 | 1 | $3,516 |
| #1 | 2 | 1 | $1,758 |
| #2 | 2 | 1 | $1,758 |
| 2× units | 1 | 1 | $3,302 |
| #3 | 1 | 1 | $1,651 |
| #4 | 1 | 1 | $1,651 |
| Total (4 units) | $6,818 | ||
UW: 25.0% down · 7.5% · 30yr · 1.5% tax · 5.0% vac · 8.0% maint · 8.0% mgmt
Financing live
Cash to close
- Down payment
- $111,250
- Closing costs
- $13,350
- Reserves months
- —
- Total cash needed
- —
Loan-product check · same deal, 3 products live
Conventional
25% down · 7.5% · 30yr
- Down + closing
- —
- Monthly P&I
- —
- Monthly cashflow
- —
- DSCR
- —
- Eligible?
- —
Personal DTI + credit; lowest rate.
DSCR
20% down · 8.5% · 30yr
- Down + closing
- —
- Monthly P&I
- —
- Monthly cashflow
- —
- DSCR
- —
- Eligible?
- —
No personal income docs; deal must DSCR.
Hard money
10% down · 12.0% · 12mo
- Down + closing
- —
- Monthly P&I
- —
- Monthly cashflow
- —
- DSCR
- —
- Eligible?
- —
Short-term bridge; refi at stabilization.
Listing history 16 events
-
2026-06-21days on market $445,000 Active 256 DOM
-
2026-06-18days on market $445,000 Active 253 DOM
-
2026-06-17days on market $445,000 Active 252 DOM
-
2026-06-16days on market $445,000 Active 251 DOM
-
2026-06-15days on market $445,000 Active 250 DOM
-
2026-06-14days on market $445,000 Active 248 DOM
-
2026-06-10days on market $445,000 Active 245 DOM
-
2026-06-09days on market $445,000 Active 244 DOM
-
2026-06-08days on market $445,000 Active 243 DOM
-
2026-06-07days on market $445,000 Active 242 DOM
-
2026-06-03days on market $445,000 Active 238 DOM
-
2026-06-02days on market $445,000 Active 237 DOM
-
2026-06-01days on market $445,000 Active 236 DOM
-
2026-05-31days on market $445,000 Active 235 DOM
-
2026-05-31days on market $445,000 Active 234 DOM
-
2025-10-08$475,000 Active 920-char remark
Show marketing remark (920 chars)
Four-Plex with Strong Rental History and Prime In-Town Location Four-plex with a strong rental history in a prime in-town location. The building features 2 - two bedrooms, 1-bath unit, 1- one bedroom, 1 bath unit and an efficiency, each offering a functional layout and dependable rental appeal—making it an attractive option for a variety of tenant needs. Ideally situated just a short distance from Main and Park Streets, the property provides tenants with easy access to banks, restaurants, and shops. Its central setting makes it especially desirable for those seeking a balance of residential comfort and urban convenience. With its proven rental performance, efficient unit mix, and proximity to Rockland's downtown amenities, this property presents an exceptional opportunity for investors looking to expand their portfolio or for owner-occupants seeking supplemental rental income. Being sold separately
ⓘ Source: listings_history table (triggers on properties + properties_extension) + one-shot
backfill from property_details.listing_events for pre-trigger history.
Climate risk First Street
- Flood 6/10 Major FEMA zone X (unshaded) · 73% chance over 30 yrs
- Wildfire 1/10 Low
- Heat 5/10 Major 7 d/yr ≥85°F today · 17 d/yr by 30 yrs out
- Wind 6/10 Major 73% chance of damaging wind over 30 yrs
- Air quality 1/10 Low 0 unhealthy d/yr today · 0 by 30 yrs out
Nearby sold comps map
Loading sold comps map…
Walkable amenities ~0.75 mi
Loading nearby amenities…
Taxation est. · year 1
- Rental income
- $81,816
- − Mortgage interest
- −$24,927
- − Property taxes
- −$6,675
- − Insurance
- −$2,225
- − Repairs & maintenance
- −$6,545
- − Management
- −$6,545
- − Depreciation
- −$12,945
- Taxable income
- $21,953
- Est. tax owed @ 24.0%
- −$5,269
- After-tax cash flow
- $22,462/yr
For passive investors: Depreciation is non-cash, so a rental often shows a tax loss while cash-flowing — sheltering income. Rental losses are passive: they offset passive income freely, and up to $25,000/yr can offset ordinary (W-2) income if you actively participate and your MAGI is under $100k (phasing out to $0 by $150k); unused losses carry forward. On sale, claimed depreciation is recaptured at up to 25%, and gains may owe capital-gains tax (a 1031 exchange can defer both). Figures are a year-1 estimate at your 24.0% rate — not tax advice; consult a CPA.
Condition & rehab AI · 12 photos
The property requires moderate renovations to improve its curb appeal and interior functionality, making it an attractive investment opportunity.
Repairs flagged
- Minor Kitchen counters — Cluttered and needs cleaning
- Minor Bathroom fixtures — Outdated and needs updating
- Moderate Exterior siding — Weathered and needs repainting
Value-add opportunities
- Both Painting exterior and interior — Enhances curb appeal and interior aesthetics
- Both Updating kitchen and bathrooms — Improves functionality and appeal
- Both Landscaping and curb appeal — Enhances overall property value and appeal
Renovation cost estimate screening
| Repair item | Severity | Est. cost |
|---|---|---|
| Kitchen counters · Cluttered and needs cleaning | Minor | $500–3,000 |
| Bathroom fixtures · Outdated and needs updating | Minor | $500–3,000 |
| Exterior siding · Weathered and needs repainting | Moderate | $3,000–15,000 |
| Total estimated repair cost · 3 items | $4,000–21,000 |
Value-add ROI direction
- Both Painting exterior and interior — Enhances curb appeal and interior aesthetics ↑
- Both Updating kitchen and bathrooms — Improves functionality and appeal ↑
- Both Landscaping and curb appeal — Enhances overall property value and appeal ↑
ⓘ Cost ranges are severity-bucket heuristics (US national rule-of-thumb). Get contractor quotes + a written scope before underwriting a rehab budget.
Schools (NCES district)
- District
- RSU 13
- NCES district ID
- 2314787
- Math proficiency
- 77% ▲ 51.00%
- Reading proficiency
- 85% ▲ 36.00%
- Median HH income
- $43,177
- Composite
- 67.81/100
- National rank
- #363
- State rank
- #84 of 112 in ME
Livability — Rockland
- Score
- 62/100
- State rank
- #116
- US rank
- #16831
Category grades
Schools grade is shown separately in the Schools card above.
Census & demographics
- Census place
- Rockland, ME
- County
- Knox County · 7,035 people
- City population
- 7,035
- Metro
- nan
- Population (ZIP)
- 7,035
- Household income
- $56,533
- Rent vs Own
- Severe rent burden
- 279.0
Population outlook (Knox County) Hauer SSP2
- Today (2025)
- 39,304 people
- By 2030
- 38,497 · -2.1%
- By 2040
- 36,090 · -8.2%
- By 2050
- 33,681 · -14.3%
- By 2075
- 29,934 · -23.8%
- By 2100
- 24,633 · -37.3%
Race, ethnicity, and origin ACS 2023
- Neighborhood character
- Predominantly White (97%)
- Race & ethnicity
- White 97% Two or more races 3%
- Common ancestry
- Slovak 12% Serbian 8% Lithuanian 5%
- Foreign-born
- 1% · Canada
- Languages at home
- 97% English-only · French/Haitian/Cajun 2%
Political lean MEDSL · Knox
- 2024 margin
- D (+18.6) · D 58.2% · R 39.6% · Other 2.1%
- 2008→2024 swing
- -2.8pp toward R · 2008: 21.4pp · 2024: 18.6pp
- All cycles
- 2024: D+18.6 2020: D+19.9 2016: D+14.3 2012: D+22.6 2008: D+21.4
Not yet ingested
- Civics
- —
Market trends
- HPI YoY
- ▼ -73.90%
- Current HPI
- 341.7862
- Rent YoY
- —
- Metro
- nan
- State GDP YoY
- —
- F500 in state
- 0
Price history
1 event — show timeline
- 2025-10-08 Listed $475,000 MREIS
Cash-flow waterfall
monthlySold comps — $/sqft
last 12 mo · ≤1 miLoading sold comps…