488 7 Th · Chama, NM
Flood risk 1/10 · Minimal
- FEMA flood zone
- X (unshaded)
- Chance of flooding over 30 yrs
- 0.0%
- Est. flood insurance / yr
- $507 – $1,088
Fire risk 4/10 · Minor
- Est. fire insurance / yr
- $706 – $1,312
Heat risk 1/10 · Minimal
- Hot days now (above 83°F)
- 8 days/yr
- Hot days in 30 yrs
- 21 days/yr
Wind risk 1/10 · Minimal
- Chance of severe wind over 30 yrs
- —
Air-quality risk 1/10 · Minimal
- Unhealthy air days now
- 0 days/yr
- Unhealthy air days in 30 yrs
- 0 days/yr
Risk factors via First Street. Map © Google.
Why this score? — see what drove the D grade
The composite is a weighted blend of 9 inputs, each scored 0–100. Each bar is that input's sub-score; the figure is the points it added to the 100-point composite (weight × sub-score).
- Cash flow +10.6/30.0
- ARV discount +7.5/15.0
- Appreciation +5.7/10.0
- Schools +5.0/10.0
- DSCR +3.1/10.0
- Livability +2.8/5.0
- Rent growth +2.5/5.0
- Condition / age +2.5/5.0
- 1% rule +2.0/10.0
$165,000
🖨 Deal sheet 📄 Offer letter ✓ Due diligence
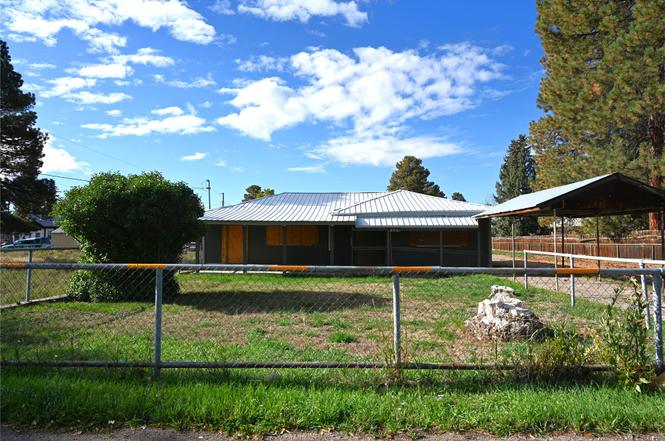
Listing remarks
Charming Northern NM Home in the Village of Chama This 3-bedroom, 1.75-bath home offers solid potential with some updates already completed. While it could use a bit of TLC, it sits on a village lot with city sewer, natural gas a private well—a rare combination that adds to its appeal. The property includes a detached garage, perfect for storage or a workshop. Whether you're looking for a full-time residence, vacation home, or investment opportunity, this home is a great option in the heart of Chama.
Key facts
- Village of chama
- Private well
- Northern nm home
Tags
Property features AI
Finance
- Financial info: Offered for sale
Exterior
- Parking: Detached garage; Two total parking spaces (includes 1 garage space)
- Utilities: Electricity available; Public sewer; Private well water
- Construction: Metal roof; Year built not certain (owner indicated)
- Exterior features: Lot is approximately 0.17 acres
Interior
- Bathrooms: One three-quarter bathroom
- Heating & cooling: Natural gas heating; Space heater; Stove heating
- Interior features: No interior steps; Not ADA compliant
Neighborhood map
What this means for you Summary
Snapshot
- This is a 3-bed/1.0-bath other listed at $165k.
Deal economics
- At list price, monthly cash flow is $-82 ($-982/yr) — negative.
- To cash-flow at today's rent, offer at most $151k (8.8% below list).
- To meet the 1% rule (rent ≥ 1% of price), the offer needs to be $115k (30.5% below list).
- Recommended offer: $115k (30.5% below list) — sets the bar for 1% rule.
Location & tenants
- Location reads 56/100 on livability (#192 in NM) — a working-class tenant base; expect higher turnover. Strengths: cost of living A+, housing B+; Watch: health & safety C-, schools F, crime F.
- Market conditions: 89 active listings in the ZIP.
Forward outlook
- In year one you build about $3k of equity ($1k loan paydown + $2k appreciation (1.3% local appreciation)).
- Rio Arriba County population projected at -27% by 2050 — secular population decline; favor cash flow + early exit over multi-decade hold.
- By year 10, paydown + projected appreciation supports a ~$34k cash-out refi (75% LTV) — recoverable capital for the next deal without selling this one.
Negotiation context
- It's been on market 262 days — a 12% lower offer ($145k) is reasonable based on typical stale-listing flexibility.
Questions for the listing agent
- What do current leases actually rent for vs. the listed asking? Can we see a recent rent roll and the last 12 months of T-12 income?
- It's been on market 262 days. Have you received any prior offers? Is the seller open to a 30% concession, seller financing, or rate buy-down credit?
- Built in 1960 — when were the roof, HVAC, electrical panel, plumbing, and water heater last replaced?
- Why hasn't it sold? Are there any deal-killer items the seller is aware of (foundation, flood, title, zoning, code violations)?
- Is there a deadline driving the sale (1031 exchange, divorce, estate, relocation)? That informs how much negotiation room exists.
- Schools are F-rated, which usually means shorter tenancies and higher turnover. Who's the typical renter profile here, and what's been the actual vacancy rate?
- Crime grade is F in this area — have there been break-ins, vandalism, or insurance claims at this property in the last 3 years? What carrier currently insures it and at what premium?
- The area grade is low — what's the realistic commute time and amenity access for the typical tenant pool here? Any planned neighborhood developments (good or bad) we should know about?
- What's the average days-on-market for RENTAL listings here right now (not sales)? A rising rental-DOM trend means longer vacancies and softer asking-rent achievability than the comps imply.
- What's the recent tenant-quality profile in this submarket — average credit score on applications, eviction rate, late-payment / NSF rate, and stable-employment percentage? A property-management company in the area should have these aggregated.
- How much new for-sale + rental construction is in the pipeline within 1–3 miles? Heavy new supply typically softens prices + rents 12–24 months out; constrained supply supports both.
Investment metrics
- 1% rule
- 0.70% ✗
- Cap rate
- 5.70%
- Cash-on-cash
- -2.13%
- DSCR
- 0.91
- GRM
- 12.0
CMA / ARV
No comps found within radius.
Projected returns pro-forma
1.31% appreciation · 3.0% rent growth · sell at horizon
- IRR
- 0.1%
- Equity multiple
- 1.01×
- Total profit
- $289
- Equity at exit
- $58,981
- IRR
- 4.7%
- Equity multiple
- 1.59×
- Total profit
- $27,324
- Equity at exit
- $80,474
Cash invested: $46,200 (down + closing). Projections, not guarantees.
Landlord ↔ Tenant lean methodology
- Overall (STATE)
- 55 Moderately Landlord-Leaning
- State New Mexico
- 55 Moderately Landlord-Leaning · D+3
- County
- — inherits STATE
- City
- — inherits STATE
ZIP-level market 87520
- Home prices YoY
- 0.8%
- Active inventory
- 89
- Price-to-rent
- 12.0×
Monthly cashflow live
- Estimated rent
- $1,147 medium interval (Pro) →
- Mortgage (P&I)
- −$865
- Tax from tax record
- −$54 /mo · $652/yr
- Insurance
- −$69
- HOA
- −$0
- Vacancy / Maint / Mgmt
- −$241
- Net cashflow
- $-82
Break-even live
UW: 25.0% down · 7.5% · 30yr · 1.5% tax · 5.0% vac · 8.0% maint · 8.0% mgmt
Financing live
Cash to close
- Down payment
- $41,250
- Closing costs
- $4,950
- Reserves months
- —
- Total cash needed
- —
Loan-product check · same deal, 3 products live
Conventional
25% down · 7.5% · 30yr
- Down + closing
- —
- Monthly P&I
- —
- Monthly cashflow
- —
- DSCR
- —
- Eligible?
- —
Personal DTI + credit; lowest rate.
DSCR
20% down · 8.5% · 30yr
- Down + closing
- —
- Monthly P&I
- —
- Monthly cashflow
- —
- DSCR
- —
- Eligible?
- —
No personal income docs; deal must DSCR.
Hard money
10% down · 12.0% · 12mo
- Down + closing
- —
- Monthly P&I
- —
- Monthly cashflow
- —
- DSCR
- —
- Eligible?
- —
Short-term bridge; refi at stabilization.
Listing history 16 events
-
2026-06-18days on market $165,000 Active 262 DOM
-
2026-06-17days on market $165,000 Active 261 DOM
-
2026-06-16days on market $165,000 Active 260 DOM
-
2026-06-15days on market $165,000 Active 259 DOM
-
2026-06-13days on market $165,000 Active 257 DOM
-
2026-06-12days on market $165,000 Active 256 DOM
-
2026-06-09days on market $165,000 Active 253 DOM
-
2026-06-08days on market $165,000 Active 252 DOM
-
2026-06-07days on market $165,000 Active 251 DOM
-
2026-06-05days on market $165,000 Active 249 DOM
-
2026-06-04days on market $165,000 Active 247 DOM
-
2026-06-02days on market $165,000 Active 246 DOM
-
2026-06-01days on market $165,000 Active 245 DOM
-
2026-05-31days on market $165,000 Active 244 DOM
-
2026-02-07price $165,000
-
2025-09-26$200,000 Active
ⓘ Source: listings_history table (triggers on properties + properties_extension) + one-shot
backfill from property_details.listing_events for pre-trigger history.
Tax reassessment forecast NM · Resets to sale price
- Current annual tax
- $652 · $54/mo
- Projected year-2 tax
- $1,320 · $110/mo
- Expected delta
- +$668/yr (+$56/mo · 102.6%)
ⓘ Screening estimate from a state-policy table — verify with the county assessor before closing.
Climate risk First Street
- Flood 1/10 Low FEMA zone X (unshaded) · 0% chance over 30 yrs
- Wildfire 4/10 Moderate
- Heat 1/10 Low 8 d/yr ≥83°F today · 21 d/yr by 30 yrs out
- Wind 1/10 Low
- Air quality 1/10 Low 0 unhealthy d/yr today · 0 by 30 yrs out
Nearby sold comps map
Loading sold comps map…
Walkable amenities ~0.75 mi
Loading nearby amenities…
Taxation est. · year 1
- Rental income
- $13,769
- − Mortgage interest
- −$9,243
- − Property taxes
- −$652
- − Insurance
- −$825
- − Repairs & maintenance
- −$1,102
- − Management
- −$1,102
- − Depreciation
- −$4,800
- Taxable loss
- −$3,953
- Est. tax savings @ 24.0%
- +$949
- After-tax cash flow
- $-34/yr
For passive investors: Depreciation is non-cash, so a rental often shows a tax loss while cash-flowing — sheltering income. Rental losses are passive: they offset passive income freely, and up to $25,000/yr can offset ordinary (W-2) income if you actively participate and your MAGI is under $100k (phasing out to $0 by $150k); unused losses carry forward. On sale, claimed depreciation is recaptured at up to 25%, and gains may owe capital-gains tax (a 1031 exchange can defer both). Figures are a year-1 estimate at your 24.0% rate — not tax advice; consult a CPA.
Schools (NCES district)
No district data.
Livability — Chama
- Score
- 56/100
- State rank
- #192
- US rank
- #23013
Category grades
Schools grade is shown separately in the Schools card above.
Census & demographics
- Census place
- Chama, NM
- Population (ZIP)
- 1,088
Population outlook (Rio Arriba County) Hauer SSP2
- Today (2025)
- 36,893 people
- By 2030
- 35,060 · -5.0%
- By 2040
- 31,035 · -15.9%
- By 2050
- 27,056 · -26.7%
- By 2075
- 19,056 · -48.3%
- By 2100
- 12,332 · -66.6%
Race, ethnicity, and origin ACS 2023
- Neighborhood character
- Diverse neighborhood (Simpson 0.57)
- Race & ethnicity
- Hispanic / Latino 52% White 39% Two or more races 2%
- Hispanic origin (detail)
- Mexican 10%
- Common ancestry
- Romanian 10% Hungarian 5% Portuguese 2%
- Languages at home
- 81% English-only · Spanish 19%
Political lean MEDSL · Rio Arriba
- 2024 margin
- D (+19.4) · D 58.6% · R 39.2% · Other 2.2%
- 2008→2024 swing
- -31.4pp toward R · 2008: 50.9pp · 2024: 19.4pp
- All cycles
- 2024: D+19.4 2020: D+33.6 2016: D+40.3 2012: D+52.6 2008: D+50.9
Not yet ingested
- Civics
- —
Market trends
- HPI YoY
- ▲ 1.31%
- Current HPI
- 154.8397
- Rent YoY
- —
- Metro
- —
- State GDP YoY
- —
- F500 in state
- 0
Price history
-17.5% since first listed2 events — show timeline
- 2026-02-07 Price Changed $165,000 Santa Fe MLS
- 2025-09-26 Listed $200,000 Santa Fe MLS
Property tax history
+4.3%/yrLatest (2025): $652 · +12.3% YoY. Source: county tax records.
Cash-flow waterfall
monthlySold comps — $/sqft
last 12 mo · ≤1 miLoading sold comps…