 6-Plex
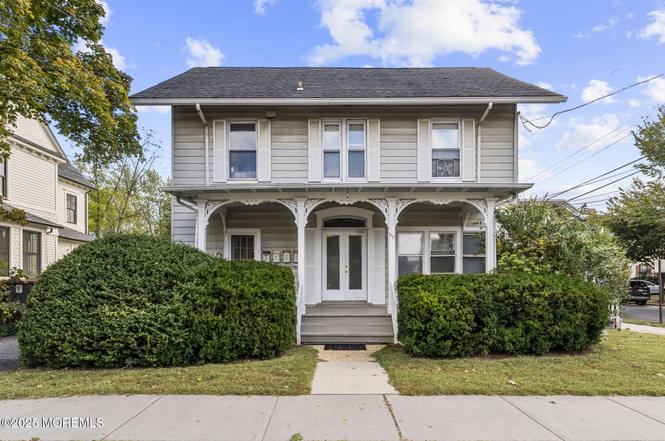
69 Washington St · Red Bank, NJ
Flood risk 1/10 · Minimal
- FEMA flood zone
- X (unshaded)
- Chance of flooding over 30 yrs
- 0.0%
- Est. flood insurance / yr
- $507 – $1,088
Fire risk 1/10 · Minimal
- Est. fire insurance / yr
- $526 – $976
Heat risk 8/10 · Major
- Hot days now (above 95°F)
- 7 days/yr
- Hot days in 30 yrs
- 16 days/yr
Wind risk 8/10 · Major
- Chance of severe wind over 30 yrs
- 80.0%
Air-quality risk 4/10 · Minor
- Unhealthy air days now
- 3 days/yr
- Unhealthy air days in 30 yrs
- 5 days/yr
Risk factors via First Street. Map © Google.
Why this score? — see what drove the B grade
The composite is a weighted blend of 9 inputs, each scored 0–100. Each bar is that input's sub-score; the figure is the points it added to the 100-point composite (weight × sub-score).
- Cash flow +30.0/30.0
- 1% rule +10.0/10.0
- DSCR +10.0/10.0
- ARV discount +7.5/15.0
- Schools +4.4/10.0
- Rent growth +4.1/5.0
- Livability +4.1/5.0
- Condition / age +2.5/5.0
- Appreciation +0.0/10.0
$1,299,900
🖨 Deal sheet (PDF) 📄 Offer letter ✓ Due diligence
Multi-family units
County records classify this as Multi-Family (5+ Unit). Listing-text estimate: 6 units. confirmed
5+ unit building — per-unit beds/baths from public records are typically unavailable; the breakdown below (if shown) is an estimate from the listing text.
Listing remarks
Rare value-add opportunity in the heart of Red Bank! This 6-family multifamily offers below-market rents with significant upside through strategic adjustments as units turn over -- a true investor's dream with the hard work already priced in. Tenants enjoy walkable access to NJ Transit with direct NYC service, plus Red Bank's acclaimed dining, bars, and entertainment -- amenities that keep units full and tenants renewing. A major Netflix production hub coming within 5 miles will drive further demand for quality housing in the area. Premier location, embedded rent growth, and a generational demand catalyst on the doorstep. Don't miss this one. Property is being sold as is.
Key facts
- 6,534 sq ft lot
- Garage
- Built 1900
Neighborhood map
What this means for you Summary
Snapshot
- This is a 6 × 6-bed/6.0-bath units multifamily listed at $1.30M.
Deal economics
- At list price, monthly cash flow is $9k ($109k/yr) — positive. Per door: $2k/mo.
- The deal already cash-flows at list — no discount required.
- Meets the 1% rule at list price ($22k rent vs $1.30M).
- Recommended offer: $1.26M (3.0% below list) — sets the bar for market timing.
Location & tenants
- Location reads 82/100 on livability (#45 in NJ, #1,151 nationally) — a professional / high-income tenant draw. Strengths: amenities A+, commute A+, employment A+; Watch: cost of living F.
- Red Bank Regional School District (suburban): math 34% / reading 49% proficiency, ranked #143 of 472 in NJ (top 30%) — families likely to look elsewhere, expect single-tenant / working-renter base with shorter leases.
- Zoned schools: Red Bank Primary School (math 8% / reading 22%, grade F, #1,124 of 1,303 statewide, top 88%, 591 students, 78% FRL); Red Bank Middle School (math 12% / reading 30%, grade F, #387 of 431 statewide, top 90%, 601 students, 79% FRL); Red Bank Regional High School (math 34% / reading 49%, grade F, #177 of 399 statewide, top 45%, 1,195 students, 29% FRL).
- Zoned-school proficiency averages 26% at this address vs 42% district-wide (-16 pts) — the specific schools serving this property underperform the Red Bank Regional School District average; the district grade overstates school quality for this exact location.
- Market conditions: Rents rising fast (+6.5%/yr); 141 active listings in the ZIP; high-income renter base; 2,840 units permitted in Monmouth County in 2024 (484 in 5+ unit buildings).
Forward outlook
- Local home prices are declining (-3.0%/yr); year-one equity from $9k of loan paydown is wiped out by about $39k of value loss. Plan a longer hold.
- Monmouth County population projected at -11% by 2050 — secular population decline; favor cash flow + early exit over multi-decade hold.
- At projected returns (-3.0% appreciation + 6.5% rent growth), your $364k cash investment doubles in ~4 years — after that, you're playing with house money.
Negotiation context
- It's been on market 36 days — a 3% lower offer ($1.26M) is reasonable based on typical stale-listing flexibility.
- 2 sale attempts with the ask held roughly flat each time — persistent listings suggest the price (not the market) is what's stuck; bring a comps-based counter.
- Current owner paid $290k; list at $1.30M implies a 348% gain — meaningful room to come down on a strong offer.
Risks & watch-outs
- Watch-outs: built in 1900 — expect roof / HVAC / electrical / plumbing capex.
- Climate carrying-cost: severe wind risk, 80% chance of damaging wind over 30y; extreme-heat days projected 7→16/yr by 2055 (HVAC capex compounding) — expect insurance premiums to compound above CPI over the hold.
Questions for the listing agent
- It's been on market 36 days. Have you received any prior offers? Is the seller open to a 3% concession, seller financing, or rate buy-down credit?
- Can we see the unit-by-unit rent roll, current vacancy, and any below-market leases? What's the average tenancy length?
- What capital expenditures (roof, boiler, parking lot, exteriors) have been made in the last 5 years, and what's planned in the next 2?
- Built in 1900 — when were the roof, HVAC, electrical panel, plumbing, and water heater last replaced?
- Is there a deadline driving the sale (1031 exchange, divorce, estate, relocation)? That informs how much negotiation room exists.
- Schools are B-rated — typically a magnet for longer-tenancy family renters. What's the average tenant stay here, and is there a school-zone premium baked into asking?
- What's the average days-on-market for RENTAL listings here right now (not sales)? A rising rental-DOM trend means longer vacancies and softer asking-rent achievability than the comps imply.
- What's the recent tenant-quality profile in this submarket — average credit score on applications, eviction rate, late-payment / NSF rate, and stable-employment percentage? A property-management company in the area should have these aggregated.
- How much new apartment / multifamily construction is in the pipeline within 1–3 miles? Heavy new supply (>2% of stock underway) typically softens rents 12–24 months out; light construction supports rent growth.
Investment metrics
- 1% rule
- 1.71% ✓
- Cap rate
- 14.70%
- Cash-on-cash
- 30.04%
- DSCR
- 2.34
- GRM
- 4.9
CMA / ARV
No comps found within radius.
Projected returns pro-forma
-3.0% appreciation · 6.45% rent growth · sell at horizon
- IRR
- 28.4%
- Equity multiple
- 2.23×
- Total profit
- $449,363
- Equity at exit
- $193,819
- IRR
- 37.7%
- Equity multiple
- 5.09×
- Total profit
- $1,489,879
- Equity at exit
- $112,392
Cash invested: $363,972 (down + closing). Projections, not guarantees.
Landlord ↔ Tenant lean methodology
- Overall (STATE)
- 21 Tenant-Leaning
- State New Jersey
- 21 Tenant-Leaning · D+6
- County
- — inherits STATE
- City
- — inherits STATE
ZIP-level market 07701
- Rents YoY
- 6.5%
- Active inventory
- 141
- Price-to-rent
- 29.3×
Monthly cashflow live
- Estimated rent
- $22,213 medium interval (Pro) →
- Mortgage (P&I)
- −$6,817
- Tax from tax record
- −$1,080 /mo · $12,956/yr
- Insurance
- −$542
- HOA
- −$0
- Vacancy / Maint / Mgmt
- −$4,665
- Net cashflow
- $9,110
Break-even live
Sensitivity live
| Price | -10% $9,846 | -5% $9,478 | +0% $9,110 | +5% $8,742 | +10% $8,374 |
|---|---|---|---|---|---|
| Rent | -10% $7,355 | -5% $8,233 | +0% $9,110 | +5% $9,988 | +10% $10,865 |
| Rate | -1.0pp $9,765 | -0.5pp $9,441 | base $9,110 | +0.5pp $8,773 | +1.0pp $8,431 |
6-unit breakdown (identical units grouped — click to expand)
| Units | Beds | Baths | Est. rent |
|---|---|---|---|
| 6× units | 6 | 6 | $22,212 |
| #1 | 6 | 6 | $3,702 |
| #2 | 6 | 6 | $3,702 |
| #3 | 6 | 6 | $3,702 |
| #4 | 6 | 6 | $3,702 |
| #5 | 6 | 6 | $3,702 |
| #6 | 6 | 6 | $3,702 |
| Total (6 units) | $22,213 | ||
UW: 25.0% down · 7.5% · 30yr · 1.5% tax · 5.0% vac · 8.0% maint · 8.0% mgmt
Financing live
Cash to close
- Down payment
- $324,975
- Closing costs
- $38,997
- Reserves months
- —
- Total cash needed
- —
Loan-product check · same deal, 3 products live
Conventional
25% down · 7.5% · 30yr
- Down + closing
- —
- Monthly P&I
- —
- Monthly cashflow
- —
- DSCR
- —
- Eligible?
- —
Personal DTI + credit; lowest rate.
DSCR
20% down · 8.5% · 30yr
- Down + closing
- —
- Monthly P&I
- —
- Monthly cashflow
- —
- DSCR
- —
- Eligible?
- —
No personal income docs; deal must DSCR.
Hard money
10% down · 12.0% · 12mo
- Down + closing
- —
- Monthly P&I
- —
- Monthly cashflow
- —
- DSCR
- —
- Eligible?
- —
Short-term bridge; refi at stabilization.
Listing history 10 events
-
2026-04-11status Pending
-
2026-03-06$1,299,900 Active
-
2026-03-04historical $1,299,900
-
2025-11-20status Pending
-
2025-10-12$1,299,900 Active
-
2025-10-11historical
-
2015-10-09soldstatus $290,000
-
2003-06-24soldstatus $360,000
-
1999-11-29soldstatus $218,500
-
1979-07-01soldstatus $76,200
ⓘ Source: listings_history table (triggers on properties + properties_extension) + one-shot
backfill from property_details.listing_events for pre-trigger history.
Tax reassessment forecast NJ · Partial reset (capped growth)
- Current annual tax
- $12,956 · $1,080/mo
- Projected year-2 tax
- $22,662 · $1,888/mo
- Expected delta
- +$9,706/yr (+$809/mo · 74.9%)
ⓘ Screening estimate from a state-policy table — verify with the county assessor before closing.
Climate risk First Street
- Flood 1/10 Low FEMA zone X (unshaded) · 0% chance over 30 yrs
- Wildfire 1/10 Low
- Heat 8/10 Severe 7 d/yr ≥95°F today · 16 d/yr by 30 yrs out
- Wind 8/10 Severe 80% chance of damaging wind over 30 yrs
- Air quality 4/10 Moderate 3 unhealthy d/yr today · 5 by 30 yrs out
Nearby sold comps map
Loading sold comps map…
Walkable amenities ~0.75 mi
Loading nearby amenities…
Taxation est. · year 1
- Rental income
- $266,556
- − Mortgage interest
- −$72,815
- − Property taxes
- −$12,956
- − Insurance
- −$6,500
- − Repairs & maintenance
- −$21,324
- − Management
- −$21,324
- − Depreciation
- −$37,815
- Taxable income
- $93,821
- Est. tax owed @ 24.0%
- −$22,517
- After-tax cash flow
- $86,805/yr
For passive investors: Depreciation is non-cash, so a rental often shows a tax loss while cash-flowing — sheltering income. Rental losses are passive: they offset passive income freely, and up to $25,000/yr can offset ordinary (W-2) income if you actively participate and your MAGI is under $100k (phasing out to $0 by $150k); unused losses carry forward. On sale, claimed depreciation is recaptured at up to 25%, and gains may owe capital-gains tax (a 1031 exchange can defer both). Figures are a year-1 estimate at your 24.0% rate — not tax advice; consult a CPA.
Schools (NCES district)
- District
- Red Bank Regional School District
- NCES district ID
- 3413750
- Math proficiency
- 34% ▼ -14.00%
- Reading proficiency
- 49% ▼ -18.00%
- Median HH income
- $141,699
- Composite
- 44.45/100
- National rank
- #2805
- State rank
- #143 of 472 in NJ
Livability — Red Bank
- Score
- 82/100
- State rank
- #45
- US rank
- #1151
Category grades
Schools grade is shown separately in the Schools card above.
Census & demographics
- Census place
- Red Bank, NJ
- County
- Monmouth County · 505,557 people
- City population
- 24,376
- Metro
- New York-Newark-Jersey City, NY-NJ-PA
- Population (ZIP)
- 24,376
- Household income
- $112,143
- Rent vs Own
- Severe rent burden
- 854.0
Population outlook (Monmouth County) Hauer SSP2
- Today (2025)
- 620,308 people
- By 2030
- 612,309 · -1.3%
- By 2040
- 587,297 · -5.3%
- By 2050
- 551,342 · -11.1%
- By 2075
- 472,934 · -23.8%
- By 2100
- 381,534 · -38.5%
Race, ethnicity, and origin ACS 2023
- Neighborhood character
- Predominantly White (73%)
- Race & ethnicity
- White 73% Hispanic / Latino 18% Two or more races 8% Black 4% Native American 2% Asian 2%
- Hispanic origin (detail)
- Mexican 13% Puerto Rican 2%
- Common ancestry
- Romanian 5% Scotch-Irish 2% Lithuanian 2%
- Foreign-born
- 14% · Canada, Dominican Republic, China
- Languages at home
- 81% English-only · Spanish 14% Other Indo-European 3%
Political lean MEDSL · Monmouth
- 2024 margin
- R (+11.4) · D 43.4% · R 54.8% · Other 1.8%
- 2008→2024 swing
- -7.7pp toward R · 2008: -3.7pp · 2024: -11.4pp
- All cycles
- 2024: R+11.4 2020: R+2.8 2016: R+9.5 2012: R+5.5 2008: R+3.7
Not yet ingested
- Civics
- —
Market trends
- HPI YoY
- ▼ -428.28%
- Current HPI
- 350.124
- Rent YoY
- ▲ 6.45%
- Metro
- New York-Newark-Jersey City, NY-NJ-PA
- State GDP YoY
- ▲ 2.05%
- F500 in state
- 34
Industry mix (Fortune 500 HQ in NJ)
| Industry | F500 HQs | Revenue |
|---|---|---|
| Consumer Goods | 3 | $31B |
|
||
| Pharmaceuticals | 2 | $153B |
|
||
| Technology | 2 | $21B |
|
||
| Insurance | 2 | $20B |
|
||
| Healthcare | 2 | $19B |
|
||
| Financial Services | 1 | $70B |
|
||
Price history
+1605.9% since first listed10 events — show timeline
- 2026-04-11 Pending — MOMLS
- 2026-03-06 Listed $1,299,900 MOMLS
- 2026-03-04 Coming Soon $1,299,900 MOMLS
- 2025-11-20 Pending — MOMLS
- 2025-10-12 Listed $1,299,900 MOMLS
- 2025-10-11 Coming Soon — MOMLS
- 2015-10-09 Sold (Public Records) $290,000 Public Records
- 2003-06-24 Sold (Public Records) $360,000 Public Records
- 1999-11-29 Sold (Public Records) $218,500 Public Records
- 1979-07-01 Sold (Public Records) $76,200 Public Records
Property tax history
+1.4%/yrLatest (2025): $12,956 · -1.7% YoY. Source: county tax records.
Cash-flow waterfall
monthlySold comps — $/sqft
last 12 mo · ≤1 miLoading sold comps…