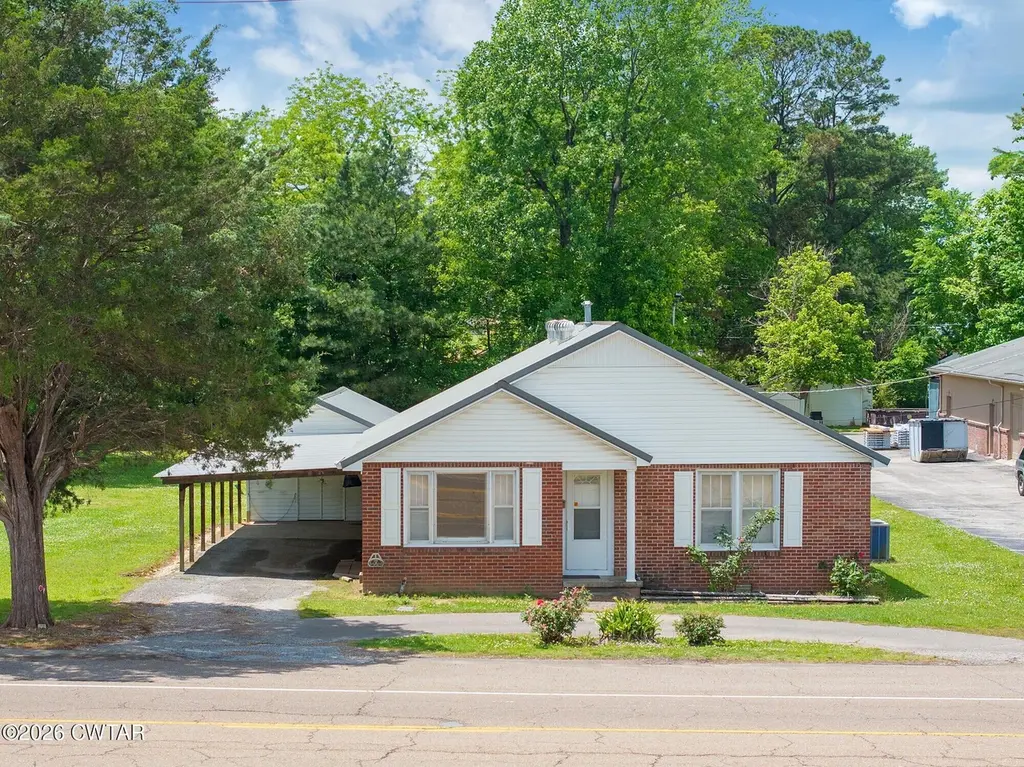
724 S Tennessee Ave · Parsons, TN
Flood risk 1/10 · Minimal
- FEMA flood zone
- X (unshaded)
- Chance of flooding over 30 yrs
- 0.0%
- Est. flood insurance / yr
- $507 – $1,088
Fire risk 5/10 · Moderate
- Est. fire insurance / yr
- $949 – $1,763
Heat risk 6/10 · Moderate
- Hot days now (above 108°F)
- 7 days/yr
- Hot days in 30 yrs
- 21 days/yr
Wind risk 4/10 · Minor
- Chance of severe wind over 30 yrs
- 15.0%
Air-quality risk 1/10 · Minimal
- Unhealthy air days now
- 0 days/yr
- Unhealthy air days in 30 yrs
- 0 days/yr
Risk factors via First Street. Map © Google.
Why this score? — see what drove the C- grade
The composite is a weighted blend of 9 inputs, each scored 0–100. Each bar is that input's sub-score; the figure is the points it added to the 100-point composite (weight × sub-score).
- Cash flow +14.7/30.0
- Appreciation +10.0/10.0
- ARV discount +7.5/15.0
- DSCR +4.5/10.0
- Schools +3.2/10.0
- Livability +3.0/5.0
- 1% rule +2.9/10.0
- Rent growth +2.5/5.0
- Condition / age +2.5/5.0
$155,000
🖨 Deal sheet (PDF) 📄 Offer letter ✓ Due diligence
Listing remarks
Situated on a generous lot in town, this property offers a wealth of possibilities. An existing 3-bedroom, 2-bath residence sits on the lot — perfect as a primary home, rental, or potential renovation project. With ample space and desirable location, this property is ideal for investors, builders, or anyone looking to customize or expand. Enjoy the convenience of nearby schools, shopping, and town amenities, all while having room to grow. Whether you're looking to update, rebuild, or develop, this is a rare opportunity in a sought-after area.
Key facts
- Generous lot
- Existing residence
- Rental
Tags
Property features AI
Finance
- Other: Property type: Residential
Exterior
- Parking: Circular driveway; 1 covered carport space; 1 total parking space
- Utilities: Public water; Public sewer; Natural gas available and connected; Water connected; Sewer connected
- Home design: Single family residence; One-story
- Construction: Brick construction
- Exterior features: Metal roof; Storage structure on the property; Asphalt road frontage; Publicly maintained road; Highway frontage
Interior
- Kitchen: Electric range; Refrigerator
- Bedrooms: 3 bedrooms on the main level
- Flooring: Carpet; Laminate
- Bathrooms: 2 full bathrooms on the main level
- Interior features: Electric range; Refrigerator; Laundry room
- Laundry & utility: Dedicated laundry room
Neighborhood map
What this means for you Summary
Snapshot
- This is a 3-bed/2.0-bath single-family listed at $155k.
Deal economics
- At list price, monthly cash flow is $39 ($472/yr) — positive.
- The deal already cash-flows at list — no discount required.
- To meet the 1% rule (rent ≥ 1% of price), the offer needs to be $123k (20.5% below list).
- Recommended offer: $123k (20.5% below list) — sets the bar for 1% rule.
Location & tenants
- Location reads 59/100 on livability (#288 in TN) — a working-class tenant base; expect higher turnover. Strengths: cost of living A+, housing A-; Watch: health & safety C-, crime F, amenities F.
- Decatur County (rural): math 45% / reading 33% proficiency, ranked #19 of 139 in TN (top 14%) — families likely to look elsewhere, expect single-tenant / working-renter base with shorter leases.
- Zoned schools: Parsons Elementary (math 52% / reading 47%, grade D, #119 of 952 statewide, top 14%, 376 students, 0% FRL); Decatur County Middle School (math 48% / reading 28%, grade F, #51 of 333 statewide, top 16%, 426 students, 0% FRL); Riverside High School (math 27% / reading 27%, grade F, #104 of 332 statewide, top 33%, 460 students, 0% FRL) — zoned schools average 0% FRL vs 50% district-wide (50 pts lower); this property's tenant base skews higher-income than the district average.
- Market conditions: 90 active listings in the ZIP; 10 units permitted in Decatur County in 2024 (0 in 5+ unit buildings).
Forward outlook
- In year one you build about $17k of equity ($1k loan paydown + $16k appreciation (10.0% local appreciation)).
- Decatur County population projected at -16% by 2050 — secular population decline; favor cash flow + early exit over multi-decade hold.
- At projected returns (10.0% appreciation + 3.0% rent growth), your $43k cash investment doubles in ~3 years — after that, you're playing with house money.
- By year 3, paydown + projected appreciation supports a ~$42k cash-out refi (75% LTV) — recoverable capital for the next deal without selling this one.
Negotiation context
- It's been on market 86 days — a 6% lower offer ($146k) is reasonable based on typical stale-listing flexibility.
Risks & watch-outs
- Watch-outs: built in 1958 — expect roof / HVAC / electrical / plumbing capex.
- Climate carrying-cost: moderate wildfire risk; extreme-heat days projected 7→21/yr by 2055 (HVAC capex compounding) — expect insurance premiums to compound above CPI over the hold.
Questions for the listing agent
- It's been on market 86 days. Have you received any prior offers? Is the seller open to a 21% concession, seller financing, or rate buy-down credit?
- Built in 1958 — when were the roof, HVAC, electrical panel, plumbing, and water heater last replaced?
- Why hasn't it sold? Are there any deal-killer items the seller is aware of (foundation, flood, title, zoning, code violations)?
- Is there a deadline driving the sale (1031 exchange, divorce, estate, relocation)? That informs how much negotiation room exists.
- Schools are F-rated, which usually means shorter tenancies and higher turnover. Who's the typical renter profile here, and what's been the actual vacancy rate?
- Crime grade is F in this area — have there been break-ins, vandalism, or insurance claims at this property in the last 3 years? What carrier currently insures it and at what premium?
- What's the average days-on-market for RENTAL listings here right now (not sales)? A rising rental-DOM trend means longer vacancies and softer asking-rent achievability than the comps imply.
- What's the recent tenant-quality profile in this submarket — average credit score on applications, eviction rate, late-payment / NSF rate, and stable-employment percentage? A property-management company in the area should have these aggregated.
- How much new for-sale + rental construction is in the pipeline within 1–3 miles? Heavy new supply typically softens prices + rents 12–24 months out; constrained supply supports both.
Investment metrics
- 1% rule
- 0.79% ✗
- Cap rate
- 6.60%
- Cash-on-cash
- 1.09%
- DSCR
- 1.05
- GRM
- 10.5
CMA / ARV
No comps found within radius.
Projected returns pro-forma
10.0% appreciation · 3.0% rent growth · sell at horizon
- IRR
- 25.0%
- Equity multiple
- 3.00×
- Total profit
- $86,857
- Equity at exit
- $139,636
- IRR
- 22.1%
- Equity multiple
- 6.85×
- Total profit
- $253,679
- Equity at exit
- $301,131
Cash invested: $43,400 (down + closing). Projections, not guarantees.
Landlord ↔ Tenant lean methodology
- Overall (STATE)
- 87 Strongly Landlord-Friendly
- State Tennessee
- 87 Strongly Landlord-Friendly · R+13
- County
- — inherits STATE
- City
- — inherits STATE
ZIP-level market 38363
- Home prices YoY
- 9.8%
- Active inventory
- 90
- Price-to-rent
- 10.5×
Monthly cashflow live
- Estimated rent
- $1,232 medium interval (Pro) →
- Mortgage (P&I)
- −$813
- Tax from tax record
- −$56 /mo · $678/yr
- Insurance
- −$65
- HOA
- −$0
- Vacancy / Maint / Mgmt
- −$259
- Net cashflow
- $39
Break-even live
Sensitivity live
| Price | -10% $127 | -5% $83 | +0% $39 | +5% $-5 | +10% $-48 |
|---|---|---|---|---|---|
| Rent | -10% $-58 | -5% $-9 | +0% $39 | +5% $88 | +10% $137 |
| Rate | -1.0pp $117 | -0.5pp $79 | base $39 | +0.5pp $-1 | +1.0pp $-42 |
UW: 25.0% down · 7.5% · 30yr · 1.5% tax · 5.0% vac · 8.0% maint · 8.0% mgmt
Financing live
Cash to close
- Down payment
- $38,750
- Closing costs
- $4,650
- Reserves months
- —
- Total cash needed
- —
Loan-product check · same deal, 3 products live
Conventional
25% down · 7.5% · 30yr
- Down + closing
- —
- Monthly P&I
- —
- Monthly cashflow
- —
- DSCR
- —
- Eligible?
- —
Personal DTI + credit; lowest rate.
DSCR
20% down · 8.5% · 30yr
- Down + closing
- —
- Monthly P&I
- —
- Monthly cashflow
- —
- DSCR
- —
- Eligible?
- —
No personal income docs; deal must DSCR.
Hard money
10% down · 12.0% · 12mo
- Down + closing
- —
- Monthly P&I
- —
- Monthly cashflow
- —
- DSCR
- —
- Eligible?
- —
Short-term bridge; refi at stabilization.
Listing history 21 events
-
2026-06-21days on market $155,000 Active 86 DOM
-
2026-06-21days on market $155,000 Active 85 DOM
-
2026-06-18days on market $155,000 Active 83 DOM
-
2026-06-17days on market $155,000 Active 82 DOM
-
2026-06-16days on market $155,000 Active 81 DOM
-
2026-06-15days on market $155,000 Active 80 DOM
-
2026-06-13days on market $155,000 Active 78 DOM
-
2026-06-12days on market $155,000 Active 77 DOM
-
2026-06-09days on market $155,000 Active 74 DOM
-
2026-06-08days on market $155,000 Active 73 DOM
-
2026-06-08days on market $155,000 Active 72 DOM
-
2026-06-07days on market $155,000 Active 71 DOM
-
2026-06-03days on market $155,000 Active 68 DOM
-
2026-06-02days on market $155,000 Active 67 DOM
-
2026-06-01days on market $155,000 Active 66 DOM
-
2026-05-31days on market $155,000 Active 65 DOM
-
2026-03-27$155,000 Active
-
2025-12-03price $220,000
-
2025-12-03price $220,000
-
2025-08-15price $225,000
-
2025-08-15price $225,000
ⓘ Source: listings_history table (triggers on properties + properties_extension) + one-shot
backfill from property_details.listing_events for pre-trigger history.
Tax reassessment forecast TN · Resets to sale price
- Current annual tax
- $678 · $56/mo
- Projected year-2 tax
- $1,100 · $92/mo
- Expected delta
- +$422/yr (+$35/mo · 62.3%)
ⓘ Screening estimate from a state-policy table — verify with the county assessor before closing.
Climate risk First Street
- Flood 1/10 Low FEMA zone X (unshaded) · 0% chance over 30 yrs
- Wildfire 5/10 Major
- Heat 6/10 Major 7 d/yr ≥108°F today · 21 d/yr by 30 yrs out
- Wind 4/10 Moderate 15% chance of damaging wind over 30 yrs
- Air quality 1/10 Low 0 unhealthy d/yr today · 0 by 30 yrs out
Nearby sold comps map
Loading sold comps map…
Walkable amenities ~0.75 mi
Loading nearby amenities…
Taxation est. · year 1
- Rental income
- $14,784
- − Mortgage interest
- −$8,682
- − Property taxes
- −$678
- − Insurance
- −$775
- − Repairs & maintenance
- −$1,183
- − Management
- −$1,183
- − Depreciation
- −$4,509
- Taxable loss
- −$2,226
- Est. tax savings @ 24.0%
- +$534
- After-tax cash flow
- $1,006/yr
For passive investors: Depreciation is non-cash, so a rental often shows a tax loss while cash-flowing — sheltering income. Rental losses are passive: they offset passive income freely, and up to $25,000/yr can offset ordinary (W-2) income if you actively participate and your MAGI is under $100k (phasing out to $0 by $150k); unused losses carry forward. On sale, claimed depreciation is recaptured at up to 25%, and gains may owe capital-gains tax (a 1031 exchange can defer both). Figures are a year-1 estimate at your 24.0% rate — not tax advice; consult a CPA.
Schools (NCES district)
- District
- Decatur County
- NCES district ID
- 4700960
- Math proficiency
- 45% ▼ -5.00%
- Reading proficiency
- 33% ▬ 0.00%
- Median HH income
- $34,877
- Composite
- 32.28/100
- National rank
- #5756
- State rank
- #19 of 139 in TN
Livability — Parsons
- Score
- 59/100
- State rank
- #288
- US rank
- #20310
Category grades
Schools grade is shown separately in the Schools card above.
Census & demographics
- Census place
- Parsons, TN
- City population
- 5,600
- Population (ZIP)
- 5,600
Population outlook (Decatur County) Hauer SSP2
- Today (2025)
- 11,311 people
- By 2030
- 10,995 · -2.8%
- By 2040
- 10,268 · -9.2%
- By 2050
- 9,512 · -15.9%
- By 2075
- 7,988 · -29.4%
- By 2100
- 6,639 · -41.3%
Race, ethnicity, and origin ACS 2023
- Neighborhood character
- Predominantly White (90%)
- Race & ethnicity
- White 90% Black 5% Hispanic / Latino 3% Two or more races 2% Asian 2%
- Common ancestry
- Slovak 2% Italian 1% Portuguese 1%
- Foreign-born
- 2%
- Languages at home
- 97% English-only · Other Indo-European 1% Spanish 1%
Political lean MEDSL · Decatur
- 2024 margin
- Solid R (+69.1) · D 15.0% · R 84.1%
- 2008→2024 swing
- -36.9pp toward R · 2008: -32.2pp · 2024: -69.1pp
- All cycles
- 2024: R+69.1 2020: R+63.4 2016: R+58.7 2012: R+37.0 2008: R+32.2
Not yet ingested
- Civics
- —
Market trends
- HPI YoY
- ▲ 27.34%
- Current HPI
- 305.7717
- Rent YoY
- —
- Metro
- —
- State GDP YoY
- ▲ 2.78%
- F500 in state
- 22
Industry mix (Fortune 500 HQ in TN)
| Industry | F500 HQs | Revenue |
|---|---|---|
| Healthcare | 3 | $91B |
|
||
| Retail | 3 | $72B |
|
||
| Transportation / Logistics | 1 | $88B |
|
||
| Paper / Packaging | 1 | $19B |
|
||
| Insurance | 1 | $13B |
|
||
| Energy | 1 | $12B |
|
||
Price history
-31.1% since first listed5 events — show timeline
- 2026-03-27 Listed $155,000 CWTAR
- 2025-12-03 Price Changed $220,000 REALTRACS as Distributed by MLS Grid
- 2025-12-03 Price Changed $220,000 CWTAR
- 2025-08-15 Price Changed $225,000 REALTRACS as Distributed by MLS Grid
- 2025-08-15 Price Changed $225,000 CWTAR
Property tax history
+3.6%/yrLatest (2025): $678 · +19.4% YoY. Source: county tax records.
Cash-flow waterfall
monthlySold comps — $/sqft
last 12 mo · ≤1 miLoading sold comps…