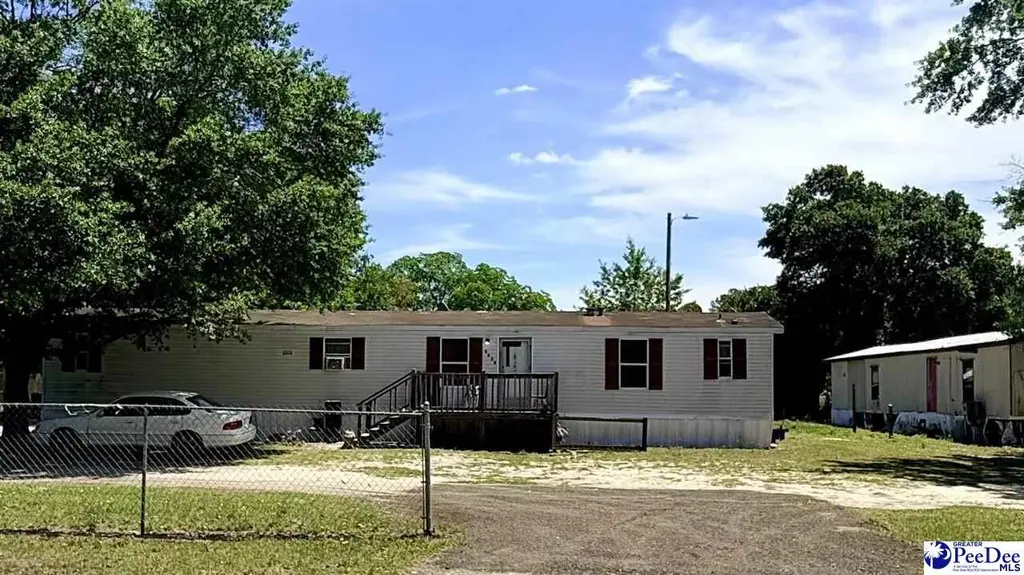
2028 Oakland Rd · Little Rock, SC
Flood risk 1/10 · Minimal
- FEMA flood zone
- X (unshaded)
- Chance of flooding over 30 yrs
- 0.0%
- Est. flood insurance / yr
- $507 – $1,088
Fire risk 6/10 · Moderate
- Est. fire insurance / yr
- $783 – $1,453
Heat risk 8/10 · Major
- Hot days now (above 107°F)
- 7 days/yr
- Hot days in 30 yrs
- 17 days/yr
Wind risk 8/10 · Major
- Chance of severe wind over 30 yrs
- 80.0%
Air-quality risk 1/10 · Minimal
- Unhealthy air days now
- 0 days/yr
- Unhealthy air days in 30 yrs
- 0 days/yr
Risk factors via First Street. Map © Google.
Why this score? — see what drove the D- grade
The composite is a weighted blend of 9 inputs, each scored 0–100. Each bar is that input's sub-score; the figure is the points it added to the 100-point composite (weight × sub-score).
- Cash flow +9.2/30.0
- Appreciation +8.0/10.0
- ARV discount +7.5/15.0
- DSCR +2.6/10.0
- Rent growth +2.5/5.0
- Livability +2.5/5.0
- Condition / age +2.5/5.0
- 1% rule +1.6/10.0
- Schools +1.6/10.0
$119,000
🖨 Deal sheet (PDF) 📄 Offer letter ✓ Due diligence
Listing remarks
This versatile . 78-acre property at 2028 Oakland Road in Hamer, SC offers a great rural living opportunity or investment, featuring a single-wide mobile home site, abundant yard space, and easy access to local thoroughfares like I-95 and Highway 301. Generous Acreage expansive . 78-acre lot offering plenty of room for gardens, outdoor recreation, or expansion. Excellent Location situated in the peaceful Hamer area, just minutes from the South Carolina-North Carolina border. Convenient commuting and quick, easy access to Interstate 95 makes travel to nearby Florence, SC, or Fayetteville, NC, a breeze.
Key facts
- Expansive lot
- Generous acreage
- Abundant yard space
Tags
Property features AI
Exterior
- Home design: Mobile home (residential); Single-family style; Above-grade living area: 1,008
- Construction: Vinyl siding
- Exterior features: Fenced yard
Interior
- Kitchen: Range
- Flooring: Vinyl
- Bathrooms: 1 full bathroom
- Heating & cooling: Central heating; Central air; Ceiling fan(s)
- Interior features: Range; Vinyl flooring; Crawl space basement
Neighborhood map
What this means for you Summary
Snapshot
- This is a 3-bed/1.0-bath manufactured listed at $119k.
Deal economics
- At list price, monthly cash flow is $-89 ($-1k/yr) — negative.
- To cash-flow at today's rent, offer at most $103k (13.2% below list).
- To meet the 1% rule (rent ≥ 1% of price), the offer needs to be $79k (33.9% below list).
- Recommended offer: $79k (33.9% below list) — sets the bar for 1% rule.
Location & tenants
- Location reads: area grade D — affects rentability + tenant quality, not the cash-flow math above.
- Dillon 04 (town): math 14% / reading 27% proficiency, ranked #72 of 80 in SC (top 90%) — low school quality limits family demand, transient renter base, plan for 1-2y turnover; 83% free/reduced lunch — lower-income household profile, screen leases tightly.
- Zoned schools: Dillon Middle (math 10% / reading 22%, grade F, #196 of 229 statewide, top 87%, 666 students, 100% FRL); Dillon High (math 12% / reading 67%, grade F, #180 of 196 statewide, top 93%, 869 students, 100% FRL) — zoned schools average 100% FRL vs 83% district-wide (17 pts higher); higher-poverty schools than district average — tighter screening recommended.
- Market conditions: 18 active listings in the ZIP; 41 units permitted in Dillon County in 2024 (0 in 5+ unit buildings).
Forward outlook
- In year one you build about $8k of equity ($823 loan paydown + $7k appreciation (6.0% local appreciation)).
- Dillon County population projected at -25% by 2050 — secular population decline; favor cash flow + early exit over multi-decade hold.
- By year 5, paydown + projected appreciation supports a ~$35k cash-out refi (75% LTV) — recoverable capital for the next deal without selling this one.
Negotiation context
- It's been on market 20 days — a 2% lower offer ($117k) is reasonable based on typical stale-listing flexibility.
- Current owner paid $55k; list at $119k implies a 116% gain — meaningful room to come down on a strong offer.
Risks & watch-outs
- Climate carrying-cost: severe wind risk, 80% chance of damaging wind over 30y; major wildfire risk; extreme-heat days projected 7→17/yr by 2055 (HVAC capex compounding) — expect insurance premiums to compound above CPI over the hold.
Questions for the listing agent
- What do current leases actually rent for vs. the listed asking? Can we see a recent rent roll and the last 12 months of T-12 income?
- Is there a deadline driving the sale (1031 exchange, divorce, estate, relocation)? That informs how much negotiation room exists.
- The area grade is low — what's the realistic commute time and amenity access for the typical tenant pool here? Any planned neighborhood developments (good or bad) we should know about?
- What's the average days-on-market for RENTAL listings here right now (not sales)? A rising rental-DOM trend means longer vacancies and softer asking-rent achievability than the comps imply.
- What's the recent tenant-quality profile in this submarket — average credit score on applications, eviction rate, late-payment / NSF rate, and stable-employment percentage? A property-management company in the area should have these aggregated.
- How much new for-sale + rental construction is in the pipeline within 1–3 miles? Heavy new supply typically softens prices + rents 12–24 months out; constrained supply supports both.
Investment metrics
- 1% rule
- 0.66% ✗
- Cap rate
- 5.39%
- Cash-on-cash
- -3.21%
- DSCR
- 0.86
- GRM
- 12.6
CMA / ARV
No comps found within radius.
Projected returns pro-forma
6.0% appreciation · 3.0% rent growth · sell at horizon
- IRR
- 12.7%
- Equity multiple
- 1.86×
- Total profit
- $28,628
- Equity at exit
- $74,820
- IRR
- 13.4%
- Equity multiple
- 3.66×
- Total profit
- $88,538
- Equity at exit
- $135,693
Cash invested: $33,320 (down + closing). Projections, not guarantees.
Landlord ↔ Tenant lean methodology
- Overall (STATE)
- 90 Strongly Landlord-Friendly
- State South Carolina
- 90 Strongly Landlord-Friendly · R+6
- County
- — inherits STATE
- City
- — inherits STATE
ZIP-level market 29547
- Home prices YoY
- 6.7%
- Active inventory
- 18
- Price-to-rent
- 12.6×
Monthly cashflow live
- Estimated rent
- $786 medium interval (Pro) →
- Mortgage (P&I)
- −$624
- Tax from tax record
- −$37 /mo · $441/yr
- Insurance
- −$50
- HOA
- −$0
- Lot rent leased land?
- −$0
- Vacancy / Maint / Mgmt
- −$165
- Net cashflow
- $-89
Break-even live
Sensitivity live
| Price | -10% $-22 | -5% $-56 | +0% $-89 | +5% $-123 | +10% $-157 |
|---|---|---|---|---|---|
| Rent | -10% $-151 | -5% $-120 | +0% $-89 | +5% $-58 | +10% $-27 |
| Rate | -1.0pp $-29 | -0.5pp $-59 | base $-89 | +0.5pp $-120 | +1.0pp $-151 |
UW: 25.0% down · 7.5% · 30yr · 1.5% tax · 5.0% vac · 8.0% maint · 8.0% mgmt
Financing live
Cash to close
- Down payment
- $29,750
- Closing costs
- $3,570
- Reserves months
- —
- Total cash needed
- —
Loan-product check · same deal, 3 products live
Conventional
25% down · 7.5% · 30yr
- Down + closing
- —
- Monthly P&I
- —
- Monthly cashflow
- —
- DSCR
- —
- Eligible?
- —
Personal DTI + credit; lowest rate.
DSCR
20% down · 8.5% · 30yr
- Down + closing
- —
- Monthly P&I
- —
- Monthly cashflow
- —
- DSCR
- —
- Eligible?
- —
No personal income docs; deal must DSCR.
Hard money
10% down · 12.0% · 12mo
- Down + closing
- —
- Monthly P&I
- —
- Monthly cashflow
- —
- DSCR
- —
- Eligible?
- —
Short-term bridge; refi at stabilization.
Listing history 15 events
-
2026-06-22days on market $119,000 Active 20 DOM
-
2026-06-21days on market $119,000 Active 19 DOM
-
2026-06-21days on market $119,000 Active 18 DOM
-
2026-06-18days on market $119,000 Active 16 DOM
-
2026-06-17days on market $119,000 Active 15 DOM
-
2026-06-16days on market $119,000 Active 14 DOM
-
2026-06-15days on market $119,000 Active 13 DOM
-
2026-06-13days on market $119,000 Active 11 DOM
-
2026-06-12days on market $119,000 Active 10 DOM
-
2026-06-09days on market $119,000 Active 7 DOM
-
2026-06-08days on market $119,000 Active 6 DOM
-
2026-06-08days on market $119,000 Active 5 DOM
-
2026-06-07pricedays on market $119,000 Active 4 DOM
-
2026-06-03remarks 608-char remark
-
2026-06-03$199,000 Active 1 DOM
ⓘ Source: listings_history table (triggers on properties + properties_extension) + one-shot
backfill from property_details.listing_events for pre-trigger history.
Tax reassessment forecast SC · Resets to sale price
- Current annual tax
- $441 · $37/mo
- Projected year-2 tax
- $678 · $57/mo
- Expected delta
- +$237/yr (+$20/mo · 53.7%)
ⓘ Screening estimate from a state-policy table — verify with the county assessor before closing.
Climate risk First Street
- Flood 1/10 Low FEMA zone X (unshaded) · 0% chance over 30 yrs
- Wildfire 6/10 Major
- Heat 8/10 Severe 7 d/yr ≥107°F today · 17 d/yr by 30 yrs out
- Wind 8/10 Severe 80% chance of damaging wind over 30 yrs
- Air quality 1/10 Low 0 unhealthy d/yr today · 0 by 30 yrs out
Nearby sold comps map
Loading sold comps map…
Walkable amenities ~0.75 mi
Loading nearby amenities…
Taxation est. · year 1
- Rental income
- $9,435
- − Mortgage interest
- −$6,666
- − Property taxes
- −$441
- − Insurance
- −$595
- − Repairs & maintenance
- −$755
- − Management
- −$755
- − Depreciation
- −$3,462
- Taxable loss
- −$3,238
- Est. tax savings @ 24.0%
- +$777
- After-tax cash flow
- $-294/yr
For passive investors: Depreciation is non-cash, so a rental often shows a tax loss while cash-flowing — sheltering income. Rental losses are passive: they offset passive income freely, and up to $25,000/yr can offset ordinary (W-2) income if you actively participate and your MAGI is under $100k (phasing out to $0 by $150k); unused losses carry forward. On sale, claimed depreciation is recaptured at up to 25%, and gains may owe capital-gains tax (a 1031 exchange can defer both). Figures are a year-1 estimate at your 24.0% rate — not tax advice; consult a CPA.
Schools (NCES district)
- District
- Dillon 04
- NCES district ID
- 4501920
- Math proficiency
- 14% ▼ -15.00%
- Reading proficiency
- 27% ▼ -9.00%
- Median HH income
- $27,820
- Composite
- 16.16/100
- National rank
- #9230
- State rank
- #72 of 80 in SC
Livability — Little Rock
No livability data for this city. (Only ~50 U.S. cities are tracked.)
Census & demographics
- Population (ZIP)
- 2,552
Population outlook (Dillon County) Hauer SSP2
- Today (2025)
- 29,087 people
- By 2030
- 27,713 · -4.7%
- By 2040
- 24,772 · -14.8%
- By 2050
- 21,836 · -24.9%
- By 2075
- 15,165 · -47.9%
- By 2100
- 9,849 · -66.1%
Race, ethnicity, and origin ACS 2023
- Neighborhood character
- Diverse neighborhood (Simpson 0.63)
- Race & ethnicity
- White 52% Black 32% Native American 8% Hispanic / Latino 6% Two or more races 3%
- Hispanic origin (detail)
- Mexican 2%
- Common ancestry
- Slovak 5% Serbian 1%
- Foreign-born
- 2% · Canada
- Languages at home
- 95% English-only · Spanish 5%
Political lean MEDSL · Dillon
- 2024 margin
- R (+10.8) · D 44.2% · R 55.0%
- 2008→2024 swing
- -22.3pp toward R · 2008: 11.4pp · 2024: -10.8pp
- All cycles
- 2024: R+10.8 2020: R+1.1 2016: D+1.7 2012: D+16.3 2008: D+11.4
Not yet ingested
- Civics
- —
Market trends
- HPI YoY
- ▲ 6.00%
- Current HPI
- 96.1832
- Rent YoY
- —
- Metro
- —
- State GDP YoY
- ▲ 4.51%
- F500 in state
- 2
Industry mix (Fortune 500 HQ in SC)
| Industry | F500 HQs | Revenue |
|---|---|---|
| Packaging | 1 | $7B |
|
||
Price history
+1226.7% since first listed3 events — show timeline
- 2026-06-02 Listed $199,000 RAGPD
- 2016-07-11 Sold (Public Records) $55,000 Public Records
- 2013-04-29 Sold (Public Records) $15,000 Public Records
Property tax history
+11.9%/yrLatest (2025): $441 · +2.2% YoY. Source: county tax records.
Cash-flow waterfall
monthlySold comps — $/sqft
last 12 mo · ≤1 miLoading sold comps…