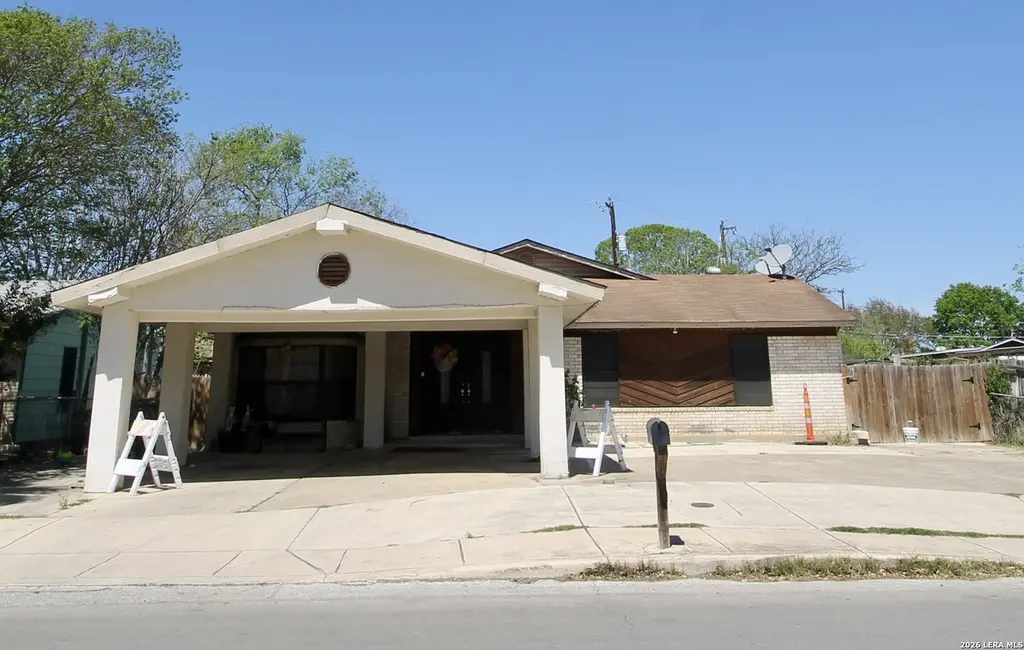
3507 Fairmeadows · San Antonio, TX
Flood risk 1/10 · Minimal
- FEMA flood zone
- X (unshaded)
- Chance of flooding over 30 yrs
- 0.0%
- Est. flood insurance / yr
- $507 – $1,088
Fire risk 4/10 · Minor
- Est. fire insurance / yr
- $1,222 – $2,270
Heat risk 8/10 · Major
- Hot days now (above 109°F)
- 7 days/yr
- Hot days in 30 yrs
- 23 days/yr
Wind risk 8/10 · Major
- Chance of severe wind over 30 yrs
- 80.0%
Air-quality risk 2/10 · Minimal
- Unhealthy air days now
- 0 days/yr
- Unhealthy air days in 30 yrs
- 1 days/yr
Risk factors via First Street. Map © Google.
Why this score? — see what drove the C+ grade
The composite is a weighted blend of 9 inputs, each scored 0–100. Each bar is that input's sub-score; the figure is the points it added to the 100-point composite (weight × sub-score).
- Cash flow +17.6/30.0
- ARV discount +15.0/15.0
- 1% rule +7.7/10.0
- DSCR +5.5/10.0
- Appreciation +4.8/10.0
- Livability +4.0/5.0
- Rent growth +2.5/5.0
- Condition / age +2.5/5.0
- Schools +1.4/10.0
$149,000
🖨 Deal sheet (PDF) 📄 Offer letter ✓ Due diligence
Listing remarks MLS
An excellent investment opportunity. With a little TLC this solid house instantly becomes a home and instantly produces income. Measuring in at 2421 square feet the home includes the following: *4 bedrooms* 3 full baths*Formal living room* Separate family room with vaulted ceilings measures 13 x 29* All bedrooms measure larger than average* The oversized covered patio easily fits 2-3 cars with additional parking space* Backyard also has a huge covered patio* 1 minute to I-35 and 410. * Close proximity to schools, shopping and restaurants*Minutes A&M University.
Key facts
- Second living room
- Easy access to i-35
- 7,535 sq ft lot
Tags
Neighborhood map
What this means for you Summary
Snapshot
- This is a 4-bed/2.0-bath single-family listed at $149k.
Deal economics
- At list price, monthly cash flow is $116 ($1k/yr) — positive.
- The deal already cash-flows at list — no discount required.
- Meets the 1% rule at list price ($2k rent vs $149k).
- Recommended offer: $140k (6.0% below list) — sets the bar for market timing.
- Cap rate 7.2% vs local median 3.8% in San Antonio — top-decile yield for the area; either an underpriced asset or a hidden risk that comps aren't pricing in. Stress-test before assuming the spread holds.
Location & tenants
- Location reads 80/100 on livability (#31 in TX, #1,616 nationally) — a professional / high-income tenant draw. Strengths: amenities A+, commute A+, cost of living A+; Watch: crime F.
- South San Antonio ISD (urban): math 13% / reading 20% proficiency, ranked #804 of 826 in TX (top 97%) — low school quality limits family demand, transient renter base, plan for 1-2y turnover.
- Zoned schools: Palo Alto El (math 12% / reading 17%, grade F, #4,048 of 4,322 statewide, top 95%, 429 students, 95% FRL); South San Antonio H S (math 27% / reading 32%, grade F, #1,112 of 1,632 statewide, top 70%, 1,786 students, 93% FRL) — zoned schools average 94% FRL vs 42% district-wide (52 pts higher); higher-poverty schools than district average — tighter screening recommended.
- Market conditions: 162 active listings in the ZIP; 12 comparable units currently listed for rent nearby; rentals at typical pace (median 19d on market — plan ~3-4 weeks tenant-placement turnaround); 8,308 units permitted in Bexar County in 2024 (2,506 in 5+ unit buildings).
- This rent runs 41% of the median local income ($55k/yr) — at the standard rent-burdened threshold; future hikes will face affordability resistance.
Forward outlook
- In year one you build about $361 of equity ($1k loan paydown + $-669 appreciation (-0.5% local appreciation)).
- Bexar County population projected at +50% by 2050 — long-run rental-demand tailwind backs the buy-and-hold thesis.
Negotiation context
- It's been on market 89 days — a 6% lower offer ($140k) is reasonable based on typical stale-listing flexibility.
- 3 sale attempts since 8y ago; this cycle's ask has dropped $40k (21%) from the opening price — seller is motivated, your offer sets the floor, not the list.
Risks & watch-outs
- Watch-outs: property tax is 4.3% of price.
- Climate carrying-cost: severe wind risk, 80% chance of damaging wind over 30y; extreme-heat days projected 7→23/yr by 2055 (HVAC capex compounding) — expect insurance premiums to compound above CPI over the hold.
Questions for the listing agent
- It's been on market 89 days. Have you received any prior offers? Is the seller open to a 6% concession, seller financing, or rate buy-down credit?
- Built in 1970 — when were the roof, HVAC, electrical panel, plumbing, and water heater last replaced?
- Property tax is high relative to price — has the assessment been appealed recently, and will the sale trigger a re-assessment?
- Why hasn't it sold? Are there any deal-killer items the seller is aware of (foundation, flood, title, zoning, code violations)?
- Is there a deadline driving the sale (1031 exchange, divorce, estate, relocation)? That informs how much negotiation room exists.
- Crime grade is F in this area — have there been break-ins, vandalism, or insurance claims at this property in the last 3 years? What carrier currently insures it and at what premium?
- What's the average days-on-market for RENTAL listings here right now (not sales)? A rising rental-DOM trend means longer vacancies and softer asking-rent achievability than the comps imply.
- What's the recent tenant-quality profile in this submarket — average credit score on applications, eviction rate, late-payment / NSF rate, and stable-employment percentage? A property-management company in the area should have these aggregated.
- How much new for-sale + rental construction is in the pipeline within 1–3 miles? Heavy new supply typically softens prices + rents 12–24 months out; constrained supply supports both.
Investment metrics
- 1% rule
- 1.27% ✓
- Cap rate
- 7.23%
- Cash-on-cash
- 3.35%
- DSCR
- 1.15
- GRM
- 6.5
CMA / ARV
- ARV (median comp)
- $210,011
- List price
- $149,000
- Delta
- -29.05%
- Verdict
- UNDERPRICED
- Comps
- 20 within 1.0 mi
Show comp detail 12 sales within ~0.75 mi
| Address | Dist | Beds/Ba | Sqft | Sold | Price | $/sf | Match |
|---|---|---|---|---|---|---|---|
| 9318 Graze Land Dr | 0.64mi | 4/2.5 | 2,125 (-12%) | 3mo | $282,990 | $133 | 45 |
| 9302 Graze Land Dr | 0.60mi | 4/2.5 | 2,125 (-12%) | 8mo | $289,990 | $136 | 42 |
| 9419 Trap Rock Dr | 0.69mi | 4/2.5 | 2,126 (-12%) | 5mo | $270,000 | $127 | 41 |
| 9310 Graze Land Dr | 0.61mi | 4/2.5 | 2,093 (-14%) | 7mo | $269,990 | $129 | 41 |
| 9322 Graze Br | 0.64mi | 4/2.5 | 2,125 (-12%) | 9mo | $279,990 | $132 | 40 |
| 3922 Somerset Shade | 0.74mi | 4/2.5 | 2,194 (-9%) | 11mo | $289,990 | $132 | 39 |
| 3938 Somerset Shade | 0.75mi | 4/2.5 | 2,194 (-9%) | 14mo | $299,990 | $137 | 36 |
| 9322 Graze Land | 0.64mi | 4/2.5 | 2,093 (-14%) | 12mo | $279,990 | $134 | 36 |
| 3930 Somerset Shade | 0.75mi | 4/2.5 | 2,125 (-12%) | 10mo | $289,990 | $136 | 35 |
| 9427 Graze Land Dr | 0.73mi | 4/2.5 | 2,125 (-12%) | 11mo | $279,990 | $132 | 35 |
| 3926 Somerset Shade | 0.74mi | 4/2.5 | 2,093 (-14%) | 8mo | $279,990 | $134 | 34 |
| 9415 Graze Land | 0.70mi | 4/2.5 | 2,093 (-14%) | 11mo | $279,990 | $134 | 33 |
Match score weights: distance 35% · size 25% · config 20% · recency 20%. Top-matched comps best support the ARV.
Projected returns pro-forma
-0.45% appreciation · 3.0% rent growth · sell at horizon
- IRR
- 0.1%
- Equity multiple
- 1.00×
- Total profit
- $182
- Equity at exit
- $39,949
- IRR
- 6.2%
- Equity multiple
- 1.64×
- Total profit
- $26,796
- Equity at exit
- $45,449
Cash invested: $41,720 (down + closing). Projections, not guarantees.
Landlord ↔ Tenant lean methodology
- Overall (STATE)
- 87 Strongly Landlord-Friendly
- State Texas
- 87 Strongly Landlord-Friendly · R+5
- County
- — inherits STATE
- City
- — inherits STATE
ZIP-level market 78211
- Home prices YoY
- -0.2%
- Active inventory
- 162
- Price-to-rent
- 6.5×
Monthly cashflow live
- Estimated rent
- $1,897 high interval (Pro) →
- Mortgage (P&I)
- −$781
- Tax from tax record
- −$539 /mo · $6,465/yr
- Insurance
- −$62
- HOA
- −$0
- Vacancy / Maint / Mgmt
- −$398
- Net cashflow
- $116
Break-even live
Sensitivity live
| Price | -10% $201 | -5% $159 | +0% $116 | +5% $74 | +10% $32 |
|---|---|---|---|---|---|
| Rent | -10% $-33 | -5% $41 | +0% $116 | +5% $191 | +10% $266 |
| Rate | -1.0pp $191 | -0.5pp $154 | base $116 | +0.5pp $78 | +1.0pp $38 |
UW: 25.0% down · 7.5% · 30yr · 1.5% tax · 5.0% vac · 8.0% maint · 8.0% mgmt
Financing live
Cash to close
- Down payment
- $37,250
- Closing costs
- $4,470
- Reserves months
- —
- Total cash needed
- —
Loan-product check · same deal, 3 products live
Conventional
25% down · 7.5% · 30yr
- Down + closing
- —
- Monthly P&I
- —
- Monthly cashflow
- —
- DSCR
- —
- Eligible?
- —
Personal DTI + credit; lowest rate.
DSCR
20% down · 8.5% · 30yr
- Down + closing
- —
- Monthly P&I
- —
- Monthly cashflow
- —
- DSCR
- —
- Eligible?
- —
No personal income docs; deal must DSCR.
Hard money
10% down · 12.0% · 12mo
- Down + closing
- —
- Monthly P&I
- —
- Monthly cashflow
- —
- DSCR
- —
- Eligible?
- —
Short-term bridge; refi at stabilization.
Rent comps 12 comps
| Address | Beds | Baths | Sqft | Rent | $/sqft | DOM | Units | Dist |
|---|---|---|---|---|---|---|---|---|
| 3910 Poteet Pl San Antonio, TX | 4.0 | 2.0 | 1880 | $1,525 | $0.81 | 45d | 1 | 0.51mi |
| 3903 Kurz Plz S San Antonio, TX | 4.0 | 2.0 | 1627 | $2,000 | $1.23 | 0d | 1 | 0.52mi |
| 9419 Trap Rock Dr San Antonio, TX | 4.0 | 2.5 | 2126 | $1,750 | $0.82 | 6d | 1 | 0.70mi |
| 9427 Somers Bnd San Antonio, TX | 3.0 | 2.5 | 1950 | $1,650 | $0.85 | 45d | 1 | 0.72mi |
| 3331 Rosita Way San Antonio, TX | 3.0 | 2.5 | 1848 | $1,800 | $0.97 | 45d | 1 | 1.21mi |
| 2219 Sundrop Bay San Antonio, TX | 4.0 | 2.5 | 2496 | $2,850 | $1.14 | 5d | 1 | 1.21mi |
| 3434 Hacienda Way San Antonio, TX | 4.0 | 2.5 | 2141 | $2,000 | $0.93 | 24d | 1 | 1.30mi |
| 3434 Hacienda Way San Antonio, TX | 4.0 | 2.5 | 2141 | $1,900 | $0.89 | 18d | 1 | 1.30mi |
| 2115 Sundrop Bay San Antonio, TX | 4.0 | 2.5 | 2314 | $1,915 | $0.83 | 0d | 1 | 1.32mi |
| 10119 Jardin Verde San Antonio, TX | 3.0 | 2.5 | 1944 | $1,750 | $0.90 | 45d | 1 | 1.35mi |
| 3523 Rancho Grande San Antonio, TX | 4.0 | 3.0 | 2393 | $2,000 | $0.84 | 0d | 1 | 1.36mi |
| 3322 Rancho Grande San Antonio, TX | 4.0 | 2.5 | 2094 | $1,895 | $0.90 | 13d | 1 | 1.41mi |
Listing history 23 events
-
2026-06-21days on market $149,000 Active 89 DOM
-
2026-06-18days on market $149,000 Active 86 DOM
-
2026-06-17days on market $149,000 Active 85 DOM
-
2026-06-16days on market $149,000 Active 84 DOM
-
2026-06-15days on market $149,000 Active 83 DOM
-
2026-06-13days on market $149,000 Active 81 DOM
-
2026-06-09days on market $149,000 Active 77 DOM
-
2026-06-08days on market $149,000 Active 76 DOM
-
2026-06-07days on market $149,000 Active 75 DOM
-
2026-06-04days on market $149,000 Active 72 DOM
-
2026-06-03days on market $149,000 Active 71 DOM
-
2026-06-02days on market $149,000 Active 70 DOM
-
2026-06-01days on market $149,000 Active 69 DOM
-
2026-05-31days on market $149,000 Active 68 DOM
-
2026-05-12price $149,000 572-char remark
Show marketing remark (572 chars)
An excellent investment opportunity. With a little TLC this solid house instantly becomes a home and instantly produces income. Measuring in at 2421 square feet the home includes the following: *4 bedrooms* 3 full baths*Formal living room* Separate family room with vaulted ceilings measures 13 x 29* All bedrooms measure larger than average* The oversized covered patio easily fits 2-3 cars with additional parking space* Backyard also has a huge covered patio* 1 minute to I-35 and 410. * Close proximity to schools, shopping and restaurants*Minutes A&M University.
-
2026-03-24$189,000 New 572-char remark
Show marketing remark (572 chars)
An excellent investment opportunity. With a little TLC this solid house instantly becomes a home and instantly produces income. Measuring in at 2421 square feet the home includes the following: *4 bedrooms* 3 full baths*Formal living room* Separate family room with vaulted ceilings measures 13 x 29* All bedrooms measure larger than average* The oversized covered patio easily fits 2-3 cars with additional parking space* Backyard also has a huge covered patio* 1 minute to I-35 and 410. * Close proximity to schools, shopping and restaurants*Minutes A&M University.
-
2018-10-30historical
-
2018-10-25historical Active Option
-
2018-10-14status Back on Market
-
2018-10-05historical Active Option
-
2018-10-02price $130,000
-
2018-06-03$140,000 New
-
1981-06-01soldstatus
ⓘ Source: listings_history table (triggers on properties + properties_extension) + one-shot
backfill from property_details.listing_events for pre-trigger history.
Tax reassessment forecast TX · Resets to sale price
- Current annual tax
- $6,465 · $539/mo
- Projected year-2 tax
- $6,465 · $539/mo
- Expected delta
- $0/yr ($0/mo · 0.0%)
ⓘ Screening estimate from a state-policy table — verify with the county assessor before closing.
Climate risk First Street
- Flood 1/10 Low FEMA zone X (unshaded) · 0% chance over 30 yrs
- Wildfire 4/10 Moderate
- Heat 8/10 Severe 7 d/yr ≥109°F today · 23 d/yr by 30 yrs out
- Wind 8/10 Severe 80% chance of damaging wind over 30 yrs
- Air quality 2/10 Low 0 unhealthy d/yr today · 1 by 30 yrs out
Nearby sold comps map
Loading sold comps map…
Walkable amenities ~0.75 mi
Loading nearby amenities…
Taxation est. · year 1
- Rental income
- $22,763
- − Mortgage interest
- −$8,346
- − Property taxes
- −$6,465
- − Insurance
- −$745
- − Repairs & maintenance
- −$1,821
- − Management
- −$1,821
- − Depreciation
- −$4,335
- Taxable loss
- −$770
- Est. tax savings @ 24.0%
- +$185
- After-tax cash flow
- $1,581/yr
For passive investors: Depreciation is non-cash, so a rental often shows a tax loss while cash-flowing — sheltering income. Rental losses are passive: they offset passive income freely, and up to $25,000/yr can offset ordinary (W-2) income if you actively participate and your MAGI is under $100k (phasing out to $0 by $150k); unused losses carry forward. On sale, claimed depreciation is recaptured at up to 25%, and gains may owe capital-gains tax (a 1031 exchange can defer both). Figures are a year-1 estimate at your 24.0% rate — not tax advice; consult a CPA.
Schools (NCES district)
- District
- South San Antonio ISD
- NCES district ID
- 4840680
- Math proficiency
- 13% ▼ -20.00%
- Reading proficiency
- 20% ▼ -10.00%
- Median HH income
- $35,460
- Composite
- 13.6/100
- National rank
- #9511
- State rank
- #804 of 826 in TX
Livability — San Antonio
- Score
- 80/100
- State rank
- #31
- US rank
- #1616
Category grades
Schools grade is shown separately in the Schools card above.
Census & demographics
- Census place
- San Antonio, TX
- County
- Bexar County · 1,990,555 people
- City population
- 1,806,925
- Metro
- San Antonio-New Braunfels, TX
- Population (ZIP)
- 30,857
- Household income
- $55,436
- Rent vs Own
- Severe rent burden
- 729.0
Population outlook (Bexar County) Hauer SSP2
- Today (2025)
- 2,336,851 people
- By 2030
- 2,560,728 · +9.6%
- By 2040
- 3,020,569 · +29.3%
- By 2050
- 3,493,522 · +49.5%
- By 2075
- 4,668,459 · +99.8%
- By 2100
- 5,533,242 · +136.8%
Race, ethnicity, and origin ACS 2023
- Neighborhood character
- Predominantly Hispanic (93%)
- Race & ethnicity
- Hispanic / Latino 93% Two or more races 30% White 5% Black 1% Native American 1%
- Hispanic origin (detail)
- Mexican 76%
- Foreign-born
- 18% · Canada
- Languages at home
- 35% English-only · Spanish 65%
Political lean MEDSL · Bexar
- 2024 margin
- Lean D (+9.8) · D 54.3% · R 44.6% · Other 1.1%
- 2008→2024 swing
- +4.2pp toward D · 2008: 5.6pp · 2024: 9.8pp
- All cycles
- 2024: D+9.8 2020: D+18.2 2016: D+13.5 2012: D+4.6 2008: D+5.6
Not yet ingested
- Civics
- —
Market trends
- HPI YoY
- ▼ -0.45%
- Current HPI
- 241.1709
- Rent YoY
- —
- Metro
- San Antonio-New Braunfels, TX
- State GDP YoY
- ▲ 3.95%
- F500 in state
- 110
Industry mix (Fortune 500 HQ in TX)
| Industry | F500 HQs | Revenue |
|---|---|---|
| Energy | 16 | $1,198B |
|
||
| Technology | 5 | $198B |
|
||
| Engineering / Construction | 4 | $72B |
|
||
| Energy Services | 3 | $60B |
|
||
| Utilities | 3 | $41B |
|
||
| Healthcare | 2 | $330B |
|
||
Price history
+6.4% since first listed9 events — show timeline
- 2026-05-12 Price Changed $149,000 LERA
- 2026-03-24 Listed $189,000 LERA
- 2018-10-30 Listing Removed — LERA
- 2018-10-25 Contingent — LERA
- 2018-10-14 Relisted — LERA
- 2018-10-05 Contingent — LERA
- 2018-10-02 Price Changed $130,000 LERA
- 2018-06-03 Listed $140,000 LERA
- 1981-06-01 Sold (Public Records) — Public Records
Property tax history
+7.1%/yrLatest (2025): $6,465 · +10.0% YoY. Source: county tax records.
Cash-flow waterfall
monthlySold comps — $/sqft
last 12 mo · ≤1 miLoading sold comps…