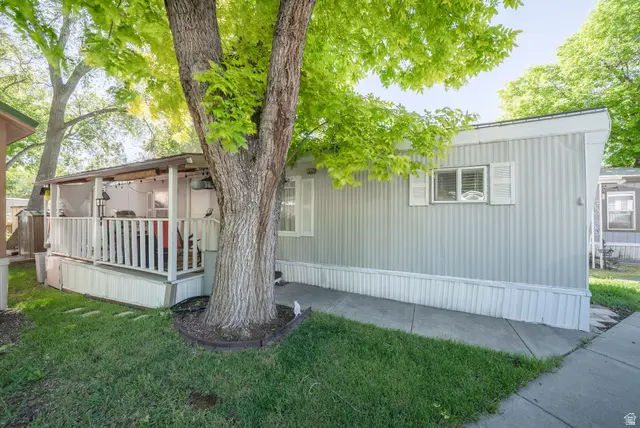
240 E 1100 N Unit D2 · North Salt Lake, UT
Flood risk 1/10 · Minimal
- FEMA flood zone
- X (unshaded)
- Chance of flooding over 30 yrs
- 0.0%
- Est. flood insurance / yr
- $507 – $1,088
Fire risk 2/10 · Minimal
- Est. fire insurance / yr
- $453 – $841
Heat risk 4/10 · Minor
- Hot days now (above 93°F)
- 8 days/yr
- Hot days in 30 yrs
- 21 days/yr
Wind risk 1/10 · Minimal
- Chance of severe wind over 30 yrs
- —
Air-quality risk 5/10 · Moderate
- Unhealthy air days now
- 7 days/yr
- Unhealthy air days in 30 yrs
- 8 days/yr
Risk factors via First Street. Map © Google.
Why this score? — see what drove the B grade
The composite is a weighted blend of 9 inputs, each scored 0–100. Each bar is that input's sub-score; the figure is the points it added to the 100-point composite (weight × sub-score).
- Cash flow +29.3/30.0
- 1% rule +10.0/10.0
- DSCR +10.0/10.0
- ARV discount +7.5/15.0
- Rent growth +4.1/5.0
- Schools +4.1/10.0
- Livability +3.8/5.0
- Condition / age +3.8/5.0
- Appreciation +0.0/10.0
$39,900
🖨 Deal sheet (PDF) 📄 Offer letter ✓ Due diligence
Listing remarks
Recently updated mobile home featuring approximately $4,500 in improvements! Upgrades include new skirting, updated plumbing for the toilet, shower, and sinks, plus a filtered water system and bidet in the bathroom. Exterior enhancements include new sod, added stairs off the main porch, and an awning/covered porch off the second entrance for additional outdoor living space. Storage has been thoughtfully expanded with two access doors leading to under-patio storage, an added metal shed with pad, and an extended pad for the existing shed. Move-in ready with functional updates and added convenience throughout!
Key facts
- Added stairs
- New sod
- Bidet in bathroom
Tags
Property features AI
Finance
- HOA & community: Part of Colonial Woods Park II homeowners association; Monthly association fee; Association fee includes water; Association amenities include a playground and water
Exterior
- Parking: Uncovered open parking
- Utilities: Natural gas connected; Electricity connected; Water connected; Sewer connected
- Home design: Mobile home; Flat roof; Property is built and standing; Residential use
- Construction: Aluminum exterior; Built and standing construction
- Exterior features: Open porch; Sidewalks on the lot
Interior
- Kitchen: Built-in range/oven; Microwave; Refrigerator; Granite countertops
- Bedrooms: 2 main-level bedrooms
- Flooring: Laminate flooring; Tile flooring
- Bathrooms: 1 full bathroom
- Heating & cooling: Gas central heating; Central air conditioning
- Interior features: Built-in range/oven; Granite countertops; Blinds and drapes
- Laundry & utility: Washer and dryer included
Neighborhood map
What this means for you Summary
Snapshot
- This is a 2-bed/1.0-bath manufactured listed at $40k. Condition is rated good.
Deal economics
- At list price, monthly cash flow is $141 ($2k/yr) — positive.
- The deal already cash-flows at list — no discount required.
- Meets the 1% rule at list price ($2k rent vs $40k).
- Recommended offer: $39k (3.0% below list) — sets the bar for market timing.
Location & tenants
- Location reads 76/100 on livability (#57 in UT, #3,560 nationally) — a middle-class / working-renter tenant base. Strengths: crime A+, commute A+, employment A+; Watch: cost of living D, amenities F, health & safety F.
- Davis District (suburban): math 43% / reading 47% proficiency, ranked #28 of 80 in UT (top 35%) — families likely to look elsewhere, expect single-tenant / working-renter base with shorter leases; only 19% free/reduced lunch — higher-income household profile.
- Zoned schools: Woods Cross School (math 39% / reading 43%, grade F, #315 of 585 statewide, top 55%, 496 students, 24% FRL); South Davis Jr High (math 31% / reading 37%, grade F, #97 of 138 statewide, top 70%, 1,095 students, 25% FRL); Woods Cross High (math 36% / reading 47%, grade F, #57 of 171 statewide, top 34%, 1,567 students, 16% FRL) — zoned schools at 21% FRL track the district average.
- Market conditions: Rents rising fast (+6.5%/yr); 148 active listings in the ZIP; 6 comparable units currently listed for rent nearby; rentals at typical pace (median 17d on market — plan ~3-4 weeks tenant-placement turnaround); solid renter incomes; 1,461 units permitted in Davis County in 2024 (508 in 5+ unit buildings).
Forward outlook
- Local home prices are declining (-3.0%/yr); year-one equity from $276 of loan paydown is wiped out by about $1k of value loss. Plan a longer hold.
- Davis County population projected at +39% by 2050 — long-run rental-demand tailwind backs the buy-and-hold thesis.
- At projected returns (-3.0% appreciation + 6.5% rent growth), your $11k cash investment doubles in ~5 years — after that, you're playing with house money.
Negotiation context
- It's been on market 31 days — a 3% lower offer ($39k) is reasonable based on typical stale-listing flexibility.
Risks & watch-outs
- Watch-outs: HOA is 53% of rent.
Questions for the listing agent
- It's been on market 31 days. Have you received any prior offers? Is the seller open to a 3% concession, seller financing, or rate buy-down credit?
- Built in 1965 — when were the roof, HVAC, electrical panel, plumbing, and water heater last replaced?
- What does the HOA fee cover, when was the last increase, and are there any pending special assessments or reserve-fund shortfalls?
- Is there a deadline driving the sale (1031 exchange, divorce, estate, relocation)? That informs how much negotiation room exists.
- What's the average days-on-market for RENTAL listings here right now (not sales)? A rising rental-DOM trend means longer vacancies and softer asking-rent achievability than the comps imply.
- What's the recent tenant-quality profile in this submarket — average credit score on applications, eviction rate, late-payment / NSF rate, and stable-employment percentage? A property-management company in the area should have these aggregated.
- How much new for-sale + rental construction is in the pipeline within 1–3 miles? Heavy new supply typically softens prices + rents 12–24 months out; constrained supply supports both.
Investment metrics
- 1% rule
- 3.97% ✓
- Cap rate
- 10.53%
- Cash-on-cash
- 15.13%
- DSCR
- 1.67
- GRM
- 2.1
CMA / ARV
No comps found within radius.
Projected returns pro-forma
-3.0% appreciation · 6.46% rent growth · sell at horizon
- IRR
- 17.2%
- Equity multiple
- 1.78×
- Total profit
- $8,748
- Equity at exit
- $5,949
- IRR
- 31.5%
- Equity multiple
- 5.16×
- Total profit
- $46,495
- Equity at exit
- $3,450
Cash invested: $11,172 (down + closing). Projections, not guarantees.
Landlord ↔ Tenant lean methodology
- Overall (STATE)
- 86 Strongly Landlord-Friendly
- State Utah
- 86 Strongly Landlord-Friendly · R+15
- County
- — inherits STATE
- City
- — inherits STATE
ZIP-level market 84054
- Rents YoY
- 6.5%
- Active inventory
- 148
- Price-to-rent
- 2.1×
Monthly cashflow live
- Estimated rent
- $1,584 high interval (Pro) →
- Mortgage (P&I)
- −$209
- Tax est. 1.5%
- −$50 /mo · $598/yr
- Insurance
- −$17
- HOA
- −$835
- Vacancy / Maint / Mgmt
- −$333
- Net cashflow
- $141
Break-even live
Sensitivity live
| Price | -10% $168 | -5% $155 | +0% $141 | +5% $127 | +10% $113 |
|---|---|---|---|---|---|
| Rent | -10% $16 | -5% $78 | +0% $141 | +5% $203 | +10% $266 |
| Rate | -1.0pp $161 | -0.5pp $151 | base $141 | +0.5pp $130 | +1.0pp $120 |
UW: 25.0% down · 7.5% · 30yr · 1.5% tax · 5.0% vac · 8.0% maint · 8.0% mgmt
Financing live
Cash to close
- Down payment
- $9,975
- Closing costs
- $1,197
- Reserves months
- —
- Total cash needed
- —
Loan-product check · same deal, 3 products live
Conventional
25% down · 7.5% · 30yr
- Down + closing
- —
- Monthly P&I
- —
- Monthly cashflow
- —
- DSCR
- —
- Eligible?
- —
Personal DTI + credit; lowest rate.
DSCR
20% down · 8.5% · 30yr
- Down + closing
- —
- Monthly P&I
- —
- Monthly cashflow
- —
- DSCR
- —
- Eligible?
- —
No personal income docs; deal must DSCR.
Hard money
10% down · 12.0% · 12mo
- Down + closing
- —
- Monthly P&I
- —
- Monthly cashflow
- —
- DSCR
- —
- Eligible?
- —
Short-term bridge; refi at stabilization.
Rent comps 6 comps
| Address | Beds | Baths | Sqft | Rent | $/sqft | DOM | Units | Dist |
|---|---|---|---|---|---|---|---|---|
| 850 North Highway 89 North Salt Lake, UT | 1.0–2.0 | 1.0–2.0 | 774 | $1,470 | $1.90 | 16d | 4 | 0.47mi |
| 2030 S Main St Bountiful, UT | 1.0–2.0 | 1.0–2.0 | 825 | $1,700 | $2.06 | 15d | 13 | 0.91mi |
| 2720 S Orchard Dr Unit 2702 Bountiful, UT | 1.0 | 1.0 | 750 | $991 | $1.32 | 25d | 1 | 0.97mi |
| 2720 S Orchard Dr North Salt Lake, UT | 1.0–2.0 | 1.0 | 860 | $1,287 | $1.50 | 16d | 2 | 1.16mi |
| 1230 S 500 W Bountiful, UT | 1.0–2.0 | 1.0–2.0 | 828 | $1,525 | $1.84 | 16d | 11 | 1.35mi |
| 1509 Renaissance Towne Dr Bountiful, UT | 1.0–2.0 | 1.0–2.0 | 903 | $1,749 | $1.94 | 23d | 3 | 1.37mi |
HOA detail
- Monthly dues
- $835 · $10,020/yr
- Likely covers
- water
Listing history 18 events
-
2026-06-21days on market $39,900 Active 31 DOM
-
2026-06-18days on market $39,900 Active 28 DOM
-
2026-06-17days on market $39,900 Active 27 DOM
-
2026-06-16days on market $39,900 Active 26 DOM
-
2026-06-15pricedays on market $39,900 Active 25 DOM
-
2026-06-14days on market $45,000 Active 23 DOM
-
2026-06-13days on market $45,000 Active 22 DOM
-
2026-06-10days on market $45,000 Active 20 DOM
-
2026-06-09days on market $45,000 Active 19 DOM
-
2026-06-08days on market $45,000 Active 18 DOM
-
2026-06-07days on market $45,000 Active 17 DOM
-
2026-06-05days on market $45,000 Active 14 DOM
-
2026-06-03days on market $45,000 Active 13 DOM
-
2026-06-02days on market $45,000 Active 12 DOM
-
2026-06-01days on market $45,000 Active 11 DOM
-
2026-05-31pricedays on market $45,000 Active 10 DOM
-
2026-05-31days on market $48,500 Active 9 DOM
-
2026-05-21$48,500 Active
ⓘ Source: listings_history table (triggers on properties + properties_extension) + one-shot
backfill from property_details.listing_events for pre-trigger history.
Climate risk First Street
- Flood 1/10 Low FEMA zone X (unshaded) · 0% chance over 30 yrs
- Wildfire 2/10 Low
- Heat 4/10 Moderate 8 d/yr ≥93°F today · 21 d/yr by 30 yrs out
- Wind 1/10 Low
- Air quality 5/10 Major 7 unhealthy d/yr today · 8 by 30 yrs out
Nearby sold comps map
Loading sold comps map…
Walkable amenities ~0.75 mi
Loading nearby amenities…
Taxation est. · year 1
- Rental income
- $19,011
- − Mortgage interest
- −$2,235
- − Property taxes
- −$598
- − Insurance
- −$200
- − Repairs & maintenance
- −$1,521
- − Management
- −$1,521
- − HOA
- −$10,020
- − Depreciation
- −$1,161
- Taxable income
- $1,756
- Est. tax owed @ 24.0%
- −$421
- After-tax cash flow
- $1,269/yr
For passive investors: Depreciation is non-cash, so a rental often shows a tax loss while cash-flowing — sheltering income. Rental losses are passive: they offset passive income freely, and up to $25,000/yr can offset ordinary (W-2) income if you actively participate and your MAGI is under $100k (phasing out to $0 by $150k); unused losses carry forward. On sale, claimed depreciation is recaptured at up to 25%, and gains may owe capital-gains tax (a 1031 exchange can defer both). Figures are a year-1 estimate at your 24.0% rate — not tax advice; consult a CPA.
Condition & rehab AI · 1 photo
This recently updated mobile home is in good condition with cosmetic improvements and is move-in ready. It offers a good starting point for further enhancements to boost its value.
Value-add opportunities
- Both Painting the exterior — Enhances curb appeal and can increase both resale and rental value
- Both Landscaping improvements — Enhances curb appeal and can increase both resale and rental value
Renovation cost estimate screening
Value-add ROI direction
- Both Painting the exterior — Enhances curb appeal and can increase both resale and rental value ↑
- Both Landscaping improvements — Enhances curb appeal and can increase both resale and rental value ↑
ⓘ Cost ranges are severity-bucket heuristics (US national rule-of-thumb). Get contractor quotes + a written scope before underwriting a rehab budget.
Schools (NCES district)
- District
- Davis District
- NCES district ID
- 4900210
- Math proficiency
- 43% ▼ -9.00%
- Reading proficiency
- 47% ▼ -5.00%
- Median HH income
- $70,511
- Composite
- 40.59/100
- National rank
- #3698
- State rank
- #28 of 80 in UT
Livability — North Salt Lake
- Score
- 76/100
- State rank
- #57
- US rank
- #3560
Category grades
Schools grade is shown separately in the Schools card above.
Census & demographics
- Census place
- North Salt Lake, UT
- County
- Davis County · 341,755 people
- City population
- 22,355
- Metro
- Ogden-Clearfield, UT
- Population (ZIP)
- 22,355
- Household income
- $101,860
- Rent vs Own
- Severe rent burden
- 426.0
Population outlook (Davis County) Hauer SSP2
- Today (2025)
- 399,271 people
- By 2030
- 430,528 · +7.8%
- By 2040
- 493,485 · +23.6%
- By 2050
- 555,187 · +39.1%
- By 2075
- 688,589 · +72.5%
- By 2100
- 769,646 · +92.8%
Race, ethnicity, and origin ACS 2023
- Neighborhood character
- Predominantly White (71%)
- Race & ethnicity
- White 71% Hispanic / Latino 18% Two or more races 13% Asian 4%
- Hispanic origin (detail)
- Mexican 12%
- Common ancestry
- Iranian 3% Slovak 3% Italian 2%
- Foreign-born
- 13% · Canada
- Languages at home
- 80% English-only · Spanish 11% Other Indo-European 4% Other Asian/Pacific 3%
Political lean MEDSL · Davis
- 2024 margin
- Strong R (+24.9) · D 36.0% · R 60.8% · Other 3.2%
- 2008→2024 swing
- +17.4pp toward D · 2008: -42.3pp · 2024: -24.9pp
- All cycles
- 2024: R+24.9 2020: R+27.5 2016: R+23.3 2012: R+61.8 2008: R+42.3
Not yet ingested
- Civics
- —
Market trends
- HPI YoY
- ▼ -341.91%
- Current HPI
- 275.9596
- Rent YoY
- ▲ 6.46%
- Metro
- Ogden-Clearfield, UT
- State GDP YoY
- ▲ 3.54%
- F500 in state
- 2
Industry mix (Fortune 500 HQ in UT)
| Industry | F500 HQs | Revenue |
|---|---|---|
| Financial Services | 1 | $3B |
|
||
Price history
-17.7% since first listed3 events — show timeline
- 2026-06-14 Price Changed $39,900 WFRMLS
- 2026-05-31 Price Changed $45,000 WFRMLS
- 2026-05-21 Listed $48,500 WFRMLS
Cash-flow waterfall
monthlySold comps — $/sqft
last 12 mo · ≤1 miLoading sold comps…