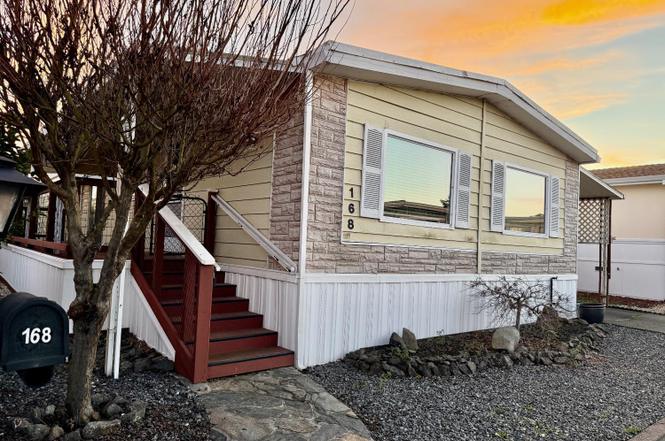
168 Shoreham Way · Santa Rosa, CA
Flood risk 6/10 · Moderate
- FEMA flood zone
- X (unshaded)
- Chance of flooding over 30 yrs
- 0.72%
- Est. flood insurance / yr
- $507 – $1,088
Fire risk 1/10 · Minimal
- Est. fire insurance / yr
- $659 – $1,223
Heat risk 4/10 · Minor
- Hot days now (above 90°F)
- 7 days/yr
- Hot days in 30 yrs
- 16 days/yr
Wind risk 1/10 · Minimal
- Chance of severe wind over 30 yrs
- —
Air-quality risk 9/10 · Severe
- Unhealthy air days now
- 19 days/yr
- Unhealthy air days in 30 yrs
- 19 days/yr
Risk factors via First Street. Map © Google.
Why this score? — see what drove the B grade
The composite is a weighted blend of 9 inputs, each scored 0–100. Each bar is that input's sub-score; the figure is the points it added to the 100-point composite (weight × sub-score).
- Cash flow +30.0/30.0
- ARV discount +12.7/15.0
- DSCR +10.0/10.0
- 1% rule +9.7/10.0
- Livability +3.8/5.0
- Schools +3.7/10.0
- Condition / age +2.8/5.0
- Rent growth +2.2/5.0
- Appreciation +0.0/10.0
$152,000
🖨 Deal sheet (PDF) 📄 Offer letter ✓ Due diligence
Listing remarks
Welcome to The Country, a well-established 55+ mobile home community known for its welcoming atmosphere and beautifully maintained, park-like setting. Offering approximately 1,536 square feet of living space, this spacious two-bedroom, two-bath home presents a wonderful opportunity to move right in and add your personal taste while enjoying a highly desirable location within the park. The floor plan is generous and thoughtfully laid out, featuring both a formal living room and a separate family roomproviding flexibility for entertaining, hobbies, or simply relaxing in your own space. The kitchen is a standout in size and function, offering abundant cabinet storage, stainless steel appliance
Key facts
- Open design
- Park like setting
- Formal living room
Tags
Property features AI
Finance
- Financial info
- Monthly land lease payment
- HOA & community
- No HOALocated in a senior communityLocated in The Country park
Exterior
- Parking
- Attached covered parking with interior access2 parking spaces
- Utilities
- Cable availableInternet availablePublic sewer
- Home design
- Manufactured home in a parkDouble-wideMadison model/manufacturerAluminum skirting
- Construction
- Aluminum skirt
- Exterior features
- Covered deck/patioCarport awningShed(s)Close to clubhouseLandscaped
Interior
- Kitchen
- DishwasherFree-standing gas rangeFree-standing refrigeratorMicrowaveBreakfast areaLaminate countertops
- Bedrooms
- 2 bedrooms
- Flooring
- CarpetLinoleumSimulated wood
- Bathrooms
- 2 full bathroomsBathtubShower stallTub with shower over
- Heating & cooling
- Central heatingCentral air conditioning
- Interior features
- Great room living areaDining and living room combinedDeck attached to family room
- Laundry & utility
- Indoor laundry room
Neighborhood map
What this means for you Summary
Snapshot
- This is a 2-bed/2.0-bath manufactured listed at $152k. Condition is rated average.
Deal economics
- At list price, monthly cash flow is $709 ($9k/yr) — positive.
- The deal already cash-flows at list — no discount required.
- Meets the 1% rule at list price ($2k rent vs $152k).
- Recommended offer: $134k (12.0% below list) — sets the bar for market timing.
- Cap rate 11.9% vs local median 2.5% in Santa Rosa — top-decile yield for the area; either an underpriced asset or a hidden risk that comps aren't pricing in. Stress-test before assuming the spread holds.
Location & tenants
- Location reads 75/100 on livability (#112 in CA, #3,940 nationally) — a middle-class / working-renter tenant base. Strengths: amenities A+, commute A+, employment A+; Watch: cost of living F.
- Santa Rosa High (urban): math 31% / reading 47% proficiency, ranked #703 of 1,400 in CA (top 50%) — families likely to look elsewhere, expect single-tenant / working-renter base with shorter leases.
- Zoned schools: Albert F. Biella Elementary (215 students, 72% FRL); Hilliard Comstock Middle (434 students, 60% FRL); Piner High (1,361 students, 51% FRL) — zoned schools average 61% FRL vs 22% district-wide (39 pts higher); higher-poverty schools than district average — tighter screening recommended.
- Market conditions: Rents soft (-1.4%/yr); 85 active listings in the ZIP; 4 comparable units currently listed for rent nearby; rentals at typical pace (median 25d on market — plan ~3-4 weeks tenant-placement turnaround); solid renter incomes; 1,039 units permitted in Sonoma County in 2024 (185 in 5+ unit buildings).
Forward outlook
- Local home prices are declining (-3.0%/yr); year-one equity from $1k of loan paydown is wiped out by about $5k of value loss. Plan a longer hold.
- Sonoma County population projected at +8% by 2050 — modest demand growth; plan on rents tracking national, not racing it.
- At projected returns (-3.0% appreciation + 0.0% rent growth), your $43k cash investment doubles in ~8 years — after that, you're playing with house money.
Negotiation context
- It's been on market 130 days — a 12% lower offer ($134k) is reasonable based on typical stale-listing flexibility.
Risks & watch-outs
- Climate carrying-cost: major flood risk — expect insurance premiums to compound above CPI over the hold.
Questions for the listing agent
- It's been on market 130 days. Have you received any prior offers? Is the seller open to a 12% concession, seller financing, or rate buy-down credit?
- Built in 1978 — when were the roof, HVAC, electrical panel, plumbing, and water heater last replaced?
- Why hasn't it sold? Are there any deal-killer items the seller is aware of (foundation, flood, title, zoning, code violations)?
- Is there a deadline driving the sale (1031 exchange, divorce, estate, relocation)? That informs how much negotiation room exists.
- What's the average days-on-market for RENTAL listings here right now (not sales)? A rising rental-DOM trend means longer vacancies and softer asking-rent achievability than the comps imply.
- What's the recent tenant-quality profile in this submarket — average credit score on applications, eviction rate, late-payment / NSF rate, and stable-employment percentage? A property-management company in the area should have these aggregated.
- How much new for-sale + rental construction is in the pipeline within 1–3 miles? Heavy new supply typically softens prices + rents 12–24 months out; constrained supply supports both.
Investment metrics
- 1% rule
- 1.47% ✓
- Cap rate
- 11.89%
- Cash-on-cash
- 20.00%
- DSCR
- 1.89
- GRM
- 5.7
CMA / ARV
- ARV (on-the-fly)
- $172,032
- Comps found
- 12
Show comp detail 12 sales within ~0.75 mi
| Address | Dist | Beds/Ba | Sqft | Sold | Price | $/sf | Match |
|---|---|---|---|---|---|---|---|
| 127 Salisbury Cir | 0.16mi | 2/2.0 | 1,536 (0%) | 4mo | $75,000 | $49 | 89 |
| 155 Shoreham Way | 0.02mi | 3/2.0 (+1) | 1,528 (-0%) | 9mo | $285,000 | $187 | 86 |
| 88 Norfolk Dr | 0.08mi | 3/2.0 (+1) | 1,560 (+2%) | 10mo | $285,000 | $183 | 80 |
| 83 Somerset Dr | 0.08mi | 2/2.0 | 1,440 (-6%) | 8mo | $152,500 | $106 | 79 |
| 81 Somerset Dr | 0.09mi | 2/2.0 | 1,440 (-6%) | 10mo | $110,000 | $76 | 77 |
| 32 Yorkshire Dr | 0.04mi | 3/2.0 (+1) | 1,400 (-9%) | 2mo | $250,000 | $179 | 76 |
| 145 Stratford Way | 0.08mi | 2/2.0 | 1,344 (-12%) | 4mo | $129,000 | $96 | 72 |
| 186 Sequoia Cir | 0.31mi | 2/2.0 | 1,368 (-11%) | 2mo | $150,000 | $110 | 66 |
| 176 Sequoia Cir | 0.36mi | 2/2.0 | 1,440 (-6%) | 9mo | $160,000 | $111 | 65 |
| 98 Sequoia Cir | 0.28mi | 2/2.0 | 1,344 (-12%) | 2mo | $215,000 | $160 | 65 |
| 139 Sequoia Cir | 0.41mi | 2/2.0 | 1,440 (-6%) | 10mo | $180,000 | $125 | 62 |
| 16 Sequoia Cir | 0.24mi | 2/2.0 | 1,344 (-12%) | 10mo | $150,000 | $112 | 60 |
Match score weights: distance 35% · size 25% · config 20% · recency 20%. Top-matched comps best support the ARV.
Projected returns pro-forma
-3.0% appreciation · 0.0% rent growth · sell at horizon
- IRR
- 8.7%
- Equity multiple
- 1.33×
- Total profit
- $14,056
- Equity at exit
- $22,664
- IRR
- 15.2%
- Equity multiple
- 2.06×
- Total profit
- $45,325
- Equity at exit
- $13,142
Cash invested: $42,560 (down + closing). Projections, not guarantees.
Landlord ↔ Tenant lean methodology
- Overall (STATE)
- 18 Strongly Tenant-Friendly
- State California
- 18 Strongly Tenant-Friendly · D+13
- County
- — inherits STATE
- City
- — inherits STATE
ZIP-level market 95401
- Rents YoY
- -1.4%
- Active inventory
- 85
- Price-to-rent
- 5.7×
Monthly cashflow live
- Estimated rent
- $2,228 medium interval (Pro) →
- Mortgage (P&I)
- −$797
- Tax est. 1.5%
- −$190 /mo · $2,280/yr
- Insurance
- −$63
- HOA
- −$0
- Lot rent leased land?
- −$0
- Vacancy / Maint / Mgmt
- −$468
- Net cashflow
- $709
Break-even live
Sensitivity live
| Price | -10% $814 | -5% $762 | +0% $709 | +5% $657 | +10% $604 |
|---|---|---|---|---|---|
| Rent | -10% $533 | -5% $621 | +0% $709 | +5% $797 | +10% $885 |
| Rate | -1.0pp $786 | -0.5pp $748 | base $709 | +0.5pp $670 | +1.0pp $630 |
UW: 25.0% down · 7.5% · 30yr · 1.5% tax · 5.0% vac · 8.0% maint · 8.0% mgmt
Financing live
Cash to close
- Down payment
- $38,000
- Closing costs
- $4,560
- Reserves months
- —
- Total cash needed
- —
Loan-product check · same deal, 3 products live
Conventional
25% down · 7.5% · 30yr
- Down + closing
- —
- Monthly P&I
- —
- Monthly cashflow
- —
- DSCR
- —
- Eligible?
- —
Personal DTI + credit; lowest rate.
DSCR
20% down · 8.5% · 30yr
- Down + closing
- —
- Monthly P&I
- —
- Monthly cashflow
- —
- DSCR
- —
- Eligible?
- —
No personal income docs; deal must DSCR.
Hard money
10% down · 12.0% · 12mo
- Down + closing
- —
- Monthly P&I
- —
- Monthly cashflow
- —
- DSCR
- —
- Eligible?
- —
Short-term bridge; refi at stabilization.
Rent comps 4 comps
| Address | Beds | Baths | Sqft | Rent | $/sqft | DOM | Units | Dist |
|---|---|---|---|---|---|---|---|---|
| 2135 Pebblewood Ct Santa Rosa, CA | 3.0 | 2.0 | 1340 | $3,400 | $2.54 | 17d | 1 | 0.73mi |
| 1118 Dale Ct Santa Rosa, CA | 3.0 | 2.0 | 1276 | $2,495 | $1.96 | 24d | 1 | 1.12mi |
| 1316 New York Dr Unit NA Santa Rosa, CA | 3.0 | 3.0 | 2200 | $4,000 | $1.82 | 24d | 1 | 1.30mi |
| 960 Doubles Dr Santa Rosa, CA | 2.0–3.0 | 1.0–2.5 | 1038 | $2,399 | $2.31 | 16d | 3 | 1.48mi |
Listing history 20 events
-
2026-06-23days on market $152,000 Active 130 DOM
-
2026-06-21days on market $152,000 Active 129 DOM
-
2026-06-18days on market $152,000 Active 126 DOM
-
2026-06-17days on market $152,000 Active 125 DOM
-
2026-06-16days on market $152,000 Active 124 DOM
-
2026-06-15days on market $152,000 Active 123 DOM
-
2026-06-14days on market $152,000 Active 121 DOM
-
2026-06-13statusdays on market $152,000 Active 120 DOM
-
2026-06-10days on market $152,000 Contingent (Show) 118 DOM
-
2026-06-09days on market $152,000 Contingent (Show) 117 DOM
-
2026-06-08days on market $152,000 Contingent (Show) 116 DOM
-
2026-06-07days on market $152,000 Contingent (Show) 115 DOM
-
2026-06-05statusdays on market $152,000 Contingent (Show) 112 DOM
-
2026-06-03days on market $152,000 Active 111 DOM
-
2026-06-02days on market $152,000 Active 110 DOM
-
2026-06-01days on market $152,000 Active 109 DOM
-
2026-05-31days on market $152,000 Active 108 DOM
-
2026-05-30days on market $152,000 Active 107 DOM
-
2026-04-30price $152,000
-
2026-02-10$159,000 Active
ⓘ Source: listings_history table (triggers on properties + properties_extension) + one-shot
backfill from property_details.listing_events for pre-trigger history.
Climate risk First Street
- Flood 6/10 Major FEMA zone X (unshaded) · 72% chance over 30 yrs
- Wildfire 1/10 Low
- Heat 4/10 Moderate 7 d/yr ≥90°F today · 16 d/yr by 30 yrs out
- Wind 1/10 Low
- Air quality 9/10 Extreme 19 unhealthy d/yr today · 19 by 30 yrs out
Nearby sold comps map
Loading sold comps map…
Walkable amenities ~0.75 mi
Loading nearby amenities…
Taxation est. · year 1
- Rental income
- $26,732
- − Mortgage interest
- −$8,514
- − Property taxes
- −$2,280
- − Insurance
- −$760
- − Repairs & maintenance
- −$2,139
- − Management
- −$2,139
- − Depreciation
- −$4,422
- Taxable income
- $6,478
- Est. tax owed @ 24.0%
- −$1,555
- After-tax cash flow
- $6,958/yr
For passive investors: Depreciation is non-cash, so a rental often shows a tax loss while cash-flowing — sheltering income. Rental losses are passive: they offset passive income freely, and up to $25,000/yr can offset ordinary (W-2) income if you actively participate and your MAGI is under $100k (phasing out to $0 by $150k); unused losses carry forward. On sale, claimed depreciation is recaptured at up to 25%, and gains may owe capital-gains tax (a 1031 exchange can defer both). Figures are a year-1 estimate at your 24.0% rate — not tax advice; consult a CPA.
Condition & rehab AI · 13 photos
A well-maintained mobile home with average exterior and interior condition, offering a good opportunity for cosmetic updates to enhance its resale and rental value.
Repairs flagged
- Minor exterior siding — Light wear
- Minor interior paint — Some wear
Value-add opportunities
- Both Paint exterior — Enhances curb appeal and value
- Both Replace carpet — Improves comfort and value
- Both Update bathroom fixtures — Modernizes and adds value
Renovation cost estimate screening
| Repair item | Severity | Est. cost |
|---|---|---|
| exterior siding · Light wear | Minor | $500–3,000 |
| interior paint · Some wear | Minor | $500–3,000 |
| Total estimated repair cost · 2 items | $1,000–6,000 |
Value-add ROI direction
- Both Paint exterior — Enhances curb appeal and value ↑
- Both Replace carpet — Improves comfort and value ↑
- Both Update bathroom fixtures — Modernizes and adds value ↑
ⓘ Cost ranges are severity-bucket heuristics (US national rule-of-thumb). Get contractor quotes + a written scope before underwriting a rehab budget.
Schools (NCES district)
- District
- Santa Rosa High
- NCES district ID
- 0635830
- Math proficiency
- 31% —
- Reading proficiency
- 47% —
- Median HH income
- $62,000
- Composite
- 37.25/100
- National rank
- #8972
- State rank
- #703 of 1400 in CA
Livability — Santa Rosa
- Score
- 75/100
- State rank
- #112
- US rank
- #3940
Category grades
Schools grade is shown separately in the Schools card above.
Census & demographics
- Census place
- Santa Rosa, CA
- County
- Sonoma County · 449,805 people
- City population
- 210,074
- Metro
- Santa Rosa-Petaluma, CA
- Population (ZIP)
- 36,861
- Household income
- $93,615
- Rent vs Own
- Severe rent burden
- 1525.0
Population outlook (Sonoma County) Hauer SSP2
- Today (2025)
- 539,935 people
- By 2030
- 554,870 · +2.8%
- By 2040
- 573,262 · +6.2%
- By 2050
- 580,715 · +7.6%
- By 2075
- 579,229 · +7.3%
- By 2100
- 547,835 · +1.5%
Race, ethnicity, and origin ACS 2023
- Neighborhood character
- Diverse neighborhood (Simpson 0.61)
- Race & ethnicity
- White 46% Hispanic / Latino 41% Two or more races 16% Asian 6% Black 1% Native American 1%
- Hispanic origin (detail)
- Mexican 36%
- Common ancestry
- Lithuanian 2% Italian 2% Slovak 1%
- Foreign-born
- 24% · Canada, Vietnam, China
- Languages at home
- 63% English-only · Spanish 32% Other Indo-European 2% Tagalog/Filipino 1%
Political lean MEDSL · Sonoma
- 2024 margin
- Solid D (+46.2) · D 71.4% · R 25.2% · Other 3.3%
- 2008→2024 swing
- -3.4pp toward R · 2008: 49.6pp · 2024: 46.2pp
- All cycles
- 2024: D+46.2 2020: D+51.5 2016: D+47.9 2012: D+44.9 2008: D+49.6
Not yet ingested
- Civics
- —
Market trends
- HPI YoY
- ▼ -855.56%
- Current HPI
- 253.1061
- Rent YoY
- ▼ -1.37%
- Metro
- Santa Rosa-Petaluma, CA
- State GDP YoY
- ▲ 3.21%
- F500 in state
- 116
Industry mix (Fortune 500 HQ in CA)
| Industry | F500 HQs | Revenue |
|---|---|---|
| Technology | 27 | $1,492B |
|
||
| Financial Services | 3 | $174B |
|
||
| Retail | 3 | $44B |
|
||
| Insurance | 3 | $26B |
|
||
| Media / Entertainment | 2 | $115B |
|
||
| Pharmaceuticals / Biotech | 2 | $62B |
|
||
Price history
-4.4% since first listed2 events — show timeline
- 2026-04-30 Price Changed $152,000 BAREIS
- 2026-02-10 Listed $159,000 BAREIS
Cash-flow waterfall
monthlySold comps — $/sqft
last 12 mo · ≤1 miLoading sold comps…