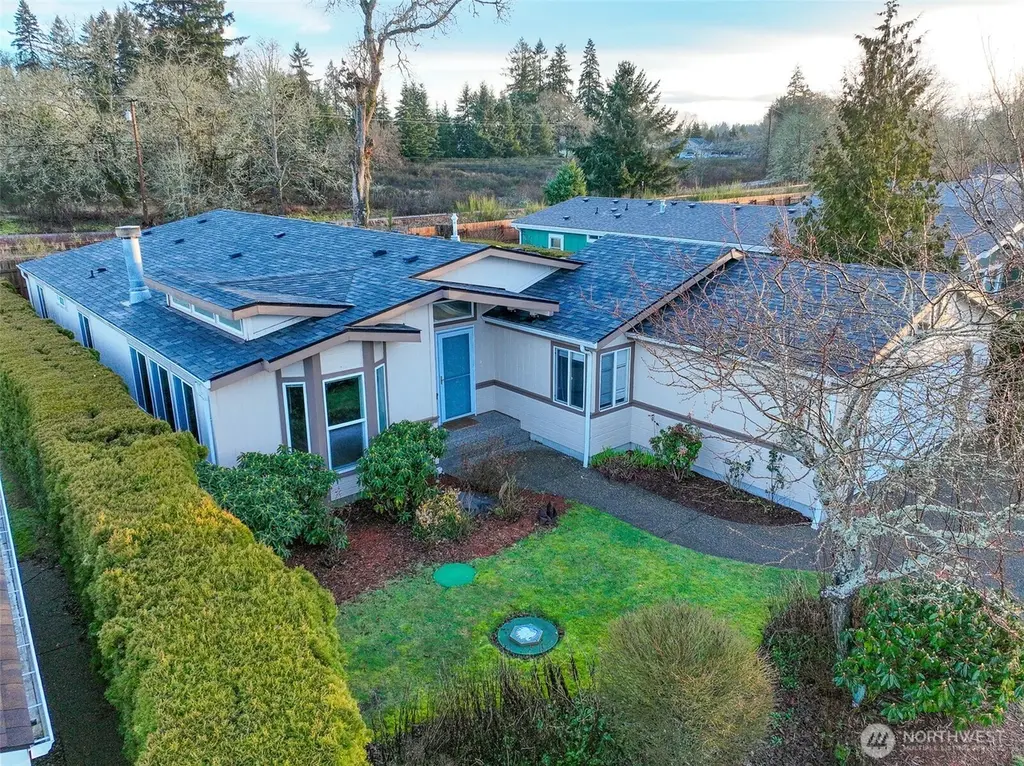
8018 18th Ln SE · Lacey, WA
Flood risk 1/10 · Minimal
- FEMA flood zone
- X (unshaded)
- Chance of flooding over 30 yrs
- 0.0%
- Est. flood insurance / yr
- $507 – $1,088
Fire risk 4/10 · Minor
- Est. fire insurance / yr
- $604 – $1,122
Heat risk 3/10 · Minor
- Hot days now (above 88°F)
- 7 days/yr
- Hot days in 30 yrs
- 15 days/yr
Wind risk 1/10 · Minimal
- Chance of severe wind over 30 yrs
- —
Air-quality risk 6/10 · Moderate
- Unhealthy air days now
- 7 days/yr
- Unhealthy air days in 30 yrs
- 8 days/yr
Risk factors via First Street. Map © Google.
Why this score? — see what drove the C- grade
The composite is a weighted blend of 9 inputs, each scored 0–100. Each bar is that input's sub-score; the figure is the points it added to the 100-point composite (weight × sub-score).
- Cash flow +18.0/30.0
- ARV discount +6.8/15.0
- DSCR +5.6/10.0
- Schools +5.1/10.0
- 1% rule +4.6/10.0
- Livability +4.2/5.0
- Rent growth +3.4/5.0
- Condition / age +2.5/5.0
- Appreciation +0.0/10.0
$249,900
🖨 Deal sheet (PDF) 📄 Offer letter ✓ Due diligence
Listing remarks
Welcome home to Laurel Oaks. A pristine and welcoming gated 55+ or better community located in the heart of Lacey. This incredibly spacious and meticulously maintained home features over 2000 square feet with a generous and open layout. Newly installed luxury vinyl flooring throughout, vaulted ceilings in great room, efficient gas burning fireplace and updated lighting fixtures. Spacious kitchen features abundant cabinetry and counter space with all appliances to convey. Primary bedroom with attached five piece ensuite+jetted soaking tub. Large second bedroom with efficient built ins and vaulted ceilings. Private and covered back yard patio is a gardeners paradise just waiting for your pers
Key facts
- Gated community
- Jetted soaking tub
- Abundant cabinetry
Tags
Neighborhood map
What this means for you Summary
Snapshot
- This is a 2-bed/2.0-bath manufactured listed at $250k.
Deal economics
- At list price, monthly cash flow is $214 ($3k/yr) — positive.
- The deal already cash-flows at list — no discount required.
- To meet the 1% rule (rent ≥ 1% of price), the offer needs to be $240k (4.0% below list).
- Recommended offer: $227k (9.0% below list) — sets the bar for market timing.
- Cap rate 7.3% vs local median 3.0% in Lacey — top-decile yield for the area; either an underpriced asset or a hidden risk that comps aren't pricing in. Stress-test before assuming the spread holds.
Location & tenants
- Location reads 85/100 on livability (#33 in WA, #581 nationally) — a professional / high-income tenant draw. Strengths: amenities A+, commute A+, housing A+; Watch: cost of living D+.
- North Thurston Public Schools (suburban): math 51% / reading 62% proficiency, ranked #80 of 291 in WA (top 28%) — acceptable for families but not a draw, mixed tenant base, ~2y average lease.
- Zoned schools: Seven Oaks Elementary (480 students, 51% FRL); Nisqually Middle School (831 students, 57% FRL); River Ridge High School (1,476 students, 44% FRL) — zoned schools average 50% FRL vs 31% district-wide (20 pts higher); higher-poverty schools than district average — tighter screening recommended.
- Market conditions: Rents rising (+3.6%/yr); 192 active listings in the ZIP; 6 comparable units currently listed for rent nearby; rentals lingering (median 46d on market — plan ~5-8 weeks vacancy on turnover, expect pricing pressure); 67% of comp listings sitting > 30 days — soft ceiling on asking rent; solid renter incomes; 1,222 units permitted in Thurston County in 2024 (508 in 5+ unit buildings).
- This rent runs 32% of the median local income ($89k/yr) — at the standard rent-burdened threshold; future hikes will face affordability resistance.
Forward outlook
- Local home prices are declining (-3.0%/yr); year-one equity from $2k of loan paydown is wiped out by about $7k of value loss. Plan a longer hold.
- Thurston County population projected at +27% by 2050 — long-run rental-demand tailwind backs the buy-and-hold thesis.
Negotiation context
- It's been on market 104 days — a 9% lower offer ($227k) is reasonable based on typical stale-listing flexibility.
- 2 sale attempts since 22y ago; this cycle's ask has dropped $30k (11%) from the opening price — seller is motivated, your offer sets the floor, not the list.
- Current owner paid $132k; list at $250k implies a 89% gain — meaningful room to come down on a strong offer.
Questions for the listing agent
- It's been on market 104 days. Have you received any prior offers? Is the seller open to a 9% concession, seller financing, or rate buy-down credit?
- Why hasn't it sold? Are there any deal-killer items the seller is aware of (foundation, flood, title, zoning, code violations)?
- Is there a deadline driving the sale (1031 exchange, divorce, estate, relocation)? That informs how much negotiation room exists.
- Schools are B-rated — typically a magnet for longer-tenancy family renters. What's the average tenant stay here, and is there a school-zone premium baked into asking?
- What's the average days-on-market for RENTAL listings here right now (not sales)? A rising rental-DOM trend means longer vacancies and softer asking-rent achievability than the comps imply.
- What's the recent tenant-quality profile in this submarket — average credit score on applications, eviction rate, late-payment / NSF rate, and stable-employment percentage? A property-management company in the area should have these aggregated.
- How much new for-sale + rental construction is in the pipeline within 1–3 miles? Heavy new supply typically softens prices + rents 12–24 months out; constrained supply supports both.
Investment metrics
- 1% rule
- 0.96% ✗
- Cap rate
- 7.32%
- Cash-on-cash
- 3.66%
- DSCR
- 1.16
- GRM
- 8.7
CMA / ARV
- ARV (median comp)
- $245,936
- List price
- $249,900
- Delta
- 1.61%
- Verdict
- FAIR
- Comps
- 9 within 1.0 mi
Show comp detail 12 sales within ~0.75 mi
| Address | Dist | Beds/Ba | Sqft | Sold | Price | $/sf | Match |
|---|---|---|---|---|---|---|---|
| 1815 Sorrel Ln SE #119 | 0.04mi | 2/2.0 | 2,080 (+2%) | 10mo | $265,000 | $127 | 86 |
| 8041 18th Ln SE #102 | 0.07mi | 2/2.0 | 2,036 (0%) | 12mo | $285,000 | $140 | 86 |
| 8045 18th Ln SE | 0.08mi | 3/2.0 (+1) | 1,971 (-3%) | 0mo | $245,900 | $125 | 86 |
| 8203 18th Ln SE #46 | 0.20mi | 2/2.0 | 2,050 (+1%) | 8mo | $240,000 | $117 | 83 |
| 8117 20th Ln SE #23 | 0.17mi | 2/2.0 | 2,050 (+1%) | 11mo | $300,000 | $146 | 82 |
| 1936 Daylily Ln SE #37 | 0.23mi | 2/2.0 | 2,050 (+1%) | 8mo | $294,950 | $144 | 81 |
| 1820 Daylily Ln SE #42 | 0.22mi | 2/2.0 | 2,050 (+1%) | 16mo | $285,000 | $139 | 75 |
| 1929 Daylily Ln SE | 0.21mi | 2/2.0 | 2,124 (+4%) | 16mo | $281,000 | $132 | 70 |
| 8205 20th Ln SE #16 | 0.23mi | 2/2.0 | 2,080 (+2%) | 21mo | $277,000 | $133 | 68 |
| 1822 Cranberry Ln SE #82 | 0.14mi | 2/2.0 | 2,240 (+10%) | 15mo | $279,900 | $125 | 65 |
| 8019 18th Ln SE #122 | 0.03mi | 3/2.0 (+1) | 1,760 (-14%) | 17mo | $269,000 | $153 | 57 |
| 8030 18th Ln SE #132 | 0.03mi | 3/2.0 (+1) | 1,804 (-11%) | 21mo | $269,000 | $149 | 57 |
Match score weights: distance 35% · size 25% · config 20% · recency 20%. Top-matched comps best support the ARV.
Projected returns pro-forma
-3.0% appreciation · 3.56% rent growth · sell at horizon
- IRR
- -9.9%
- Equity multiple
- 0.64×
- Total profit
- $-25,519
- Equity at exit
- $37,261
- IRR
- 0.2%
- Equity multiple
- 1.01×
- Total profit
- $974
- Equity at exit
- $21,607
Cash invested: $69,972 (down + closing). Projections, not guarantees.
Landlord ↔ Tenant lean methodology
- Overall (STATE)
- 28 Tenant-Leaning
- State Washington
- 28 Tenant-Leaning · D+8
- County
- — inherits STATE
- City
- — inherits STATE
ZIP-level market 98503
- Rents YoY
- 3.6%
- Active inventory
- 192
- Price-to-rent
- 8.7×
Monthly cashflow live
- Estimated rent
- $2,398 high interval (Pro) →
- Mortgage (P&I)
- −$1,311
- Tax from tax record
- −$266 /mo · $3,196/yr
- Insurance
- −$104
- HOA
- −$0
- Vacancy / Maint / Mgmt
- −$504
- Net cashflow
- $214
Break-even live
Sensitivity live
| Price | -10% $355 | -5% $284 | +0% $214 | +5% $143 | +10% $72 |
|---|---|---|---|---|---|
| Rent | -10% $24 | -5% $119 | +0% $214 | +5% $308 | +10% $403 |
| Rate | -1.0pp $340 | -0.5pp $277 | base $214 | +0.5pp $149 | +1.0pp $83 |
UW: 25.0% down · 7.5% · 30yr · 1.5% tax · 5.0% vac · 8.0% maint · 8.0% mgmt
Financing live
Cash to close
- Down payment
- $62,475
- Closing costs
- $7,497
- Reserves months
- —
- Total cash needed
- —
Loan-product check · same deal, 3 products live
Conventional
25% down · 7.5% · 30yr
- Down + closing
- —
- Monthly P&I
- —
- Monthly cashflow
- —
- DSCR
- —
- Eligible?
- —
Personal DTI + credit; lowest rate.
DSCR
20% down · 8.5% · 30yr
- Down + closing
- —
- Monthly P&I
- —
- Monthly cashflow
- —
- DSCR
- —
- Eligible?
- —
No personal income docs; deal must DSCR.
Hard money
10% down · 12.0% · 12mo
- Down + closing
- —
- Monthly P&I
- —
- Monthly cashflow
- —
- DSCR
- —
- Eligible?
- —
Short-term bridge; refi at stabilization.
Rent comps 6 comps
| Address | Beds | Baths | Sqft | Rent | $/sqft | DOM | Units | Dist |
|---|---|---|---|---|---|---|---|---|
| 8420 13th Ave SE Olympia, WA | 3.0 | 2.5 | 2164 | $2,800 | $1.29 | 46d | 1 | 0.51mi |
| 8107 26th Ave SE Lacey, WA | 3.0 | 2.5 | 1594 | $2,295 | $1.44 | 46d | 1 | 0.52mi |
| 2712 Mayes Rd SE Lacey, WA | 3.0 | 2.5 | 1763 | $2,495 | $1.42 | 23d | 1 | 0.55mi |
| 2732 Hidden Springs Loop SE Unit 1 Olympia, WA | 3.0 | 2.5 | 1778 | $2,595 | $1.46 | 46d | 1 | 0.60mi |
| 1446 Laredo Dr SE Olympia, WA | 3.0 | 3.0 | 1828 | $2,700 | $1.48 | 16d | 1 | 1.07mi |
| 7509 38th Dr SE Lacey, WA | 3.0 | 2.5 | 1800 | $2,695 | $1.50 | 46d | 1 | 1.35mi |
Listing history 7 events
-
2026-05-31days on market $249,900 Active 104 DOM
-
2026-05-30days on market $249,900 Active 103 DOM
-
2026-05-05price $249,900
-
2026-03-11price $269,900
-
2026-02-16$279,900 Active
-
2004-12-02soldstatus $132,000
-
2004-06-23$132,000
ⓘ Source: listings_history table (triggers on properties + properties_extension) + one-shot
backfill from property_details.listing_events for pre-trigger history.
Tax reassessment forecast WA · Resets to sale price
- Current annual tax
- $3,196 · $266/mo
- Projected year-2 tax
- $3,196 · $266/mo
- Expected delta
- $0/yr ($0/mo · 0.0%)
ⓘ Screening estimate from a state-policy table — verify with the county assessor before closing.
Climate risk First Street
- Flood 1/10 Low FEMA zone X (unshaded) · 0% chance over 30 yrs
- Wildfire 4/10 Moderate
- Heat 3/10 Moderate 7 d/yr ≥88°F today · 15 d/yr by 30 yrs out
- Wind 1/10 Low
- Air quality 6/10 Major 7 unhealthy d/yr today · 8 by 30 yrs out
Nearby sold comps map
Loading sold comps map…
Walkable amenities ~0.75 mi
Loading nearby amenities…
Taxation est. · year 1
- Rental income
- $28,779
- − Mortgage interest
- −$13,998
- − Property taxes
- −$3,196
- − Insurance
- −$1,250
- − Repairs & maintenance
- −$2,302
- − Management
- −$2,302
- − Depreciation
- −$7,270
- Taxable loss
- −$1,539
- Est. tax savings @ 24.0%
- +$369
- After-tax cash flow
- $2,933/yr
For passive investors: Depreciation is non-cash, so a rental often shows a tax loss while cash-flowing — sheltering income. Rental losses are passive: they offset passive income freely, and up to $25,000/yr can offset ordinary (W-2) income if you actively participate and your MAGI is under $100k (phasing out to $0 by $150k); unused losses carry forward. On sale, claimed depreciation is recaptured at up to 25%, and gains may owe capital-gains tax (a 1031 exchange can defer both). Figures are a year-1 estimate at your 24.0% rate — not tax advice; consult a CPA.
Schools (NCES district)
- District
- North Thurston Public Schools
- NCES district ID
- 5305850
- Math proficiency
- 51% ▬ 0.00%
- Reading proficiency
- 62% ▬ 0.00%
- Median HH income
- $62,338
- Composite
- 51.09/100
- National rank
- #3798
- State rank
- #80 of 291 in WA
Livability — Lacey
- Score
- 85/100
- State rank
- #33
- US rank
- #581
Category grades
Schools grade is shown separately in the Schools card above.
Census & demographics
- County
- Thurston County · 269,345 people
- City population
- 108,850
- Metro
- Olympia-Lacey-Tumwater, WA
- Population (ZIP)
- 41,656
- Household income
- $89,002
- Rent vs Own
- Severe rent burden
- 2195.0
Population outlook (Thurston County) Hauer SSP2
- Today (2025)
- 308,239 people
- By 2030
- 326,483 · +5.9%
- By 2040
- 359,890 · +16.8%
- By 2050
- 391,800 · +27.1%
- By 2075
- 468,024 · +51.8%
- By 2100
- 519,890 · +68.7%
Race, ethnicity, and origin ACS 2023
- Neighborhood character
- Diverse neighborhood (Simpson 0.56)
- Race & ethnicity
- White 65% Two or more races 12% Hispanic / Latino 12% Asian 7% Black 5% Pacific Islander 2% Native American 1%
- Hispanic origin (detail)
- Mexican 8% Puerto Rican 1%
- Common ancestry
- Portuguese 4% Slovak 3% Lithuanian 3%
- Foreign-born
- 10% · Canada, Vietnam, South Korea
- Languages at home
- 82% English-only · Spanish 6% German/W. Germanic 3% Other Asian/Pacific 2%
Political lean MEDSL · Thurston
- 2024 margin
- Strong D (+20.4) · D 58.5% · R 38.1% · Other 3.5%
- 2008→2024 swing
- -1.3pp toward R · 2008: 21.7pp · 2024: 20.4pp
- All cycles
- 2024: D+20.4 2020: D+18.6 2016: D+15.4 2012: D+19.0 2008: D+21.7
Not yet ingested
- Civics
- —
Market trends
- HPI YoY
- ▼ -385.93%
- Current HPI
- 361.0974
- Rent YoY
- ▲ 3.56%
- Metro
- Olympia-Lacey-Tumwater, WA
- State GDP YoY
- ▲ 4.65%
- F500 in state
- 22
Industry mix (Fortune 500 HQ in WA)
| Industry | F500 HQs | Revenue |
|---|---|---|
| Retail | 2 | $269B |
|
||
| Technology / Retail | 1 | $638B |
|
||
| Technology | 1 | $245B |
|
||
| Telecommunications | 1 | $38B |
|
||
| Food / Beverage | 1 | $36B |
|
||
| Automotive / Trucks | 1 | $34B |
|
||
Price history
+89.3% since first listed5 events — show timeline
- 2026-05-05 Price Changed $249,900 NWMLS as Distributed by MLS Grid
- 2026-03-11 Price Changed $269,900 NWMLS as Distributed by MLS Grid
- 2026-02-16 Listed $279,900 NWMLS as Distributed by MLS Grid
- 2004-12-02 Sold (MLS) $132,000 NWMLS as Distributed by MLS Grid
- 2004-06-23 Listed $132,000 NWMLS as Distributed by MLS Grid
Property tax history
+3.4%/yrLatest (2026): $3,196 · +1.3% YoY. Source: county tax records.
Cash-flow waterfall
monthlySold comps — $/sqft
last 12 mo · ≤1 miLoading sold comps…