714 S Seminole Ave · Fort Meade, FL
Flood risk 1/10 · Minimal
- FEMA flood zone
- X (unshaded)
- Chance of flooding over 30 yrs
- 0.0%
- Est. flood insurance / yr
- $507 – $1,088
Fire risk 7/10 · Major
- Est. fire insurance / yr
- $947 – $1,759
Heat risk 8/10 · Major
- Hot days now (above 108°F)
- 7 days/yr
- Hot days in 30 yrs
- 27 days/yr
Wind risk 9/10 · Severe
- Chance of severe wind over 30 yrs
- 99.0%
Air-quality risk 2/10 · Minimal
- Unhealthy air days now
- 2 days/yr
- Unhealthy air days in 30 yrs
- 2 days/yr
Risk factors via First Street. Map © Google.
Why this score? — see what drove the C grade
The composite is a weighted blend of 9 inputs, each scored 0–100. Each bar is that input's sub-score; the figure is the points it added to the 100-point composite (weight × sub-score).
- Cash flow +16.8/30.0
- Appreciation +10.0/10.0
- ARV discount +7.5/15.0
- DSCR +5.2/10.0
- 1% rule +4.6/10.0
- Schools +3.5/10.0
- Livability +3.1/5.0
- Rent growth +2.5/5.0
- Condition / age +2.5/5.0
$125,000
🖨 Deal sheet (PDF) 📄 Offer letter ✓ Due diligence
Listing remarks
Welcome home to Fort Meade's hidden gem! This well priced 3 bedroom, 1 bath single family home was built in 2006 and offers plenty of living space on a nice 7,200 sq ft lot perfect for outdoor living or expansion. Inside you'll enjoy the comfort of central AC and a functional layout. Priced well below comparable homes in the area, this property delivers exceptional value. Nestled in a charming historic community just minutes from downtown ideal for first-time buyers, budget conscious homeowners, or investors seeking a great deal.
Key facts
- 7,288 sq ft lot
- 4 parking spots
- Built 2006
Property features AI
Finance
- Other: Pets allowed with no restrictions; Please use GPS for directions; Property is Active Under Contract
Exterior
- Parking: Gravel, open, unpaved parking; Space for 4 vehicles
- Utilities: Public water; Public sewer; Sewer connected; Water available; Electric service with circuit breakers
- Home design: Single family residence; One story; Faces east; City street frontage
- Construction: Vinyl siding; Wood frame construction; Shingle roof; Built as single-story (one level)
- Exterior features: Open porch; Porch; Interior lot with room for a pool; No waterfront
Interior
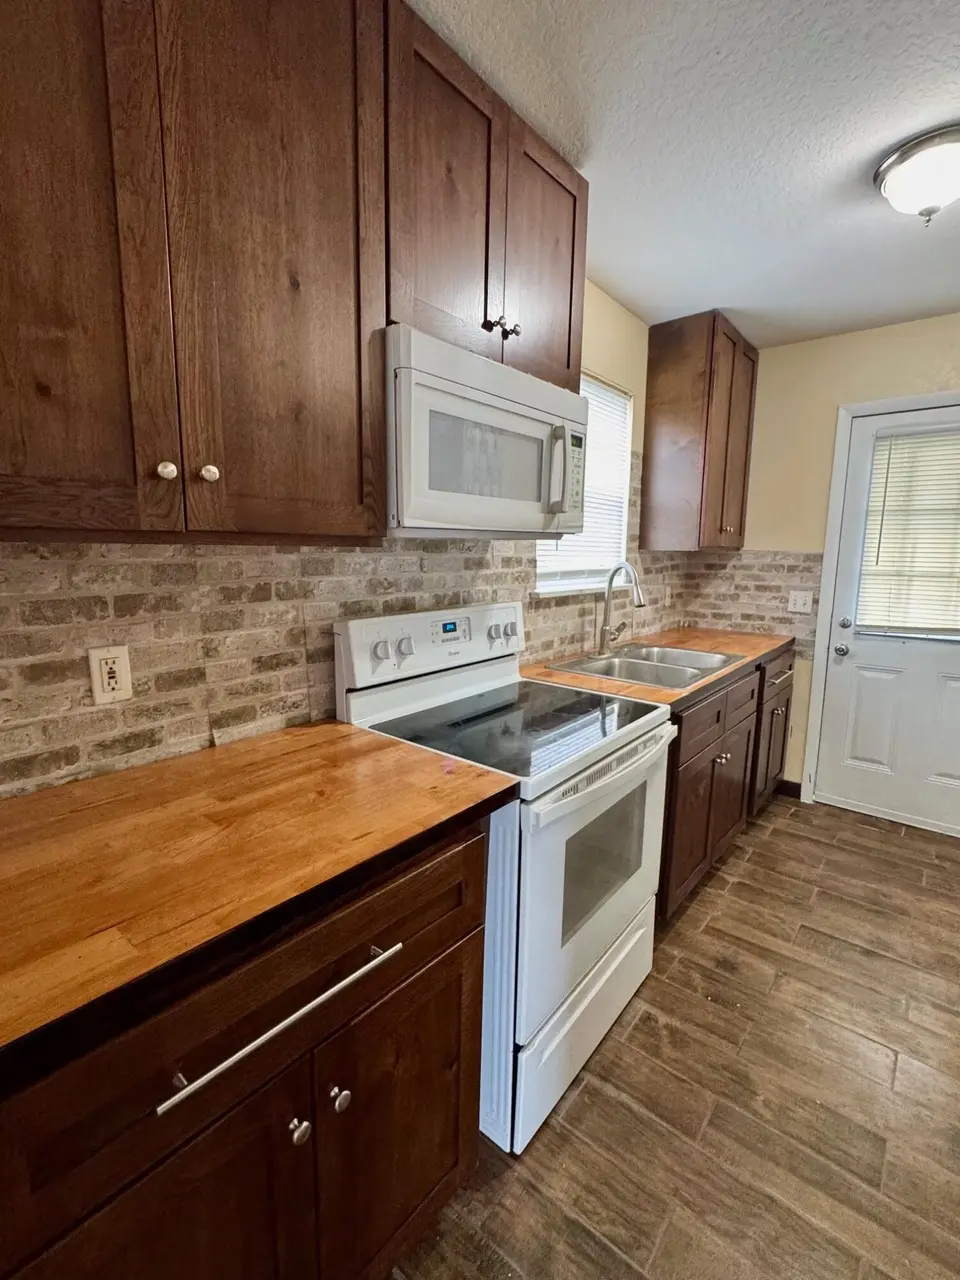
- Kitchen: Electric range; Microwave; Refrigerator; Disposal; Electric water heater
- Bedrooms: 3 bedrooms on the main level
- Flooring: Laminate flooring; Vinyl flooring
- Bathrooms: 1 full bathroom on the main level
- Heating & cooling: Central heating; Central air; Ceiling fans
- Interior features: Stacked bedroom layout; Updated/remodeled condition
- Laundry & utility: Washer hookup on main level; Electric dryer hookup
Neighborhood map
What this means for you Summary
Snapshot
- This is a 3-bed/2.0-bath single-family listed at $125k.
Deal economics
- At list price, monthly cash flow is $80 ($964/yr) — positive.
- The deal already cash-flows at list — no discount required.
- To meet the 1% rule (rent ≥ 1% of price), the offer needs to be $120k (3.7% below list).
- Recommended offer: $114k (9.0% below list) — sets the bar for market timing.
Location & tenants
- Location reads 61/100 on livability (#779 in FL) — a middle-class / working-renter tenant base. Strengths: cost of living A+, housing A+; Watch: amenities F, commute F, employment F.
- Polk (suburban): math 39% / reading 43% proficiency, ranked #62 of 73 in FL (top 85%) — families likely to look elsewhere, expect single-tenant / working-renter base with shorter leases.
- Zoned schools: Lewis Anna Woodbury Elementary School (math 33% / reading 38%, grade F, #1,684 of 2,144 statewide, top 79%, 525 students, 67% FRL); Fort Meade Middle/Senior High School (math 38% / reading 41%, grade F, #304 of 667 statewide, top 47%, 786 students, 68% FRL).
- Market conditions: 122 active listings in the ZIP; 4 comparable units currently listed for rent nearby; rentals at typical pace (median 26d on market — plan ~3-4 weeks tenant-placement turnaround); 10,384 units permitted in Polk County in 2024 (1,716 in 5+ unit buildings).
Forward outlook
- In year one you build about $13k of equity ($864 loan paydown + $12k appreciation (10.0% local appreciation)).
- Polk County population projected at +33% by 2050 — long-run rental-demand tailwind backs the buy-and-hold thesis.
- At projected returns (10.0% appreciation + 3.0% rent growth), your $35k cash investment doubles in ~3 years — after that, you're playing with house money.
- By year 3, paydown + projected appreciation supports a ~$34k cash-out refi (75% LTV) — recoverable capital for the next deal without selling this one.
Negotiation context
- It's been on market 96 days — a 9% lower offer ($114k) is reasonable based on typical stale-listing flexibility.
- 2 sale attempts with the ask held roughly flat each time — persistent listings suggest the price (not the market) is what's stuck; bring a comps-based counter.
Risks & watch-outs
- Climate carrying-cost: severe wind risk, 99% chance of damaging wind over 30y; major wildfire risk; extreme-heat days projected 7→27/yr by 2055 (HVAC capex compounding) — expect insurance premiums to compound above CPI over the hold.
Questions for the listing agent
- It's been on market 96 days. Have you received any prior offers? Is the seller open to a 9% concession, seller financing, or rate buy-down credit?
- Why hasn't it sold? Are there any deal-killer items the seller is aware of (foundation, flood, title, zoning, code violations)?
- Is there a deadline driving the sale (1031 exchange, divorce, estate, relocation)? That informs how much negotiation room exists.
- Schools are D-rated, which usually means shorter tenancies and higher turnover. Who's the typical renter profile here, and what's been the actual vacancy rate?
- What's the average days-on-market for RENTAL listings here right now (not sales)? A rising rental-DOM trend means longer vacancies and softer asking-rent achievability than the comps imply.
- What's the recent tenant-quality profile in this submarket — average credit score on applications, eviction rate, late-payment / NSF rate, and stable-employment percentage? A property-management company in the area should have these aggregated.
- How much new for-sale + rental construction is in the pipeline within 1–3 miles? Heavy new supply typically softens prices + rents 12–24 months out; constrained supply supports both.
Investment metrics
- 1% rule
- 0.96% ✗
- Cap rate
- 7.06%
- Cash-on-cash
- 2.75%
- DSCR
- 1.12
- GRM
- 8.7
CMA / ARV
No comps found within radius.
Projected returns pro-forma
10.0% appreciation · 3.0% rent growth · sell at horizon
- IRR
- 26.3%
- Equity multiple
- 3.09×
- Total profit
- $73,215
- Equity at exit
- $112,610
- IRR
- 23.0%
- Equity multiple
- 7.05×
- Total profit
- $211,628
- Equity at exit
- $242,848
Cash invested: $35,000 (down + closing). Projections, not guarantees.
Landlord ↔ Tenant lean methodology
- Overall (STATE)
- 87 Strongly Landlord-Friendly
- State Florida
- 87 Strongly Landlord-Friendly · R+3
- County
- — inherits STATE
- City
- — inherits STATE
ZIP-level market 33841
- Home prices YoY
- 7.7%
- Active inventory
- 122
- Price-to-rent
- 8.7×
Monthly cashflow live
- Estimated rent
- $1,204 medium interval (Pro) →
- Mortgage (P&I)
- −$656
- Tax from tax record
- −$163 /mo · $1,959/yr
- Insurance
- −$52
- HOA
- −$0
- Lot rent
- −$0
- Vacancy / Maint / Mgmt
- −$253
- Net cashflow
- $80
Break-even live
Sensitivity live
| Price | -10% $151 | -5% $116 | +0% $80 | +5% $45 | +10% $10 |
|---|---|---|---|---|---|
| Rent | -10% $-15 | -5% $33 | +0% $80 | +5% $128 | +10% $175 |
| Rate | -1.0pp $143 | -0.5pp $112 | base $80 | +0.5pp $48 | +1.0pp $15 |
UW: 25.0% down · 7.5% · 30yr · 1.5% tax · 5.0% vac · 8.0% maint · 8.0% mgmt
Financing live
Cash to close
- Down payment
- $31,250
- Closing costs
- $3,750
- Reserves months
- —
- Total cash needed
- —
Loan-product check · same deal, 3 products live
Conventional
25% down · 7.5% · 30yr
- Down + closing
- —
- Monthly P&I
- —
- Monthly cashflow
- —
- DSCR
- —
- Eligible?
- —
Personal DTI + credit; lowest rate.
DSCR
20% down · 8.5% · 30yr
- Down + closing
- —
- Monthly P&I
- —
- Monthly cashflow
- —
- DSCR
- —
- Eligible?
- —
No personal income docs; deal must DSCR.
Hard money
10% down · 12.0% · 12mo
- Down + closing
- —
- Monthly P&I
- —
- Monthly cashflow
- —
- DSCR
- —
- Eligible?
- —
Short-term bridge; refi at stabilization.
Rent comps 4 comps
| Address | Beds | Baths | Sqft | Rent | $/sqft | DOM | Units | Dist |
|---|---|---|---|---|---|---|---|---|
| 1165 Meadowlawn St Fort Meade, FL | 2.0 | 2.0 | 756 | $1,250 | $1.65 | 25d | 1 | 0.35mi |
| 1155 Meadowlawn St Fort Meade, FL | 2.0 | 1.5 | 924 | $1,150 | $1.24 | 25d | 1 | 0.37mi |
| 1175 Meadowlawn St Fort Meade, FL | 3.0 | 2.0 | 756 | $1,325 | $1.75 | 25d | 1 | 0.37mi |
| 121 S Seminole Ave Fort Meade, FL | 2.0 | 1.0 | 600 | $995 | $1.66 | 25d | 1 | 0.52mi |
Listing history 19 events
-
2026-06-22days on market $125,000 Active 96 DOM
-
2026-06-18days on market $125,000 Active 93 DOM
-
2026-06-17days on market $125,000 Active 92 DOM
-
2026-06-16days on market $125,000 Active 91 DOM
-
2026-06-15days on market $125,000 Active 90 DOM
-
2026-06-13days on market $125,000 Active 88 DOM
-
2026-06-10days on market $125,000 Active 85 DOM
-
2026-06-09days on market $125,000 Active 84 DOM
-
2026-06-08days on market $125,000 Active 83 DOM
-
2026-06-07days on market $125,000 Active 82 DOM
-
2026-06-05days on market $125,000 Active 79 DOM
-
2026-06-03days on market $125,000 Active 78 DOM
-
2026-06-03days on market $125,000 Active 77 DOM
-
2026-06-01days on market $125,000 Active 76 DOM
-
2026-05-31days on market $125,000 Active 75 DOM
-
2026-05-18historical Active Under Contract
-
2026-03-17$125,000 Active
-
2026-01-18historical
-
2025-08-30$125,000
ⓘ Source: listings_history table (triggers on properties + properties_extension) + one-shot
backfill from property_details.listing_events for pre-trigger history.
Tax reassessment forecast FL · Resets to sale price
- Current annual tax
- $1,959 · $163/mo
- Projected year-2 tax
- $1,959 · $163/mo
- Expected delta
- $0/yr ($0/mo · 0.0%)
ⓘ Screening estimate from a state-policy table — verify with the county assessor before closing.
Climate risk First Street
- Flood 1/10 Low FEMA zone X (unshaded) · 0% chance over 30 yrs
- Wildfire 7/10 Severe
- Heat 8/10 Severe 7 d/yr ≥108°F today · 27 d/yr by 30 yrs out
- Wind 9/10 Extreme 99% chance of damaging wind over 30 yrs
- Air quality 2/10 Low 2 unhealthy d/yr today · 2 by 30 yrs out
Nearby sold comps map
Loading sold comps map…
Walkable amenities ~0.75 mi
Loading nearby amenities…
Taxation est. · year 1
- Rental income
- $14,448
- − Mortgage interest
- −$7,002
- − Property taxes
- −$1,959
- − Insurance
- −$625
- − Repairs & maintenance
- −$1,156
- − Management
- −$1,156
- − Depreciation
- −$3,636
- Taxable loss
- −$1,086
- Est. tax savings @ 24.0%
- +$261
- After-tax cash flow
- $1,224/yr
For passive investors: Depreciation is non-cash, so a rental often shows a tax loss while cash-flowing — sheltering income. Rental losses are passive: they offset passive income freely, and up to $25,000/yr can offset ordinary (W-2) income if you actively participate and your MAGI is under $100k (phasing out to $0 by $150k); unused losses carry forward. On sale, claimed depreciation is recaptured at up to 25%, and gains may owe capital-gains tax (a 1031 exchange can defer both). Figures are a year-1 estimate at your 24.0% rate — not tax advice; consult a CPA.
Schools (NCES district)
- District
- Polk
- NCES district ID
- 1201590
- Math proficiency
- 39% ▼ -11.00%
- Reading proficiency
- 43% ▼ -4.00%
- Median HH income
- $43,979
- Composite
- 34.74/100
- National rank
- #5132
- State rank
- #62 of 73 in FL
Livability — Fort Meade
- Score
- 61/100
- State rank
- #779
- US rank
- #17625
Category grades
Schools grade is shown separately in the Schools card above.
Census & demographics
- Census place
- Fort Meade, FL
- Population (ZIP)
- 8,268
Population outlook (Polk County) Hauer SSP2
- Today (2025)
- 752,975 people
- By 2030
- 804,621 · +6.9%
- By 2040
- 906,117 · +20.3%
- By 2050
- 1,000,476 · +32.9%
- By 2075
- 1,197,520 · +59.0%
- By 2100
- 1,271,518 · +68.9%
Race, ethnicity, and origin ACS 2023
- Neighborhood character
- Diverse neighborhood (Simpson 0.59)
- Race & ethnicity
- White 50% Hispanic / Latino 38% Two or more races 13% Black 9%
- Hispanic origin (detail)
- Mexican 32% Puerto Rican 3%
- Common ancestry
- Slovak 1% Lithuanian 1%
- Foreign-born
- 11% · Canada, Jamaica
- Languages at home
- 70% English-only · Spanish 30%
Political lean MEDSL · Polk
- 2024 margin
- Strong R (+20.7) · D 39.2% · R 59.9%
- 2008→2024 swing
- -14.6pp toward R · 2008: -6.1pp · 2024: -20.7pp
- All cycles
- 2024: R+20.7 2020: R+14.4 2016: R+14.1 2012: R+6.8 2008: R+6.1
Not yet ingested
- Civics
- —
Market trends
- HPI YoY
- ▲ 26.92%
- Current HPI
- 376.8183
- Rent YoY
- —
- Metro
- —
- State GDP YoY
- ▲ 3.28%
- F500 in state
- 36
Industry mix (Fortune 500 HQ in FL)
| Industry | F500 HQs | Revenue |
|---|---|---|
| Industrial Technology | 2 | $29B |
|
||
| Insurance | 2 | $17B |
|
||
| Retail | 1 | $60B |
|
||
| Technology Distribution | 1 | $58B |
|
||
| Homebuilding | 1 | $35B |
|
||
| Technology Manufacturing | 1 | $35B |
|
||
Price history
+0.0% since first listed4 events — show timeline
- 2026-05-18 Contingent — Beaches MLS
- 2026-03-17 Listed $125,000 Beaches MLS
- 2026-01-18 Listing Removed — Beaches MLS
- 2025-08-30 Listed $125,000 Beaches MLS
Property tax history
+8.9%/yrLatest (2025): $1,959 · +29.5% YoY. Source: county tax records.
Cash-flow waterfall
monthlySold comps — $/sqft
last 12 mo · ≤1 miLoading sold comps…