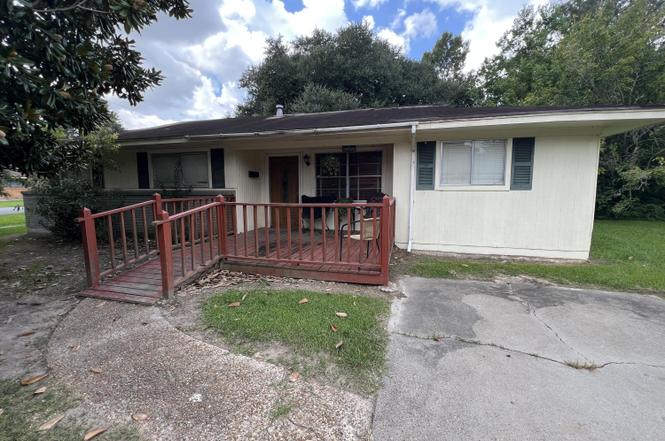
1203 Lurose Dr · Crowley, LA
Flood risk 4/10 · Minor
- FEMA flood zone
- X (shaded)
- Chance of flooding over 30 yrs
- 0.24%
- Est. flood insurance / yr
- $507 – $1,088
Fire risk 1/10 · Minimal
- Est. fire insurance / yr
- $1,269 – $2,357
Heat risk 9/10 · Severe
- Hot days now (above 109°F)
- 7 days/yr
- Hot days in 30 yrs
- 20 days/yr
Wind risk 9/10 · Severe
- Chance of severe wind over 30 yrs
- 99.0%
Air-quality risk 1/10 · Minimal
- Unhealthy air days now
- 0 days/yr
- Unhealthy air days in 30 yrs
- 0 days/yr
Risk factors via First Street. Map © Google.
Why this score? — see what drove the B- grade
The composite is a weighted blend of 9 inputs, each scored 0–100. Each bar is that input's sub-score; the figure is the points it added to the 100-point composite (weight × sub-score).
- Cash flow +28.2/30.0
- ARV discount +12.6/15.0
- DSCR +10.0/10.0
- 1% rule +6.9/10.0
- Schools +3.2/10.0
- Livability +3.2/5.0
- Rent growth +2.5/5.0
- Condition / age +2.5/5.0
- Appreciation +0.0/10.0
$80,000
🖨 Deal sheet 📄 Offer letter ✓ Due diligence
Listing remarks
Welcome to this 3-bedroom, 1-bathroom home situated on a spacious corner lot in the heart of Crowley. This property offers a comfortable layout with plenty of natural light, a cozy living area, and a kitchen ready for your personal touch. The corner lot provides extra yard space--perfect for outdoor entertaining, gardening, or simply relaxing. Crowley is home to vibrant events like the International Rice Festival, historic downtown architecture, and charming local shops and restaurants. With easy access to Lafayette and major highways, you'll have both small-town charm and convenient city connections - minutes from schools, shopping, and dining!Whether you're a first-time buyer, investor, o
Key facts
- Outdoor entertaining
- Corner lot
- Local shops
Tags
Property features AI
Exterior
- Parking: Open parking
- Utilities: Public sewer; Electric service: CLECO
- Home design: Single family residence; City street frontage
- Construction: Brick veneer and HardiPlank-type siding; Composition roof
- Exterior features: Open patio/porch; Chain link, full and wood fencing
Interior
- Kitchen: Refrigerator; Electric stove/oven
- Flooring: Laminate
- Bathrooms: 1 full bathroom
- Heating & cooling: Central heating; Central air conditioning
- Interior features: Computer nook; Formica countertops; Lighting (exterior)
- Laundry & utility: Washer hookup; Electric dryer hookup
Neighborhood map
What this means for you Summary
Snapshot
- This is a 3-bed/1.0-bath single-family listed at $80k.
Deal economics
- At list price, monthly cash flow is $253 ($3k/yr) — positive.
- The deal already cash-flows at list — no discount required.
- Meets the 1% rule at list price ($949 rent vs $80k).
- Recommended offer: $70k (12.0% below list) — sets the bar for market timing.
- Cap rate 10.1% vs local median 3.4% in Crowley — top-decile yield for the area; either an underpriced asset or a hidden risk that comps aren't pricing in. Stress-test before assuming the spread holds.
Location & tenants
- Location reads 65/100 on livability (#145 in LA) — a middle-class / working-renter tenant base. Strengths: cost of living A+, health & safety A+, housing A-; Watch: crime F, amenities F, commute F.
- Acadia Parish (rural): math 32% / reading 44% proficiency, ranked #28 of 98 in LA (top 29%) — families likely to look elsewhere, expect single-tenant / working-renter base with shorter leases; 62% free/reduced lunch — lower-income household profile, screen leases tightly.
- Zoned schools: Ross Elementary School (math 8% / reading 17%, grade F, #550 of 646 statewide, top 88%, 259 students, 90% FRL); Crowley Middle School (math 9% / reading 17%, grade F, #189 of 218 statewide, top 87%, 449 students, 83% FRL); Crowley High School (math 22% / reading 27%, grade F, #153 of 265 statewide, top 62%, 536 students, 76% FRL) — zoned schools average 83% FRL vs 62% district-wide (21 pts higher); higher-poverty schools than district average — tighter screening recommended.
- Zoned-school proficiency averages 17% at this address vs 38% district-wide (-21 pts) — the specific schools serving this property underperform the Acadia Parish average; the district grade overstates school quality for this exact location.
- Market conditions: 95 active listings in the ZIP; 2 comparable units currently listed for rent nearby; 137 units permitted in Acadia Parish in 2024 (0 in 5+ unit buildings).
Forward outlook
- Local home prices are declining (-3.0%/yr); year-one equity from $553 of loan paydown is wiped out by about $2k of value loss. Plan a longer hold.
- At projected returns (-3.0% appreciation + 3.0% rent growth), your $22k cash investment doubles in ~9 years — after that, you're playing with house money.
Negotiation context
- It's been on market 283 days — a 12% lower offer ($70k) is reasonable based on typical stale-listing flexibility.
Risks & watch-outs
- Climate carrying-cost: severe wind risk, 99% chance of damaging wind over 30y; extreme-heat days projected 7→20/yr by 2055 (HVAC capex compounding) — expect insurance premiums to compound above CPI over the hold.
Questions for the listing agent
- It's been on market 283 days. Have you received any prior offers? Is the seller open to a 12% concession, seller financing, or rate buy-down credit?
- Why hasn't it sold? Are there any deal-killer items the seller is aware of (foundation, flood, title, zoning, code violations)?
- Is there a deadline driving the sale (1031 exchange, divorce, estate, relocation)? That informs how much negotiation room exists.
- Schools are B-rated — typically a magnet for longer-tenancy family renters. What's the average tenant stay here, and is there a school-zone premium baked into asking?
- Crime grade is F in this area — have there been break-ins, vandalism, or insurance claims at this property in the last 3 years? What carrier currently insures it and at what premium?
- What's the average days-on-market for RENTAL listings here right now (not sales)? A rising rental-DOM trend means longer vacancies and softer asking-rent achievability than the comps imply.
- What's the recent tenant-quality profile in this submarket — average credit score on applications, eviction rate, late-payment / NSF rate, and stable-employment percentage? A property-management company in the area should have these aggregated.
- How much new for-sale + rental construction is in the pipeline within 1–3 miles? Heavy new supply typically softens prices + rents 12–24 months out; constrained supply supports both.
Investment metrics
- 1% rule
- 1.19% ✓
- Cap rate
- 10.08%
- Cash-on-cash
- 13.54%
- DSCR
- 1.60
- GRM
- 7.0
CMA / ARV
- ARV (on-the-fly)
- $90,200
- Comps found
- 2
Show comp detail 2 sales within ~0.75 mi
| Address | Dist | Beds/Ba | Sqft | Sold | Price | $/sf | Match |
|---|---|---|---|---|---|---|---|
| 1218 Lurose Dr | 0.04mi | 3/1.0 | 1,101 (+0%) | 19mo | $87,500 | $79 | 82 |
| 1842 Grace Pete St | 0.47mi | 3/1.5 | 1,100 (0%) | 6mo | $90,000 | $82 | 71 |
Match score weights: distance 35% · size 25% · config 20% · recency 20%. Top-matched comps best support the ARV.
Projected returns pro-forma
-3.0% appreciation · 3.0% rent growth · sell at horizon
- IRR
- 3.6%
- Equity multiple
- 1.14×
- Total profit
- $3,115
- Equity at exit
- $11,928
- IRR
- 13.1%
- Equity multiple
- 2.04×
- Total profit
- $23,362
- Equity at exit
- $6,917
Cash invested: $22,400 (down + closing). Projections, not guarantees.
Landlord ↔ Tenant lean methodology
- Overall (STATE)
- 90 Strongly Landlord-Friendly
- State Louisiana
- 90 Strongly Landlord-Friendly · R+12
- County
- — inherits STATE
- City
- — inherits STATE
ZIP-level market 70526
- Active inventory
- 95
- Price-to-rent
- 7.0×
Monthly cashflow live
- Estimated rent
- $949 medium interval (Pro) →
- Mortgage (P&I)
- −$420
- Tax from tax record
- −$44 /mo · $532/yr
- Insurance
- −$33
- HOA
- −$0
- Vacancy / Maint / Mgmt
- −$199
- Net cashflow
- $253
Break-even live
UW: 25.0% down · 7.5% · 30yr · 1.5% tax · 5.0% vac · 8.0% maint · 8.0% mgmt
Financing live
Cash to close
- Down payment
- $20,000
- Closing costs
- $2,400
- Reserves months
- —
- Total cash needed
- —
Loan-product check · same deal, 3 products live
Conventional
25% down · 7.5% · 30yr
- Down + closing
- —
- Monthly P&I
- —
- Monthly cashflow
- —
- DSCR
- —
- Eligible?
- —
Personal DTI + credit; lowest rate.
DSCR
20% down · 8.5% · 30yr
- Down + closing
- —
- Monthly P&I
- —
- Monthly cashflow
- —
- DSCR
- —
- Eligible?
- —
No personal income docs; deal must DSCR.
Hard money
10% down · 12.0% · 12mo
- Down + closing
- —
- Monthly P&I
- —
- Monthly cashflow
- —
- DSCR
- —
- Eligible?
- —
Short-term bridge; refi at stabilization.
Rent comps 2 comps
| Address | Beds | Baths | Sqft | Rent | $/sqft | DOM | Units | Dist |
|---|---|---|---|---|---|---|---|---|
| 1842 Grace Pete St Crowley, LA | 2.0 | 1.5 | 1100 | $900 | $0.82 | 21d | 1 | 0.46mi |
| 616 E 11th St Crowley, LA | 2.0 | 1.0 | 1200 | $1,100 | $0.92 | 21d | 1 | 1.30mi |
Listing history 17 events
-
2026-06-18days on market $80,000 Active 283 DOM
-
2026-06-17days on market $80,000 Active 282 DOM
-
2026-06-16days on market $80,000 Active 281 DOM
-
2026-06-15days on market $80,000 Active 280 DOM
-
2026-06-13days on market $80,000 Active 278 DOM
-
2026-06-12days on market $80,000 Active 277 DOM
-
2026-06-09days on market $80,000 Active 274 DOM
-
2026-06-08days on market $80,000 Active 273 DOM
-
2026-06-07days on market $80,000 Active 272 DOM
-
2026-06-07days on market $80,000 Active 271 DOM
-
2026-06-04days on market $80,000 Active 268 DOM
-
2026-06-02days on market $80,000 Active 267 DOM
-
2026-06-01days on market $80,000 Active 266 DOM
-
2026-05-31days on market $80,000 Active 265 DOM
-
2026-05-31days on market $80,000 Active 264 DOM
-
2025-09-07$80,000 Active
-
2007-04-18soldstatus
ⓘ Source: listings_history table (triggers on properties + properties_extension) + one-shot
backfill from property_details.listing_events for pre-trigger history.
Tax reassessment forecast LA · Resets to sale price
- Current annual tax
- $532 · $44/mo
- Projected year-2 tax
- $532 · $44/mo
- Expected delta
- $0/yr ($0/mo · 0.0%)
ⓘ Screening estimate from a state-policy table — verify with the county assessor before closing.
Climate risk First Street
- Flood 4/10 Moderate FEMA zone X (shaded) · 24% chance over 30 yrs
- Wildfire 1/10 Low
- Heat 9/10 Extreme 7 d/yr ≥109°F today · 20 d/yr by 30 yrs out
- Wind 9/10 Extreme 99% chance of damaging wind over 30 yrs
- Air quality 1/10 Low 0 unhealthy d/yr today · 0 by 30 yrs out
Nearby sold comps map
Loading sold comps map…
Walkable amenities ~0.75 mi
Loading nearby amenities…
Taxation est. · year 1
- Rental income
- $11,392
- − Mortgage interest
- −$4,481
- − Property taxes
- −$532
- − Insurance
- −$400
- − Repairs & maintenance
- −$911
- − Management
- −$911
- − Depreciation
- −$2,327
- Taxable income
- $1,829
- Est. tax owed @ 24.0%
- −$439
- After-tax cash flow
- $2,594/yr
For passive investors: Depreciation is non-cash, so a rental often shows a tax loss while cash-flowing — sheltering income. Rental losses are passive: they offset passive income freely, and up to $25,000/yr can offset ordinary (W-2) income if you actively participate and your MAGI is under $100k (phasing out to $0 by $150k); unused losses carry forward. On sale, claimed depreciation is recaptured at up to 25%, and gains may owe capital-gains tax (a 1031 exchange can defer both). Figures are a year-1 estimate at your 24.0% rate — not tax advice; consult a CPA.
Schools (NCES district)
- District
- Acadia Parish
- NCES district ID
- 2200030
- Math proficiency
- 32% ▼ -39.00%
- Reading proficiency
- 44% ▼ -32.00%
- Median HH income
- $38,012
- Composite
- 31.65/100
- National rank
- #5929
- State rank
- #28 of 98 in LA
Livability — Crowley
- Score
- 65/100
- State rank
- #145
- US rank
- #12669
Category grades
Schools grade is shown separately in the Schools card above.
Census & demographics
- Census place
- Crowley, LA
- City population
- 16,740
- Population (ZIP)
- 16,740
Population outlook (Acadia County) Hauer SSP2
- Today (2025)
- 63,846 people
- By 2030
- 64,141 · +0.5%
- By 2040
- 63,922 · +0.1%
- By 2050
- 62,263 · -2.5%
- By 2075
- 56,507 · -11.5%
- By 2100
- 46,316 · -27.5%
Race, ethnicity, and origin ACS 2023
- Neighborhood character
- Predominantly White (72%)
- Race & ethnicity
- White 72% Black 20% Two or more races 6% Hispanic / Latino 2%
- Common ancestry
- Lithuanian 14% Italian 2%
- Foreign-born
- 1% · Canada
- Languages at home
- 95% English-only · French/Haitian/Cajun 4% Spanish 1%
Political lean MEDSL · Acadia
- 2024 margin
- Solid R (+64.0) · D 17.6% · R 81.5%
- 2008→2024 swing
- -18.3pp toward R · 2008: -45.7pp · 2024: -64.0pp
- All cycles
- 2024: R+64.0 2020: R+60.3 2016: R+56.7 2012: R+49.8 2008: R+45.7
Not yet ingested
- Civics
- —
Market trends
- HPI YoY
- ▼ -52.11%
- Current HPI
- 88.3686
- Rent YoY
- —
- Metro
- —
- State GDP YoY
- ▲ 3.29%
- F500 in state
- 10
Industry mix (Fortune 500 HQ in LA)
| Industry | F500 HQs | Revenue |
|---|---|---|
| Telecommunications | 2 | $23B |
|
||
| Utilities | 1 | $12B |
|
||
| Wholesale / Distribution | 1 | $5B |
|
||
| Advertising | 1 | $2B |
|
||
Price history
2 events — show timeline
- 2025-09-07 Listed $80,000 AcadianaMLS
- 2007-04-18 Sold (Public Records) — Public Records
Property tax history
+2.1%/yrLatest (2025): $532 · +0.3% YoY. Source: county tax records.
Cash-flow waterfall
monthlySold comps — $/sqft
last 12 mo · ≤1 miLoading sold comps…