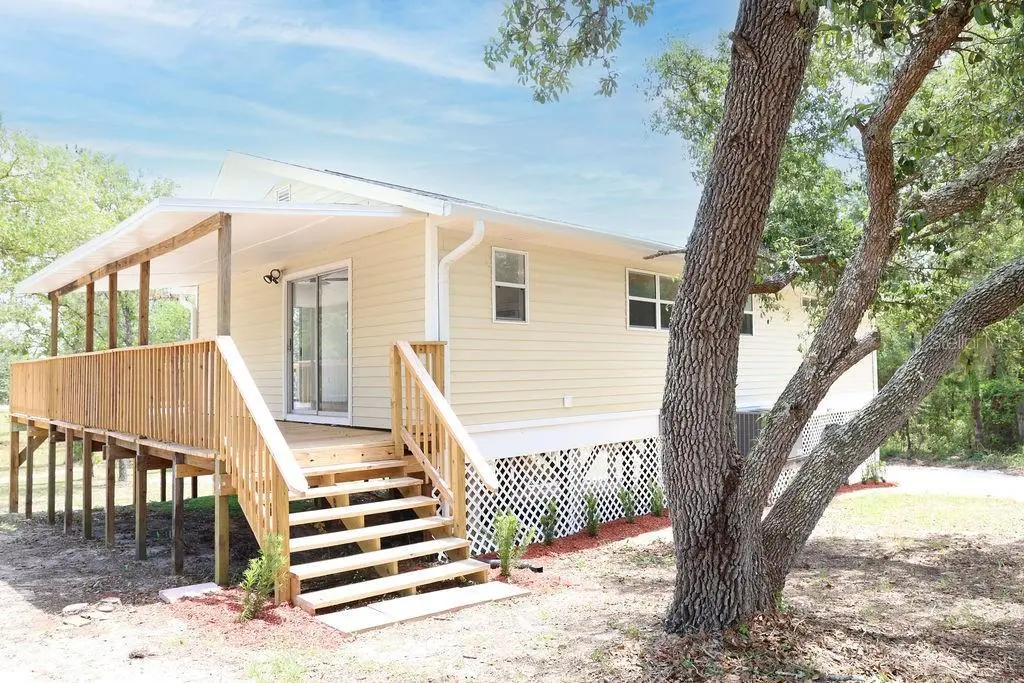
1871 NE 154th Ave · Williston Highlands, FL
Flood risk 1/10 · Minimal
- FEMA flood zone
- X (unshaded)
- Chance of flooding over 30 yrs
- 0.0%
- Est. flood insurance / yr
- $507 – $1,088
Fire risk 6/10 · Moderate
- Est. fire insurance / yr
- $947 – $1,759
Heat risk 8/10 · Major
- Hot days now (above 107°F)
- 7 days/yr
- Hot days in 30 yrs
- 23 days/yr
Wind risk 9/10 · Severe
- Chance of severe wind over 30 yrs
- 99.0%
Air-quality risk 2/10 · Minimal
- Unhealthy air days now
- 2 days/yr
- Unhealthy air days in 30 yrs
- 2 days/yr
Risk factors via First Street. Map © Google.
Why this score? — see what drove the F grade
The composite is a weighted blend of 9 inputs, each scored 0–100. Each bar is that input's sub-score; the figure is the points it added to the 100-point composite (weight × sub-score).
- Cash flow +12.9/30.0
- DSCR +3.9/10.0
- Schools +3.6/10.0
- Livability +2.9/5.0
- 1% rule +2.5/10.0
- Rent growth +2.5/5.0
- Condition / age +2.5/5.0
- ARV discount +0.0/15.0
- Appreciation +0.0/10.0
$239,000
🖨 Deal sheet 📄 Offer letter ✓ Due diligence
Listing remarks
Enjoy the perfect balance of peaceful country living and everyday convenience with this charming 3-bedroom, 2-bath home situated on 2 private acres. Tucked away in a serene setting while still offering an easy drive to shopping, dining, and the conveniences of downtown Williston, this property provides space, privacy, and flexibility both inside and out. The home features an open floor plan designed for comfortable living and entertaining, with the kitchen overlooking a spacious family room filled with natural gathering space. A separate dining or lounge area adds versatility to fit your lifestyle needs. Luxury vinyl plank flooring runs throughout the home, creating a cohesive and low-maint
Key facts
- Private acres
- Open floor plan
- Inside laundry area
Tags
Property features AI
Finance
- Other: 2 to less than 5 acres (listed as 2 acres); Lot dimensions approx. 404 x 215; Road surfaces: dirt and limerock; One well and one septic on property
- HOA & community: No association approval required; Pets allowed (cats and dogs OK)
Exterior
- Parking: 3-car garage (garage dimensions approx. 35 x 31); 2-car carport
- Utilities: Well water; Septic tank; Electricity connected; Phone available; Other utilities
- Home design: Single family residence; Residential property; One story; East-facing entry
- Construction: Frame construction; Shingle roof; Pillar/post/pier foundation; Built/Completed (property condition: completed)
- Exterior features: Lighting; Rain gutters; Sliding doors; Shed(s), storage and workshop on property; Sloped lot in county, unincorporated
Interior
- Kitchen: Dishwasher; Range; Refrigerator; Electric water heater
- Bedrooms: 3 bedrooms
- Bathrooms: 2 full bathrooms
- Heating & cooling: Central heating (electric); Central air conditioning
- Interior features: Ceiling fans; Living room/dining room combo; Open floorplan; Solid wood cabinets; Walk-in closet(s); Inside utility room
- Laundry & utility: Laundry inside
Neighborhood map
What this means for you Summary
Snapshot
- This is a 3-bed/1.0-bath single-family listed at $239k.
Deal economics
- At list price, monthly cash flow is $-18 ($-211/yr) — negative.
- To cash-flow at today's rent, offer at most $236k (1.3% below list).
- To meet the 1% rule (rent ≥ 1% of price), the offer needs to be $180k (24.7% below list).
- Recommended offer: $180k (24.7% below list) — sets the bar for 1% rule.
Location & tenants
- Location reads 57/100 on livability (#851 in FL) — a working-class tenant base; expect higher turnover. Strengths: crime A+, cost of living A+, housing A+; Watch: employment C-, amenities F, commute F.
- Levy (rural): math 45% / reading 43% proficiency, ranked #54 of 73 in FL (top 74%) — families likely to look elsewhere, expect single-tenant / working-renter base with shorter leases; 62% free/reduced lunch — lower-income household profile, screen leases tightly.
- Zoned schools: Joyce M. Bullock Elementary School (662 students, 70% FRL); Williston Middle High School (math 44% / reading 36%, grade F, #296 of 667 statewide, top 45%, 1,119 students, 60% FRL) — zoned schools at 65% FRL track the district average.
- Market conditions: 358 active listings in the ZIP; 199 units permitted in Levy County in 2024 (0 in 5+ unit buildings).
Forward outlook
- Local home prices are declining (-3.0%/yr); year-one equity from $2k of loan paydown is wiped out by about $7k of value loss. Plan a longer hold.
- Levy County population projected at -28% by 2050 — secular population decline; favor cash flow + early exit over multi-decade hold.
Negotiation context
- It's been on market 27 days — a 2% lower offer ($235k) is reasonable based on typical stale-listing flexibility.
- Current owner paid $66k; list at $239k implies a 259% gain — meaningful room to come down on a strong offer.
Risks & watch-outs
- Climate carrying-cost: severe wind risk, 99% chance of damaging wind over 30y; major wildfire risk; extreme-heat days projected 7→23/yr by 2055 (HVAC capex compounding) — expect insurance premiums to compound above CPI over the hold.
Questions for the listing agent
- What do current leases actually rent for vs. the listed asking? Can we see a recent rent roll and the last 12 months of T-12 income?
- Is there a deadline driving the sale (1031 exchange, divorce, estate, relocation)? That informs how much negotiation room exists.
- Schools are F-rated, which usually means shorter tenancies and higher turnover. Who's the typical renter profile here, and what's been the actual vacancy rate?
- The area grade is low — what's the realistic commute time and amenity access for the typical tenant pool here? Any planned neighborhood developments (good or bad) we should know about?
- What's the average days-on-market for RENTAL listings here right now (not sales)? A rising rental-DOM trend means longer vacancies and softer asking-rent achievability than the comps imply.
- What's the recent tenant-quality profile in this submarket — average credit score on applications, eviction rate, late-payment / NSF rate, and stable-employment percentage? A property-management company in the area should have these aggregated.
- How much new for-sale + rental construction is in the pipeline within 1–3 miles? Heavy new supply typically softens prices + rents 12–24 months out; constrained supply supports both.
Investment metrics
- 1% rule
- 0.75% ✗
- Cap rate
- 6.20%
- Cash-on-cash
- -0.32%
- DSCR
- 0.99
- GRM
- 11.1
CMA / ARV
- ARV (on-the-fly)
- $179,520
- Comps found
- 5
Show comp detail 5 sales within ~0.75 mi
| Address | Dist | Beds/Ba | Sqft | Sold | Price | $/sf | Match |
|---|---|---|---|---|---|---|---|
| 1461 NE 157th Ave | 0.60mi | 2/1.0 (-1) | 918 (-4%) | 9mo | $150,000 | $163 | 52 |
| 1441 NE 157th Ave | 0.61mi | 2/1.0 (-1) | 939 (-2%) | 15mo | $140,000 | $149 | 51 |
| 15791 NE 14th Pl | 0.53mi | 2/1.0 (-1) | 936 (-2%) | 24mo | $174,900 | $187 | 46 |
| 1540 NE 157th Ave | 0.54mi | 2/2.0 (-1) | 1,090 (+14%) | 1mo | $209,500 | $192 | 43 |
| 15791 NE 13th Ln | 0.57mi | 2/2.0 (-1) | 1,080 (+12%) | 13mo | $205,000 | $190 | 32 |
Match score weights: distance 35% · size 25% · config 20% · recency 20%. Top-matched comps best support the ARV.
Projected returns pro-forma
-3.0% appreciation · 3.0% rent growth · sell at horizon
- IRR
- -16.9%
- Equity multiple
- 0.40×
- Total profit
- $-39,953
- Equity at exit
- $35,636
- IRR
- -8.8%
- Equity multiple
- 0.45×
- Total profit
- $-36,656
- Equity at exit
- $20,664
Cash invested: $66,920 (down + closing). Projections, not guarantees.
Landlord ↔ Tenant lean methodology
- Overall (STATE)
- 87 Strongly Landlord-Friendly
- State Florida
- 87 Strongly Landlord-Friendly · R+3
- County
- — inherits STATE
- City
- — inherits STATE
ZIP-level market 32696
- Home prices YoY
- -6.2%
- Active inventory
- 358
- Price-to-rent
- 11.1×
Monthly cashflow live
- Estimated rent
- $1,798 medium interval (Pro) →
- Mortgage (P&I)
- −$1,253
- Tax from tax record
- −$85 /mo · $1,026/yr
- Insurance
- −$100
- HOA
- −$0
- Vacancy / Maint / Mgmt
- −$378
- Net cashflow
- $-18
Break-even live
UW: 25.0% down · 7.5% · 30yr · 1.5% tax · 5.0% vac · 8.0% maint · 8.0% mgmt
Financing live
Cash to close
- Down payment
- $59,750
- Closing costs
- $7,170
- Reserves months
- —
- Total cash needed
- —
Loan-product check · same deal, 3 products live
Conventional
25% down · 7.5% · 30yr
- Down + closing
- —
- Monthly P&I
- —
- Monthly cashflow
- —
- DSCR
- —
- Eligible?
- —
Personal DTI + credit; lowest rate.
DSCR
20% down · 8.5% · 30yr
- Down + closing
- —
- Monthly P&I
- —
- Monthly cashflow
- —
- DSCR
- —
- Eligible?
- —
No personal income docs; deal must DSCR.
Hard money
10% down · 12.0% · 12mo
- Down + closing
- —
- Monthly P&I
- —
- Monthly cashflow
- —
- DSCR
- —
- Eligible?
- —
Short-term bridge; refi at stabilization.
Listing history 18 events
-
2026-06-18days on market $239,000 Active 27 DOM
-
2026-06-17days on market $239,000 Active 26 DOM
-
2026-06-16days on market $239,000 Active 25 DOM
-
2026-06-15days on market $239,000 Active 24 DOM
-
2026-06-14days on market $239,000 Active 22 DOM
-
2026-06-13days on market $239,000 Active 21 DOM
-
2026-06-10pricedays on market $239,000 Active 19 DOM
-
2026-06-09days on market $249,000 Active 18 DOM
-
2026-06-08days on market $249,000 Active 17 DOM
-
2026-06-07days on market $249,000 Active 16 DOM
-
2026-06-05days on market $249,000 Active 13 DOM
-
2026-06-03days on market $249,000 Active 12 DOM
-
2026-06-02days on market $249,000 Active 11 DOM
-
2026-06-01days on market $249,000 Active 10 DOM
-
2026-05-31days on market $249,000 Active 9 DOM
-
2026-05-30days on market $249,000 Active 8 DOM
-
2026-05-22$249,000 Active
-
2004-11-29soldstatus $66,500
ⓘ Source: listings_history table (triggers on properties + properties_extension) + one-shot
backfill from property_details.listing_events for pre-trigger history.
Tax reassessment forecast FL · Resets to sale price
- Current annual tax
- $1,026 · $85/mo
- Projected year-2 tax
- $1,984 · $165/mo
- Expected delta
- +$958/yr (+$80/mo · 93.4%)
ⓘ Screening estimate from a state-policy table — verify with the county assessor before closing.
Climate risk First Street
- Flood 1/10 Low FEMA zone X (unshaded) · 0% chance over 30 yrs
- Wildfire 6/10 Major
- Heat 8/10 Severe 7 d/yr ≥107°F today · 23 d/yr by 30 yrs out
- Wind 9/10 Extreme 99% chance of damaging wind over 30 yrs
- Air quality 2/10 Low 2 unhealthy d/yr today · 2 by 30 yrs out
Nearby sold comps map
Loading sold comps map…
Walkable amenities ~0.75 mi
Loading nearby amenities…
Taxation est. · year 1
- Rental income
- $21,582
- − Mortgage interest
- −$13,388
- − Property taxes
- −$1,026
- − Insurance
- −$1,195
- − Repairs & maintenance
- −$1,727
- − Management
- −$1,727
- − Depreciation
- −$6,953
- Taxable loss
- −$4,432
- Est. tax savings @ 24.0%
- +$1,064
- After-tax cash flow
- $853/yr
For passive investors: Depreciation is non-cash, so a rental often shows a tax loss while cash-flowing — sheltering income. Rental losses are passive: they offset passive income freely, and up to $25,000/yr can offset ordinary (W-2) income if you actively participate and your MAGI is under $100k (phasing out to $0 by $150k); unused losses carry forward. On sale, claimed depreciation is recaptured at up to 25%, and gains may owe capital-gains tax (a 1031 exchange can defer both). Figures are a year-1 estimate at your 24.0% rate — not tax advice; consult a CPA.
Schools (NCES district)
- District
- Levy
- NCES district ID
- 1201140
- Math proficiency
- 45% ▼ -8.00%
- Reading proficiency
- 43% ▼ -3.00%
- Median HH income
- $35,254
- Composite
- 36.42/100
- National rank
- #4673
- State rank
- #54 of 73 in FL
Livability — Williston Highlands
- Score
- 57/100
- State rank
- #851
- US rank
- #21745
Category grades
Schools grade is shown separately in the Schools card above.
Census & demographics
- Census place
- Williston Highlands, FL
- Population (ZIP)
- 14,532
Population outlook (Levy County) Hauer SSP2
- Today (2025)
- 36,536 people
- By 2030
- 34,498 · -5.6%
- By 2040
- 30,294 · -17.1%
- By 2050
- 26,368 · -27.8%
- By 2075
- 19,003 · -48.0%
- By 2100
- 13,169 · -64.0%
Race, ethnicity, and origin ACS 2023
- Neighborhood character
- Predominantly White (69%)
- Race & ethnicity
- White 69% Hispanic / Latino 13% Black 13% Two or more races 7%
- Hispanic origin (detail)
- Mexican 3% Puerto Rican 4% Cuban 2%
- Common ancestry
- Slovak 4% Iranian 2% Lithuanian 1%
- Foreign-born
- 6% · Canada, China
- Languages at home
- 89% English-only · Spanish 10% Chinese 1%
Political lean MEDSL · Levy
- 2024 margin
- Solid R (+50.3) · D 24.6% · R 74.8%
- 2008→2024 swing
- -23.3pp toward R · 2008: -26.9pp · 2024: -50.3pp
- All cycles
- 2024: R+50.3 2020: R+45.6 2016: R+44.8 2012: R+32.2 2008: R+26.9
Not yet ingested
- Civics
- —
Market trends
- HPI YoY
- ▼ -21.99%
- Current HPI
- 335.7751
- Rent YoY
- —
- Metro
- —
- State GDP YoY
- ▲ 3.28%
- F500 in state
- 36
Industry mix (Fortune 500 HQ in FL)
| Industry | F500 HQs | Revenue |
|---|---|---|
| Industrial Technology | 2 | $29B |
|
||
| Insurance | 2 | $17B |
|
||
| Retail | 1 | $60B |
|
||
| Technology Distribution | 1 | $58B |
|
||
| Homebuilding | 1 | $35B |
|
||
| Technology Manufacturing | 1 | $35B |
|
||
Price history
+274.4% since first listed2 events — show timeline
- 2026-05-22 Listed $249,000 Stellar MLS as Distributed by MLS Grid
- 2004-11-29 Sold (Public Records) $66,500 Public Records
Property tax history
+3.6%/yrLatest (2025): $1,026 · +19.3% YoY. Source: county tax records.
Cash-flow waterfall
monthlySold comps — $/sqft
last 12 mo · ≤1 miLoading sold comps…