 7-Plex
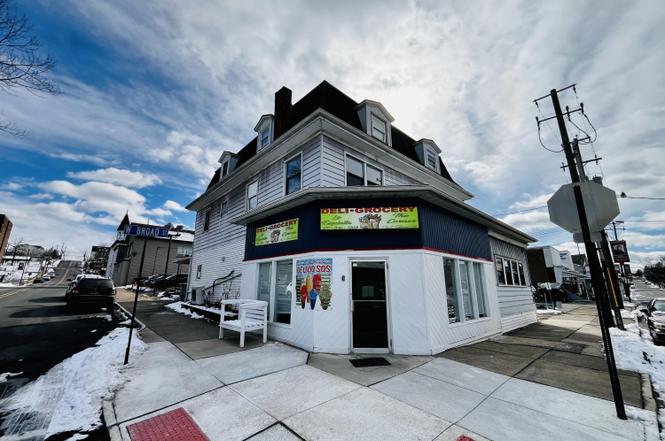
1 Broad St · Nanticoke, PA
Flood risk No data
- FEMA flood zone
- —
- Chance of flooding over 30 yrs
- —
- Est. flood insurance / yr
- —
Fire risk No data
- Est. fire insurance / yr
- —
Heat risk No data
- Hot days now (above threshold)
- —
- Hot days in 30 yrs
- —
Wind risk No data
- Chance of severe wind over 30 yrs
- —
Air-quality risk No data
- Unhealthy air days now
- —
- Unhealthy air days in 30 yrs
- —
Risk factors via First Street. Map © Google.
Why this score? — see what drove the B- grade
The composite is a weighted blend of 9 inputs, each scored 0–100. Each bar is that input's sub-score; the figure is the points it added to the 100-point composite (weight × sub-score).
- Cash flow +30.0/30.0
- 1% rule +10.0/10.0
- DSCR +10.0/10.0
- ARV discount +7.5/15.0
- Livability +3.7/5.0
- Rent growth +2.5/5.0
- Condition / age +2.5/5.0
- Schools +2.0/10.0
- Appreciation +0.0/10.0
$609,000
🖨 Deal sheet 📄 Offer letter ✓ Due diligence
Multi-family units
County records classify this as Multi-Family (5+ Unit). Listing-text estimate: 7 units. confirmed
5+ unit building — per-unit beds/baths from public records are typically unavailable; the breakdown below (if shown) is an estimate from the listing text.
Listing remarks MLS
Great investment property in a prime location. This multi-family building is zoned commercial and has 5 rental units. Plus commercial space on the first floor. There is off street parking and a 2 car garage. All measurements approximate.
Key facts
- Separate utilities
- Detached garage
- 2 garage spots
Tags
Property features AI
Exterior
- Parking: Detached garage; 2 garage spaces; On-street parking
- Utilities: Public water; Public sewer
- Home design: Multi-family residential income property; Commercial zoning
- Construction: Aluminum siding
- Exterior features: Patio; Corner property
Interior
- Heating & cooling: Electric heating; Natural gas heating; Baseboard heating
- Interior features: Basement with dirt floor
Neighborhood map
What this means for you Summary
Snapshot
- This is a 7 × 9-bed/?-bath units multifamily listed at $609k.
Deal economics
- At list price, monthly cash flow is $4k ($44k/yr) — positive. Per door: $519/mo.
- The deal already cash-flows at list — no discount required.
- Meets the 1% rule at list price ($10k rent vs $609k).
- Recommended offer: $572k (6.0% below list) — sets the bar for market timing.
- Cap rate 13.5% vs local median 6.3% in Nanticoke — top-decile yield for the area; either an underpriced asset or a hidden risk that comps aren't pricing in. Stress-test before assuming the spread holds.
Location & tenants
- Location reads 74/100 on livability (#520 in PA, #4,791 nationally) — a middle-class / working-renter tenant base. Strengths: cost of living A+, housing A+, health & safety A+; Watch: schools C-, commute F, employment D-.
- Greater Nanticoke Area SD (suburban): math 14% / reading 34% proficiency, ranked #479 of 539 in PA (top 89%) — low school quality limits family demand, transient renter base, plan for 1-2y turnover.
- Market conditions: 59 active listings in the ZIP; 349 units permitted in Luzerne County in 2024 (16 in 5+ unit buildings).
Forward outlook
- Local home prices are declining (-3.0%/yr); year-one equity from $4k of loan paydown is wiped out by about $18k of value loss. Plan a longer hold.
- Luzerne County population projected at +4% by 2050 — modest demand growth; plan on rents tracking national, not racing it.
- At projected returns (-3.0% appreciation + 3.0% rent growth), your $171k cash investment doubles in ~5 years — after that, you're playing with house money.
Negotiation context
- It's been on market 64 days — a 6% lower offer ($572k) is reasonable based on typical stale-listing flexibility.
- 7 sale attempts since 12y ago; this cycle's ask is 64005% above the opening price — seller raised mid-cycle; expect resistance to lowballs.
- Current owner paid $90k; list at $609k implies a 577% gain — meaningful room to come down on a strong offer.
Questions for the listing agent
- It's been on market 64 days. Have you received any prior offers? Is the seller open to a 6% concession, seller financing, or rate buy-down credit?
- Can we see the unit-by-unit rent roll, current vacancy, and any below-market leases? What's the average tenancy length?
- What capital expenditures (roof, boiler, parking lot, exteriors) have been made in the last 5 years, and what's planned in the next 2?
- Why hasn't it sold? Are there any deal-killer items the seller is aware of (foundation, flood, title, zoning, code violations)?
- Is there a deadline driving the sale (1031 exchange, divorce, estate, relocation)? That informs how much negotiation room exists.
- What's the average days-on-market for RENTAL listings here right now (not sales)? A rising rental-DOM trend means longer vacancies and softer asking-rent achievability than the comps imply.
- What's the recent tenant-quality profile in this submarket — average credit score on applications, eviction rate, late-payment / NSF rate, and stable-employment percentage? A property-management company in the area should have these aggregated.
- How much new apartment / multifamily construction is in the pipeline within 1–3 miles? Heavy new supply (>2% of stock underway) typically softens rents 12–24 months out; light construction supports rent growth.
Investment metrics
- 1% rule
- 1.63% ✓
- Cap rate
- 13.45%
- Cash-on-cash
- 25.57%
- DSCR
- 2.14
- GRM
- 5.1
CMA / ARV
No comps found within radius.
Projected returns pro-forma
-3.0% appreciation · 3.0% rent growth · sell at horizon
- IRR
- 19.2%
- Equity multiple
- 1.78×
- Total profit
- $132,896
- Equity at exit
- $90,804
- IRR
- 27.5%
- Equity multiple
- 3.43×
- Total profit
- $414,335
- Equity at exit
- $52,655
Cash invested: $170,520 (down + closing). Projections, not guarantees.
Landlord ↔ Tenant lean methodology
- Overall (STATE)
- 62 Landlord-Friendly
- State Pennsylvania
- 62 Landlord-Friendly · EVEN
- County
- — inherits STATE
- City
- — inherits STATE
ZIP-level market 18634
- Home prices YoY
- -29.1%
- Active inventory
- 59
- Price-to-rent
- 35.8×
Monthly cashflow live
- Estimated rent
- $9,927 medium interval (Pro) →
- Mortgage (P&I)
- −$3,194
- Tax est. 1.5%
- −$761 /mo · $9,135/yr
- Insurance
- −$254
- HOA
- −$0
- Vacancy / Maint / Mgmt
- −$2,085
- Net cashflow
- $3,634
Break-even live
7-unit breakdown (identical units grouped — click to expand)
| Units | Beds | Baths | Est. rent |
|---|---|---|---|
| 7× units | 9 | — | $9,926 |
| #1 | 9 | — | $1,418 |
| #2 | 9 | — | $1,418 |
| #3 | 9 | — | $1,418 |
| #4 | 9 | — | $1,418 |
| #5 | 9 | — | $1,418 |
| #6 | 9 | — | $1,418 |
| #7 | 9 | — | $1,418 |
| Total (7 units) | $9,927 | ||
UW: 25.0% down · 7.5% · 30yr · 1.5% tax · 5.0% vac · 8.0% maint · 8.0% mgmt
Financing live
Cash to close
- Down payment
- $152,250
- Closing costs
- $18,270
- Reserves months
- —
- Total cash needed
- —
Loan-product check · same deal, 3 products live
Conventional
25% down · 7.5% · 30yr
- Down + closing
- —
- Monthly P&I
- —
- Monthly cashflow
- —
- DSCR
- —
- Eligible?
- —
Personal DTI + credit; lowest rate.
DSCR
20% down · 8.5% · 30yr
- Down + closing
- —
- Monthly P&I
- —
- Monthly cashflow
- —
- DSCR
- —
- Eligible?
- —
No personal income docs; deal must DSCR.
Hard money
10% down · 12.0% · 12mo
- Down + closing
- —
- Monthly P&I
- —
- Monthly cashflow
- —
- DSCR
- —
- Eligible?
- —
Short-term bridge; refi at stabilization.
Listing history 17 events
-
2026-05-07historical $950
-
2026-05-07historical $950
-
2026-05-01status Pending
-
2026-03-20$950
-
2026-02-25$609,000 Active
-
2026-01-14price $900
-
2025-10-02$850
-
2025-10-01historical $850
-
2025-09-23historical $850
-
2025-06-28price $850
-
2025-03-25$900
-
2025-03-15$900
-
2024-07-31historical $850
-
2024-07-23price $575,000
-
2024-06-17$850
-
2014-12-15soldstatus $90,000 237-char remark
Show marketing remark (237 chars)
Great investment property in a prime location. This multi-family building is zoned commercial and has 5 rental units. Plus commercial space on the first floor. There is off street parking and a 2 car garage. All measurements approximate.
-
2014-11-20$119,000 237-char remark
Show marketing remark (237 chars)
Great investment property in a prime location. This multi-family building is zoned commercial and has 5 rental units. Plus commercial space on the first floor. There is off street parking and a 2 car garage. All measurements approximate.
ⓘ Source: listings_history table (triggers on properties + properties_extension) + one-shot
backfill from property_details.listing_events for pre-trigger history.
Nearby sold comps map
Loading sold comps map…
Walkable amenities ~0.75 mi
Loading nearby amenities…
Taxation est. · year 1
- Rental income
- $119,124
- − Mortgage interest
- −$34,113
- − Property taxes
- −$9,135
- − Insurance
- −$3,045
- − Repairs & maintenance
- −$9,530
- − Management
- −$9,530
- − Depreciation
- −$17,716
- Taxable income
- $36,054
- Est. tax owed @ 24.0%
- −$8,653
- After-tax cash flow
- $34,951/yr
For passive investors: Depreciation is non-cash, so a rental often shows a tax loss while cash-flowing — sheltering income. Rental losses are passive: they offset passive income freely, and up to $25,000/yr can offset ordinary (W-2) income if you actively participate and your MAGI is under $100k (phasing out to $0 by $150k); unused losses carry forward. On sale, claimed depreciation is recaptured at up to 25%, and gains may owe capital-gains tax (a 1031 exchange can defer both). Figures are a year-1 estimate at your 24.0% rate — not tax advice; consult a CPA.
Schools (NCES district)
- District
- Greater Nanticoke Area SD
- NCES district ID
- 4216290
- Math proficiency
- 14% ▼ -8.00%
- Reading proficiency
- 34% ▼ -14.00%
- Median HH income
- $38,990
- Composite
- 20.1/100
- National rank
- #8647
- State rank
- #479 of 539 in PA
Livability — Nanticoke
- Score
- 74/100
- State rank
- #520
- US rank
- #4791
Category grades
Schools grade is shown separately in the Schools card above.
Census & demographics
- Census place
- Nanticoke, PA
- Population (ZIP)
- 13,638
Population outlook (Luzerne County) Hauer SSP2
- Today (2025)
- 319,505 people
- By 2030
- 319,943 · +0.1%
- By 2040
- 322,643 · +1.0%
- By 2050
- 330,817 · +3.5%
- By 2075
- 379,145 · +18.7%
- By 2100
- 431,908 · +35.2%
Race, ethnicity, and origin ACS 2023
- Neighborhood character
- Predominantly White (82%)
- Race & ethnicity
- White 82% Hispanic / Latino 10% Two or more races 7% Black 6%
- Hispanic origin (detail)
- Mexican 2% Puerto Rican 3% Dominican 3%
- Common ancestry
- Romanian 31% Polish 3% Hispanic 2%
- Foreign-born
- 3% · Canada, Jamaica
- Languages at home
- 91% English-only · Spanish 7% French/Haitian/Cajun 2%
Political lean MEDSL · Luzerne
- 2024 margin
- R (+19.2) · D 40.0% · R 59.2%
- 2008→2024 swing
- -27.6pp toward R · 2008: 8.4pp · 2024: -19.2pp
- All cycles
- 2024: R+19.2 2020: R+14.4 2016: R+19.6 2012: D+4.8 2008: D+8.4
Not yet ingested
- Civics
- —
Market trends
- HPI YoY
- ▼ -101.20%
- Current HPI
- 246.8063
- Rent YoY
- —
- Metro
- —
- State GDP YoY
- ▲ 1.68%
- F500 in state
- 34
Industry mix (Fortune 500 HQ in PA)
| Industry | F500 HQs | Revenue |
|---|---|---|
| Healthcare | 2 | $309B |
|
||
| Insurance | 2 | $27B |
|
||
| Telecommunications / Media | 1 | $124B |
|
||
| Industrial Distribution | 1 | $22B |
|
||
| Financial Services | 1 | $20B |
|
||
| Chemicals / Materials | 1 | $18B |
|
||
Price history
+411.8% since first listed17 events — show timeline
- 2026-05-07 Rental Removed $950 RENTEC
- 2026-05-07 Rental Removed $950 RENTEC
- 2026-05-01 Pending — LCAR
- 2026-03-20 Listed for Rent $950 RENTEC
- 2026-02-25 Listed $609,000 LCAR
- 2026-01-14 Price Changed $900 RENTEC
- 2025-10-02 Listed for Rent $850 RENTEC
- 2025-10-01 Rental Removed $850 LCAR
- 2025-09-23 Rental Removed $850 RENTEC
- 2025-06-28 Price Changed $850 LCAR
- 2025-03-25 Listed for Rent $900 LCAR
- 2025-03-15 Listed for Rent $900 RENTEC
- 2024-07-31 Rental Removed $850 LCAR
- 2024-07-23 Price Changed $575,000 LCAR
- 2024-06-17 Listed for Rent $850 LCAR
- 2014-12-15 Sold (MLS) $90,000 LCAR
- 2014-11-20 Listed $119,000 LCAR
Cash-flow waterfall
monthlySold comps — $/sqft
last 12 mo · ≤1 miLoading sold comps…