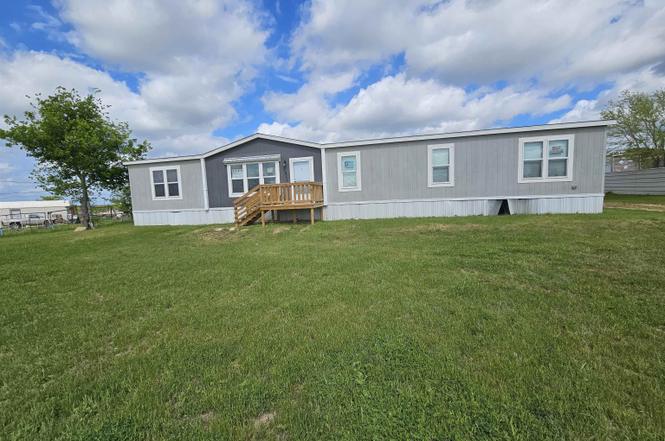
811 NE Front St · Millsap, TX
Flood risk 1/10 · Minimal
- FEMA flood zone
- X (unshaded)
- Chance of flooding over 30 yrs
- 0.0%
- Est. flood insurance / yr
- $507 – $1,088
Fire risk 7/10 · Major
- Est. fire insurance / yr
- $1,222 – $2,270
Heat risk 7/10 · Major
- Hot days now (above 109°F)
- 7 days/yr
- Hot days in 30 yrs
- 22 days/yr
Wind risk 4/10 · Minor
- Chance of severe wind over 30 yrs
- 21.0%
Air-quality risk 2/10 · Minimal
- Unhealthy air days now
- 1 days/yr
- Unhealthy air days in 30 yrs
- 2 days/yr
Risk factors via First Street. Map © Google.
Why this score? — see what drove the D- grade
The composite is a weighted blend of 9 inputs, each scored 0–100. Each bar is that input's sub-score; the figure is the points it added to the 100-point composite (weight × sub-score).
- Cash flow +10.6/30.0
- ARV discount +7.5/15.0
- 1% rule +5.0/10.0
- Schools +4.4/10.0
- DSCR +3.1/10.0
- Livability +3.0/5.0
- Rent growth +2.5/5.0
- Condition / age +2.5/5.0
- Appreciation +0.0/10.0
$169,900
🖨 Deal sheet 📄 Offer letter ✓ Due diligence
Listing remarks
2021 Jessup Manufactured home in the Millsap City Limits on a 1 acre lot. This home features four or five bedrooms, two baths, 2368 sqft, AC vents in the ceiling, smart panel siding, ceiling beams, thermopane windows, ceiling fans, big kitchen island, walk-in pantry, huge closet in the MBR, game room that could be fifth bedroom, soaker tub & separate shower, and a huge utility room complete with sink and folding counter. Refurbed and move-in ready!
Key facts
- Smart panel siding
- Big kitchen island
- 1 acre lot
Tags
Property features AI
Finance
- Other: Directions: From Millsap go E on NE Front St. Property on left
- Financial info: Annual tax amount reported
- HOA & community: HOA information not provided
Exterior
- Parking: Parking details not provided
- Security: Information not provided
- Utilities: Electric water heater (interior); Utility details not otherwise provided
- Home design: Manufactured home; Single-story
- Construction: Construction details not provided
- Exterior features: Located in the Castaneda Acres subdivision; Lot is approximately 1 acre
Interior
- Kitchen: Appliances not specifically listed
- Bedrooms: Information not provided
- Flooring: Information not provided
- Bathrooms: 2 full bathrooms
- Heating & cooling: Central heating; Electric heating; Central air conditioning
- Interior features: Electric water heater; 8 total rooms
- Laundry & utility: Washer/dryer information not provided
Neighborhood map
What this means for you Summary
Snapshot
- This is a 5-bed/2.0-bath manufactured listed at $170k.
Deal economics
- At list price, monthly cash flow is $-83 ($-990/yr) — negative.
- To cash-flow at today's rent, offer at most $155k (8.6% below list).
- Meets the 1% rule at list price ($2k rent vs $170k).
- Recommended offer: $150k (12.0% below list) — sets the bar for market timing.
- Cap rate 5.7% vs local median 1.3% in Millsap — top-decile yield for the area; either an underpriced asset or a hidden risk that comps aren't pricing in. Stress-test before assuming the spread holds.
Location & tenants
- Location reads 60/100 on livability (#1,044 in TX) — a middle-class / working-renter tenant base. Strengths: cost of living A+, housing A+; Watch: schools D+, health & safety D+, crime D-.
- Millsap ISD (rural): math 53% / reading 49% proficiency, ranked #147 of 826 in TX (top 18%) — acceptable for families but not a draw, mixed tenant base, ~2y average lease.
- Market conditions: 70 active listings in the ZIP; 437 units permitted in Parker County in 2024 (0 in 5+ unit buildings).
Forward outlook
- Local home prices are declining (-3.0%/yr); year-one equity from $1k of loan paydown is wiped out by about $5k of value loss. Plan a longer hold.
- Parker County population projected at +32% by 2050 — long-run rental-demand tailwind backs the buy-and-hold thesis.
Negotiation context
- It's been on market 197 days — a 12% lower offer ($150k) is reasonable based on typical stale-listing flexibility.
- 6 sale attempts since 5y ago; this cycle's ask has dropped $60k (26%) from the opening price — seller is motivated, your offer sets the floor, not the list.
Risks & watch-outs
- Watch-outs: property tax is 3.3% of price.
- Climate carrying-cost: major wildfire risk; extreme-heat days projected 7→22/yr by 2055 (HVAC capex compounding) — expect insurance premiums to compound above CPI over the hold.
Questions for the listing agent
- What do current leases actually rent for vs. the listed asking? Can we see a recent rent roll and the last 12 months of T-12 income?
- It's been on market 197 days. Have you received any prior offers? Is the seller open to a 12% concession, seller financing, or rate buy-down credit?
- Property tax is high relative to price — has the assessment been appealed recently, and will the sale trigger a re-assessment?
- Why hasn't it sold? Are there any deal-killer items the seller is aware of (foundation, flood, title, zoning, code violations)?
- Is there a deadline driving the sale (1031 exchange, divorce, estate, relocation)? That informs how much negotiation room exists.
- Schools are D-rated, which usually means shorter tenancies and higher turnover. Who's the typical renter profile here, and what's been the actual vacancy rate?
- Crime grade is D in this area — have there been break-ins, vandalism, or insurance claims at this property in the last 3 years? What carrier currently insures it and at what premium?
- The area grade is low — what's the realistic commute time and amenity access for the typical tenant pool here? Any planned neighborhood developments (good or bad) we should know about?
- What's the average days-on-market for RENTAL listings here right now (not sales)? A rising rental-DOM trend means longer vacancies and softer asking-rent achievability than the comps imply.
- What's the recent tenant-quality profile in this submarket — average credit score on applications, eviction rate, late-payment / NSF rate, and stable-employment percentage? A property-management company in the area should have these aggregated.
- How much new for-sale + rental construction is in the pipeline within 1–3 miles? Heavy new supply typically softens prices + rents 12–24 months out; constrained supply supports both.
Investment metrics
- 1% rule
- 1.00% ✓
- Cap rate
- 5.71%
- Cash-on-cash
- -2.08%
- DSCR
- 0.91
- GRM
- 8.3
CMA / ARV
No comps found within radius.
Projected returns pro-forma
-3.0% appreciation · 3.0% rent growth · sell at horizon
- IRR
- -19.6%
- Equity multiple
- 0.31×
- Total profit
- $-32,606
- Equity at exit
- $25,333
- IRR
- -12.1%
- Equity multiple
- 0.28×
- Total profit
- $-34,426
- Equity at exit
- $14,690
Cash invested: $47,572 (down + closing). Projections, not guarantees.
Landlord ↔ Tenant lean methodology
- Overall (STATE)
- 87 Strongly Landlord-Friendly
- State Texas
- 87 Strongly Landlord-Friendly · R+5
- County
- — inherits STATE
- City
- — inherits STATE
ZIP-level market 76066
- Active inventory
- 70
- Price-to-rent
- 8.3×
Monthly cashflow live
- Estimated rent
- $1,702 medium interval (Pro) →
- Mortgage (P&I)
- −$891
- Tax from tax record
- −$465 /mo · $5,580/yr
- Insurance
- −$71
- HOA
- −$0
- Vacancy / Maint / Mgmt
- −$357
- Net cashflow
- $-83
Break-even live
UW: 25.0% down · 7.5% · 30yr · 1.5% tax · 5.0% vac · 8.0% maint · 8.0% mgmt
Financing live
Cash to close
- Down payment
- $42,475
- Closing costs
- $5,097
- Reserves months
- —
- Total cash needed
- —
Loan-product check · same deal, 3 products live
Conventional
25% down · 7.5% · 30yr
- Down + closing
- —
- Monthly P&I
- —
- Monthly cashflow
- —
- DSCR
- —
- Eligible?
- —
Personal DTI + credit; lowest rate.
DSCR
20% down · 8.5% · 30yr
- Down + closing
- —
- Monthly P&I
- —
- Monthly cashflow
- —
- DSCR
- —
- Eligible?
- —
No personal income docs; deal must DSCR.
Hard money
10% down · 12.0% · 12mo
- Down + closing
- —
- Monthly P&I
- —
- Monthly cashflow
- —
- DSCR
- —
- Eligible?
- —
Short-term bridge; refi at stabilization.
Listing history 17 events
-
2026-04-25status Pending
-
2026-04-06status Active
-
2026-04-06price $169,900
-
2026-03-23price $179,900
-
2026-03-02price $189,900
-
2026-01-30price $199,900
-
2026-01-12price $209,900
-
2025-10-03$229,900 Active
-
2025-07-08price $234,900
-
2025-04-22price $249,900
-
2025-04-02$259,900 Active
-
2024-09-16$269,900 Active
-
2024-03-23$250,000 Active
-
2023-03-31soldstatus
-
2021-11-15historical
-
2021-08-30price $68,000
-
2021-07-22$69,000 Active
ⓘ Source: listings_history table (triggers on properties + properties_extension) + one-shot
backfill from property_details.listing_events for pre-trigger history.
Tax reassessment forecast TX · Resets to sale price
- Current annual tax
- $5,580 · $465/mo
- Projected year-2 tax
- $5,580 · $465/mo
- Expected delta
- $0/yr ($0/mo · 0.0%)
ⓘ Screening estimate from a state-policy table — verify with the county assessor before closing.
Climate risk First Street
- Flood 1/10 Low FEMA zone X (unshaded) · 0% chance over 30 yrs
- Wildfire 7/10 Severe
- Heat 7/10 Severe 7 d/yr ≥109°F today · 22 d/yr by 30 yrs out
- Wind 4/10 Moderate 21% chance of damaging wind over 30 yrs
- Air quality 2/10 Low 1 unhealthy d/yr today · 2 by 30 yrs out
Nearby sold comps map
Loading sold comps map…
Walkable amenities ~0.75 mi
Loading nearby amenities…
Taxation est. · year 1
- Rental income
- $20,419
- − Mortgage interest
- −$9,517
- − Property taxes
- −$5,580
- − Insurance
- −$850
- − Repairs & maintenance
- −$1,633
- − Management
- −$1,633
- − Depreciation
- −$4,943
- Taxable loss
- −$3,737
- Est. tax savings @ 24.0%
- +$897
- After-tax cash flow
- $-93/yr
For passive investors: Depreciation is non-cash, so a rental often shows a tax loss while cash-flowing — sheltering income. Rental losses are passive: they offset passive income freely, and up to $25,000/yr can offset ordinary (W-2) income if you actively participate and your MAGI is under $100k (phasing out to $0 by $150k); unused losses carry forward. On sale, claimed depreciation is recaptured at up to 25%, and gains may owe capital-gains tax (a 1031 exchange can defer both). Figures are a year-1 estimate at your 24.0% rate — not tax advice; consult a CPA.
Schools (NCES district)
- District
- Millsap ISD
- NCES district ID
- 4830870
- Math proficiency
- 53% ▼ -2.00%
- Reading proficiency
- 49% ▲ 2.00%
- Median HH income
- $55,988
- Composite
- 44.21/100
- National rank
- #2850
- State rank
- #147 of 826 in TX
Livability — Millsap
- Score
- 60/100
- State rank
- #1044
- US rank
- #18563
Category grades
Schools grade is shown separately in the Schools card above.
Census & demographics
- Population (ZIP)
- 5,615
Population outlook (Parker County) Hauer SSP2
- Today (2025)
- 147,426 people
- By 2030
- 157,863 · +7.1%
- By 2040
- 177,519 · +20.4%
- By 2050
- 194,786 · +32.1%
- By 2075
- 238,799 · +62.0%
- By 2100
- 264,126 · +79.2%
Race, ethnicity, and origin ACS 2023
- Neighborhood character
- Predominantly White (79%)
- Race & ethnicity
- White 79% Two or more races 19% Hispanic / Latino 15%
- Hispanic origin (detail)
- Mexican 9%
- Common ancestry
- Italian 2% European 2% Scotch-Irish 1%
- Foreign-born
- 6% · Canada
- Languages at home
- 90% English-only · Spanish 10%
Political lean MEDSL · Parker
- 2024 margin
- Solid R (+66.4) · D 16.4% · R 82.8%
- 2008→2024 swing
- -11.2pp toward R · 2008: -55.2pp · 2024: -66.4pp
- All cycles
- 2024: R+66.4 2020: R+64.4 2016: R+67.5 2012: R+65.8 2008: R+55.2
Not yet ingested
- Civics
- —
Market trends
- HPI YoY
- ▼ -81.09%
- Current HPI
- 140.3208
- Rent YoY
- —
- Metro
- —
- State GDP YoY
- ▲ 3.95%
- F500 in state
- 110
Industry mix (Fortune 500 HQ in TX)
| Industry | F500 HQs | Revenue |
|---|---|---|
| Energy | 16 | $1,198B |
|
||
| Technology | 5 | $198B |
|
||
| Engineering / Construction | 4 | $72B |
|
||
| Energy Services | 3 | $60B |
|
||
| Utilities | 3 | $41B |
|
||
| Healthcare | 2 | $330B |
|
||
Price history
+146.2% since first listed17 events — show timeline
- 2026-04-25 Pending — LAAR
- 2026-04-06 Relisted — LAAR
- 2026-04-06 Price Changed $169,900 LAAR
- 2026-03-23 Price Changed $179,900 LAAR
- 2026-03-02 Price Changed $189,900 LAAR
- 2026-01-30 Price Changed $199,900 LAAR
- 2026-01-12 Price Changed $209,900 LAAR
- 2025-10-03 Listed $229,900 LAAR
- 2025-07-08 Price Changed $234,900 LAAR
- 2025-04-22 Price Changed $249,900 LAAR
- 2025-04-02 Listed $259,900 LAAR
- 2024-09-16 Listed $269,900 LAAR
- 2024-03-23 Listed $250,000 NTREIS
- 2023-03-31 Sold (Public Records) — Public Records
- 2021-11-15 Listing Removed — NTREIS
- 2021-08-30 Price Changed $68,000 NTREIS
- 2021-07-22 Listed $69,000 NTREIS
Property tax history
+70.3%/yrLatest (2025): $5,580 · +38.6% YoY. Source: county tax records.
Cash-flow waterfall
monthlySold comps — $/sqft
last 12 mo · ≤1 miLoading sold comps…