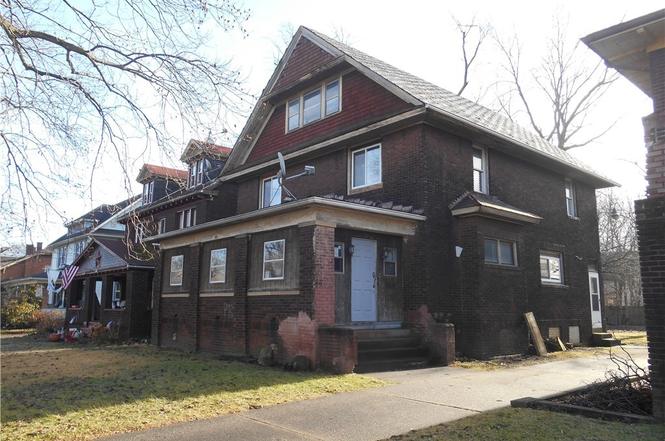
413 Alameda Ave · Youngstown, OH
Flood risk 1/10 · Minimal
- FEMA flood zone
- X (unshaded)
- Chance of flooding over 30 yrs
- 0.0%
- Est. flood insurance / yr
- $473 – $860
Fire risk 1/10 · Minimal
- Est. fire insurance / yr
- $713 – $1,323
Heat risk 3/10 · Minor
- Hot days now (above 97°F)
- 6 days/yr
- Hot days in 30 yrs
- 15 days/yr
Wind risk 1/10 · Minimal
- Chance of severe wind over 30 yrs
- —
Air-quality risk 2/10 · Minimal
- Unhealthy air days now
- 1 days/yr
- Unhealthy air days in 30 yrs
- 2 days/yr
Risk factors via First Street. Map © Google.
Why this score? — see what drove the B+ grade
The composite is a weighted blend of 9 inputs, each scored 0–100. Each bar is that input's sub-score; the figure is the points it added to the 100-point composite (weight × sub-score).
- Cash flow +30.0/30.0
- 1% rule +10.0/10.0
- DSCR +10.0/10.0
- Appreciation +8.4/10.0
- ARV discount +7.5/15.0
- Livability +4.0/5.0
- Rent growth +2.5/5.0
- Condition / age +2.5/5.0
- Schools +0.9/10.0
$30,000
🖨 Deal sheet 📄 Offer letter ✓ Due diligence
Listing remarks
Spacious Historic North Side Home with Endless Potential This substantial 5-bedroom, 2.5-bath brick home offers over 2,000 square feet of living space on a 7,492 sq ft lot, located in Youngstown’s sought-after Historic North Side District. Featuring generously sized rooms and two fireplaces, the layout provides a solid foundation for a full renovation or value-add project. The interior is currently being cleared, making the property ready for immediate renovation. Outside, the all-brick exterior offers timeless character, while the yard is clean, cleared, and well maintained. Major infrastructure updates include a new city-installed water main in 2025, adding long-term value and pe
Key facts
- Clean cleared yard
- Two fireplaces
- All-brick exterior
Tags
Neighborhood map
What this means for you Summary
Snapshot
- This is a 5-bed/1.5-bath single-family listed at $30k.
Deal economics
- At list price, monthly cash flow is $448 ($5k/yr) — positive.
- The deal already cash-flows at list — no discount required.
- Meets the 1% rule at list price ($820 rent vs $30k).
- Recommended offer: $27k (9.0% below list) — sets the bar for market timing.
- Cap rate 24.2% vs local median 7.0% in Youngstown — top-decile yield for the area; either an underpriced asset or a hidden risk that comps aren't pricing in. Stress-test before assuming the spread holds.
Location & tenants
- Location reads 81/100 on livability (#99 in OH, #1,506 nationally) — a professional / high-income tenant draw. Strengths: amenities A+, commute A+, cost of living A+; Watch: crime F, employment F.
- Youngstown City (urban): math 8% / reading 17% proficiency, ranked #649 of 656 in OH (top 99%) — low school quality limits family demand, transient renter base, plan for 1-2y turnover; 88% free/reduced lunch — lower-income household profile, screen leases tightly.
- Market conditions: 28 active listings in the ZIP; 1 comparable units currently listed for rent nearby; lower-income renter base — watch delinquency; 147 units permitted in Mahoning County in 2024 (0 in 5+ unit buildings).
Forward outlook
- In year one you build about $2k of equity ($207 loan paydown + $2k appreciation (6.7% local appreciation)).
- Mahoning County population projected at -14% by 2050 — secular population decline; favor cash flow + early exit over multi-decade hold.
- At projected returns (6.7% appreciation + 3.0% rent growth), your $8k cash investment doubles in ~2 years — after that, you're playing with house money.
Negotiation context
- It's been on market 106 days — a 9% lower offer ($27k) is reasonable based on typical stale-listing flexibility.
- 5 sale attempts since 22y ago; this cycle's ask has dropped $25k (45%) from the opening price — seller is motivated, your offer sets the floor, not the list.
- Current owner paid $18k; list at $30k implies a 63% gain — meaningful room to come down on a strong offer.
Risks & watch-outs
- Watch-outs: built in 1919 — expect roof / HVAC / electrical / plumbing capex.
Questions for the listing agent
- It's been on market 106 days. Have you received any prior offers? Is the seller open to a 9% concession, seller financing, or rate buy-down credit?
- Built in 1919 — when were the roof, HVAC, electrical panel, plumbing, and water heater last replaced?
- Why hasn't it sold? Are there any deal-killer items the seller is aware of (foundation, flood, title, zoning, code violations)?
- Is there a deadline driving the sale (1031 exchange, divorce, estate, relocation)? That informs how much negotiation room exists.
- Crime grade is F in this area — have there been break-ins, vandalism, or insurance claims at this property in the last 3 years? What carrier currently insures it and at what premium?
- What's the average days-on-market for RENTAL listings here right now (not sales)? A rising rental-DOM trend means longer vacancies and softer asking-rent achievability than the comps imply.
- What's the recent tenant-quality profile in this submarket — average credit score on applications, eviction rate, late-payment / NSF rate, and stable-employment percentage? A property-management company in the area should have these aggregated.
- How much new for-sale + rental construction is in the pipeline within 1–3 miles? Heavy new supply typically softens prices + rents 12–24 months out; constrained supply supports both.
Investment metrics
- 1% rule
- 2.73% ✓
- Cap rate
- 24.22%
- Cash-on-cash
- 64.01%
- DSCR
- 3.85
- GRM
- 3.0
CMA / ARV
- ARV (on-the-fly)
- $191,808
- Comps found
- 12
Show comp detail 12 sales within ~0.75 mi
| Address | Dist | Beds/Ba | Sqft | Sold | Price | $/sf | Match |
|---|---|---|---|---|---|---|---|
| 381 Catalina Ave | 0.08mi | 5/2.5 | 2,508 (-6%) | 15mo | $218,000 | $87 | 70 |
| 524 Tod Ln | 0.37mi | 5/2.0 | 2,707 (+2%) | 18mo | $229,000 | $85 | 63 |
| 1849 Coronado Ave | 0.36mi | 5/3.5 | 2,718 (+2%) | 19mo | $169,900 | $63 | 56 |
| 2058 Guadalupe Ave | 0.43mi | 4/2.5 (-1) | 2,482 (-7%) | 7mo | $183,000 | $74 | 54 |
| 2220 Goleta Ave | 0.45mi | 4/1.5 (-1) | 2,414 (-9%) | 6mo | $175,000 | $72 | 53 |
| 249 N Heights Ave | 0.51mi | 4/3.5 (-1) | 2,812 (+6%) | 5mo | $165,000 | $59 | 49 |
| 1723 Ford Ave | 0.17mi | 4/1.0 (-1) | 2,344 (-12%) | 19mo | $153,000 | $65 | 49 |
| 1332 Elm St | 0.64mi | 5/1.0 | 2,866 (+8%) | 20mo | $29,000 | $10 | 39 |
| 1829 Coronado Ave | 0.32mi | 6/4.0 (+1) | 3,056 (+15%) | 10mo | $230,000 | $75 | 37 |
| 1328 Elm St | 0.64mi | 6/3.5 (+1) | 2,488 (-7%) | 16mo | $85,000 | $34 | 32 |
| 1868 Coronado Ave | 0.39mi | 4/2.5 (-1) | 3,032 (+14%) | 23mo | $61,900 | $20 | 31 |
| 2322 Selma Ave | 0.64mi | 5/2.5 | 2,309 (-13%) | 23mo | $211,000 | $91 | 25 |
Match score weights: distance 35% · size 25% · config 20% · recency 20%. Top-matched comps best support the ARV.
Projected returns pro-forma
6.72% appreciation · 3.0% rent growth · sell at horizon
- IRR
- 72.4%
- Equity multiple
- 5.58×
- Total profit
- $38,509
- Equity at exit
- $20,245
- IRR
- 69.0%
- Equity multiple
- 11.79×
- Total profit
- $90,657
- Equity at exit
- $37,973
Cash invested: $8,400 (down + closing). Projections, not guarantees.
Landlord ↔ Tenant lean methodology
- Overall (STATE)
- 73 Landlord-Friendly
- State Ohio
- 73 Landlord-Friendly · R+6
- County
- — inherits STATE
- City
- — inherits STATE
ZIP-level market 44504
- Home prices YoY
- 4.0%
- Active inventory
- 28
- Price-to-rent
- 3.0×
Monthly cashflow live
- Estimated rent
- $820 medium interval (Pro) →
- Mortgage (P&I)
- −$157
- Tax from tax record
- −$30 /mo · $359/yr
- Insurance
- −$12
- HOA
- −$0
- Vacancy / Maint / Mgmt
- −$172
- Net cashflow
- $448
Break-even live
UW: 25.0% down · 7.5% · 30yr · 1.5% tax · 5.0% vac · 8.0% maint · 8.0% mgmt
Financing live
Cash to close
- Down payment
- $7,500
- Closing costs
- $900
- Reserves months
- —
- Total cash needed
- —
Loan-product check · same deal, 3 products live
Conventional
25% down · 7.5% · 30yr
- Down + closing
- —
- Monthly P&I
- —
- Monthly cashflow
- —
- DSCR
- —
- Eligible?
- —
Personal DTI + credit; lowest rate.
DSCR
20% down · 8.5% · 30yr
- Down + closing
- —
- Monthly P&I
- —
- Monthly cashflow
- —
- DSCR
- —
- Eligible?
- —
No personal income docs; deal must DSCR.
Hard money
10% down · 12.0% · 12mo
- Down + closing
- —
- Monthly P&I
- —
- Monthly cashflow
- —
- DSCR
- —
- Eligible?
- —
Short-term bridge; refi at stabilization.
Rent comps 1 comps
| Address | Beds | Baths | Sqft | Rent | $/sqft | DOM | Units | Dist |
|---|---|---|---|---|---|---|---|---|
| 351 Lincoln Ave Youngstown, OH | 3.0–5.0 | 3.0–5.0 | 1527 | $820 | $0.54 | 13d | 10 | 1.12mi |
Listing history 20 events
-
2026-06-03status $30,000 Pending 106 DOM
-
2026-06-02days on market $30,000 Active 106 DOM
-
2026-06-01days on market $30,000 Active 105 DOM
-
2026-05-31days on market $30,000 Active 104 DOM
-
2026-05-30pricedays on market $30,000 Active 103 DOM
-
2026-05-12status Pending
-
2026-04-20price $40,000
-
2026-02-01$55,000 Active
-
2025-12-12historical
-
2025-06-16$55,000 Active
-
2025-05-08historical
-
2024-11-26price $55,000
-
2024-11-11$57,000 Active
-
2007-11-30historical
-
2007-05-31$30,000
-
2005-04-21soldstatus $18,400
-
2005-03-07historical
-
2004-12-07$22,900
-
1994-06-23soldstatus $16,000
-
1988-08-01soldstatus $16,000
ⓘ Source: listings_history table (triggers on properties + properties_extension) + one-shot
backfill from property_details.listing_events for pre-trigger history.
Tax reassessment forecast OH · Partial reset (capped growth)
- Current annual tax
- $359 · $30/mo
- Projected year-2 tax
- $414 · $34/mo
- Expected delta
- +$54/yr (+$5/mo · 15.2%)
ⓘ Screening estimate from a state-policy table — verify with the county assessor before closing.
Climate risk First Street
- Flood 1/10 Low FEMA zone X (unshaded) · 0% chance over 30 yrs
- Wildfire 1/10 Low
- Heat 3/10 Moderate 6 d/yr ≥97°F today · 15 d/yr by 30 yrs out
- Wind 1/10 Low
- Air quality 2/10 Low 1 unhealthy d/yr today · 2 by 30 yrs out
Nearby sold comps map
Loading sold comps map…
Walkable amenities ~0.75 mi
Loading nearby amenities…
Taxation est. · year 1
- Rental income
- $9,840
- − Mortgage interest
- −$1,680
- − Property taxes
- −$359
- − Insurance
- −$150
- − Repairs & maintenance
- −$787
- − Management
- −$787
- − Depreciation
- −$873
- Taxable income
- $5,203
- Est. tax owed @ 24.0%
- −$1,249
- After-tax cash flow
- $4,128/yr
For passive investors: Depreciation is non-cash, so a rental often shows a tax loss while cash-flowing — sheltering income. Rental losses are passive: they offset passive income freely, and up to $25,000/yr can offset ordinary (W-2) income if you actively participate and your MAGI is under $100k (phasing out to $0 by $150k); unused losses carry forward. On sale, claimed depreciation is recaptured at up to 25%, and gains may owe capital-gains tax (a 1031 exchange can defer both). Figures are a year-1 estimate at your 24.0% rate — not tax advice; consult a CPA.
Schools (NCES district)
- District
- Youngstown City
- NCES district ID
- 3904516
- Math proficiency
- 8% ▼ -15.00%
- Reading proficiency
- 17% ▼ -10.00%
- Median HH income
- $25,257
- Composite
- 9.29/100
- National rank
- #9858
- State rank
- #649 of 656 in OH
Livability — Youngstown
- Score
- 81/100
- State rank
- #99
- US rank
- #1506
Category grades
Schools grade is shown separately in the Schools card above.
Census & demographics
- Census place
- Youngstown, OH
- County
- Mahoning · 224,175 people
- City population
- 28,503
- Metro
- Youngstown-Warren, OH
- Population (ZIP)
- 5,185
- Household income
- $40,156
- Rent vs Own
- Severe rent burden
- 15.7
Population outlook (Mahoning County) Hauer SSP2
- Today (2025)
- 223,932 people
- By 2030
- 218,387 · -2.5%
- By 2040
- 205,367 · -8.3%
- By 2050
- 193,606 · -13.5%
- By 2075
- 173,694 · -22.4%
- By 2100
- 151,147 · -32.5%
Race, ethnicity, and origin ACS 2023
- Neighborhood character
- Diverse neighborhood (Simpson 0.65)
- Race & ethnicity
- White 45% Black 38% Two or more races 8% Asian 5% Hispanic / Latino 4%
- Common ancestry
- Italian 4% Serbian 1% Romanian 1%
- Foreign-born
- 7% · Canada, Dominican Republic, South Korea
- Languages at home
- 93% English-only · Other Indo-European 4% Spanish 1%
Political lean MEDSL · Mahoning
- 2024 margin
- Lean R (+9.4) · D 44.9% · R 54.4%
- 2008→2024 swing
- -36.1pp toward R · 2008: 26.6pp · 2024: -9.4pp
- All cycles
- 2024: R+9.4 2020: R+1.9 2016: D+3.0 2012: D+27.7 2008: D+26.6
Not yet ingested
- Civics
- —
Market trends
- HPI YoY
- ▲ 6.72%
- Current HPI
- 174.9495
- Rent YoY
- —
- Metro
- —
- State GDP YoY
- ▲ 1.98%
- F500 in state
- 48
Industry mix (Fortune 500 HQ in OH)
| Industry | F500 HQs | Revenue |
|---|---|---|
| Insurance | 3 | $145B |
|
||
| Industrial Machinery | 3 | $49B |
|
||
| Financial Services | 3 | $24B |
|
||
| Consumer Goods | 2 | $93B |
|
||
| Aerospace / Defense | 2 | $47B |
|
||
| Utilities | 2 | $33B |
|
||
Price history
+150.0% since first listed15 events — show timeline
- 2026-05-12 Pending — MLSNOW
- 2026-04-20 Price Changed $40,000 MLSNOW
- 2026-02-01 Listed $55,000 MLSNOW
- 2025-12-12 Listing Removed — MLSNOW
- 2025-06-16 Listed $55,000 MLSNOW
- 2025-05-08 Listing Removed — MLSNOW
- 2024-11-26 Price Changed $55,000 MLSNOW
- 2024-11-11 Listed $57,000 MLSNOW
- 2007-11-30 Listing Removed — MLSNOW
- 2007-05-31 Listed $30,000 MLSNOW
- 2005-04-21 Sold (MLS) $18,400 MLSNOW
- 2005-03-07 Listing Removed — MLSNOW
- 2004-12-07 Listed $22,900 MLSNOW
- 1994-06-23 Sold (Public Records) $16,000 Public Records
- 1988-08-01 Sold (Public Records) $16,000 Public Records
Property tax history
-2.2%/yrLatest (2025): $359 · -11.8% YoY. Source: county tax records.
Cash-flow waterfall
monthlySold comps — $/sqft
last 12 mo · ≤1 miLoading sold comps…