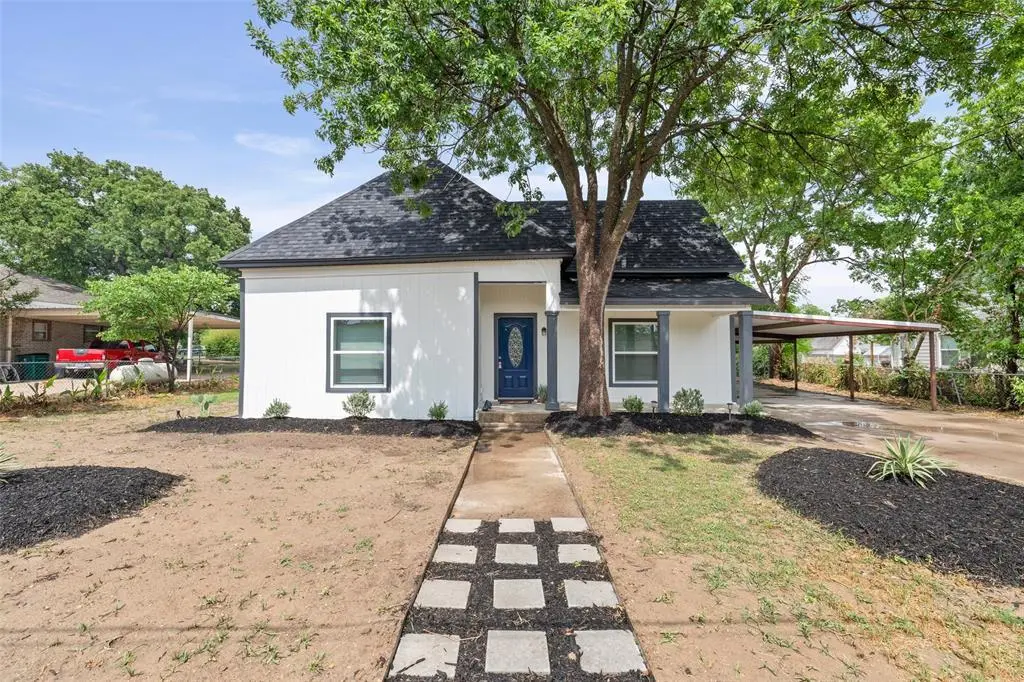
407 Pine Ln · Tolar, TX
Flood risk 1/10 · Minimal
- FEMA flood zone
- X (unshaded)
- Chance of flooding over 30 yrs
- 0.0%
- Est. flood insurance / yr
- $507 – $1,088
Fire risk 7/10 · Major
- Est. fire insurance / yr
- $1,222 – $2,270
Heat risk 7/10 · Major
- Hot days now (above 107°F)
- 7 days/yr
- Hot days in 30 yrs
- 23 days/yr
Wind risk 6/10 · Moderate
- Chance of severe wind over 30 yrs
- 27.0%
Air-quality risk 2/10 · Minimal
- Unhealthy air days now
- 1 days/yr
- Unhealthy air days in 30 yrs
- 1 days/yr
Risk factors via First Street. Map © Google.
Why this score? — see what drove the C- grade
The composite is a weighted blend of 9 inputs, each scored 0–100. Each bar is that input's sub-score; the figure is the points it added to the 100-point composite (weight × sub-score).
- ARV discount +15.0/15.0
- Cash flow +10.9/30.0
- Appreciation +5.0/10.0
- Schools +4.5/10.0
- Livability +3.8/5.0
- DSCR +3.2/10.0
- 1% rule +2.7/10.0
- Rent growth +2.5/5.0
- Condition / age +2.5/5.0
$230,000
🖨 Deal sheet (PDF) 📄 Offer letter ✓ Due diligence
Listing remarks
Fall in love with the perfect blend of vintage charm and modern luxury in this jaw-dropping 1940s beauty, completely transformed with over $100,000 in high-end renovations. From the moment you arrive, the inviting covered front porch sets the tone for the warm elegance waiting inside. The open-concept design was made for entertaining, featuring rich custom hardwood cabinetry, sleek quartz countertops, stainless steel appliances, and a dramatic 8-foot island that anchors the heart of the home. Every detail was curated to create a space that feels both sophisticated and effortlessly livable. Behind the walls, no expense was spared with all-new plumbing, electrical, roof, high-efficiency SEER
Key facts
- Covered front porch
- Open-concept design
- Quartz countertops
Tags
Property features AI
Finance
- Financial info: Listing accepts Cash, Conventional, FHA, USDA, VA, and other financing types
- HOA & community: No homeowners association
Exterior
- Parking: Attached oversized carport (2 covered spaces); Driveway parking; Boat parking
- Security: Fire alarm
- Utilities: City water; City sewer; No municipal utility district
- Home design: Single-family residence; One-story home; Residential property; Not attached to another property
- Construction: Built in 1940 (preowned); Wood and other construction materials; Composition roof; Pillar/post/pier and slab foundation
- Exterior features: Covered porch(es); Covered deck; Outdoor living center; Chain link fencing; Landscaped yard; Large backyard with grass
Interior
- Kitchen: Granite countertops; Kitchen island; Breakfast bar; Built-in cabinets; Eat-in kitchen; Dishwasher; Disposal; Electric range
- Bedrooms: Primary bedroom with ensuite bath, separate vanities, sitting area, and walk-in closet; Two additional bedrooms with split-bedroom layout and walk-in closets
- Flooring: Ceramic tile; Luxury vinyl plank
- Bathrooms: Two full bathrooms
- Heating & cooling: Central heating; Heat pump; Electric heating; Central air conditioning; Ceiling fan(s)
- Interior features: Open floorplan; Decorative lighting; Cable TV available; High speed internet available; Kitchen island; Granite counters; Double vanity; Eat-in kitchen; Walk-in closet(s)
- Laundry & utility: Utility room with full-size washer/dryer area and washer hookup; Drip/dry area and space for a freezer
Neighborhood map
What this means for you Summary
Snapshot
- This is a 3-bed/2.0-bath single-family listed at $230k.
Deal economics
- At list price, monthly cash flow is $-101 ($-1k/yr) — negative.
- To cash-flow at today's rent, offer at most $212k (7.8% below list).
- To meet the 1% rule (rent ≥ 1% of price), the offer needs to be $177k (23.0% below list).
- Recommended offer: $177k (23.0% below list) — sets the bar for 1% rule.
- Cap rate 5.8% vs local median 3.1% in Tolar — top-decile yield for the area; either an underpriced asset or a hidden risk that comps aren't pricing in. Stress-test before assuming the spread holds.
Location & tenants
- Location reads 75/100 on livability (#146 in TX, #4,139 nationally) — a middle-class / working-renter tenant base. Strengths: crime A+, cost of living A+, housing A+; Watch: health & safety D+, amenities F, commute F.
- Tolar ISD (rural): math 55% / reading 50% proficiency, ranked #131 of 826 in TX (top 16%) — acceptable for families but not a draw, mixed tenant base, ~2y average lease.
- Zoned schools: Tolar El (math 42% / reading 42%, grade F, #1,335 of 4,322 statewide, top 33%, 393 students, 39% FRL); Tolar J H (math 62% / reading 57%, grade B, #166 of 1,662 statewide, top 11%, 201 students, 36% FRL); Tolar H S (math 67% / reading 52%, grade C+, #275 of 1,632 statewide, top 19%, 284 students, 30% FRL).
- Market conditions: 137 active listings in the ZIP; 7 comparable units currently listed for rent nearby; rentals at typical pace (median 27d on market — plan ~3-4 weeks tenant-placement turnaround); 43% of comp listings sitting > 30 days — soft ceiling on asking rent; 125 units permitted in Hood County in 2024 (0 in 5+ unit buildings).
Forward outlook
- In year one you build about $2k of equity ($2k loan paydown + $152 appreciation (0.1% local appreciation)).
- Hood County population projected at +29% by 2050 — long-run rental-demand tailwind backs the buy-and-hold thesis.
Negotiation context
- It's been on market 16 days — a 2% lower offer ($227k) is reasonable based on typical stale-listing flexibility.
Risks & watch-outs
- Watch-outs: built in 1940 — expect roof / HVAC / electrical / plumbing capex.
- Climate carrying-cost: major wind risk, 27% chance of damaging wind over 30y; major wildfire risk; extreme-heat days projected 7→23/yr by 2055 (HVAC capex compounding) — expect insurance premiums to compound above CPI over the hold.
Questions for the listing agent
- What do current leases actually rent for vs. the listed asking? Can we see a recent rent roll and the last 12 months of T-12 income?
- Built in 1940 — when were the roof, HVAC, electrical panel, plumbing, and water heater last replaced?
- Is there a deadline driving the sale (1031 exchange, divorce, estate, relocation)? That informs how much negotiation room exists.
- Schools are A-rated — typically a magnet for longer-tenancy family renters. What's the average tenant stay here, and is there a school-zone premium baked into asking?
- What's the average days-on-market for RENTAL listings here right now (not sales)? A rising rental-DOM trend means longer vacancies and softer asking-rent achievability than the comps imply.
- What's the recent tenant-quality profile in this submarket — average credit score on applications, eviction rate, late-payment / NSF rate, and stable-employment percentage? A property-management company in the area should have these aggregated.
- How much new for-sale + rental construction is in the pipeline within 1–3 miles? Heavy new supply typically softens prices + rents 12–24 months out; constrained supply supports both.
Investment metrics
- 1% rule
- 0.77% ✗
- Cap rate
- 5.77%
- Cash-on-cash
- -1.89%
- DSCR
- 0.92
- GRM
- 10.8
CMA / ARV
- ARV (on-the-fly)
- $298,490
- Comps found
- 12
Show comp detail 12 sales within ~0.75 mi
| Address | Dist | Beds/Ba | Sqft | Sold | Price | $/sf | Match |
|---|---|---|---|---|---|---|---|
| 9217 Parkview Cir | 0.38mi | 3/2.0 | 1,616 (+3%) | 2mo | $330,000 | $204 | 76 |
| 944 Huckleberry Ln | 0.41mi | 3/2.0 | 1,629 (+4%) | 1mo | $345,000 | $212 | 74 |
| 9150 Parkview Cir | 0.48mi | 3/2.0 | 1,542 (-2%) | 2mo | $273,000 | $177 | 73 |
| 9135 Parkview Cir | 0.52mi | 3/2.0 | 1,538 (-2%) | 2mo | $325,000 | $211 | 70 |
| 260 Peace Lily Way | 0.41mi | 4/2.0 (+1) | 1,528 (-3%) | 3mo | $260,000 | $170 | 69 |
| 489 Peace Lily Way | 0.47mi | 4/2.0 (+1) | 1,604 (+2%) | 5mo | $285,000 | $178 | 66 |
| 420 Redbud Ln | 0.29mi | 3/2.0 | 1,768 (+12%) | 2mo | $359,900 | $204 | 64 |
| 810 Acadia Ct | 0.50mi | 3/2.0 | 1,481 (-6%) | 6mo | $260,000 | $176 | 62 |
| 9108 Parkview Cir | 0.53mi | 4/2.0 (+1) | 1,711 (+9%) | 0mo | $325,000 | $190 | 55 |
| 472 Peace Lily Way | 0.42mi | 4/2.0 (+1) | 1,776 (+13%) | 1mo | $298,000 | $168 | 53 |
| 9142 Parkview Cir | 0.51mi | 3/2.0 | 1,792 (+14%) | 2mo | $299,000 | $167 | 51 |
| 1418 Oleander Dr | 0.68mi | 4/2.0 (+1) | 1,717 (+9%) | 2mo | $345,888 | $201 | 47 |
Match score weights: distance 35% · size 25% · config 20% · recency 20%. Top-matched comps best support the ARV.
Projected returns pro-forma
0.07% appreciation · 3.0% rent growth · sell at horizon
- IRR
- -4.1%
- Equity multiple
- 0.81×
- Total profit
- $-12,484
- Equity at exit
- $67,547
- IRR
- 1.7%
- Equity multiple
- 1.18×
- Total profit
- $11,701
- Equity at exit
- $81,806
Cash invested: $64,400 (down + closing). Projections, not guarantees.
Landlord ↔ Tenant lean methodology
- Overall (STATE)
- 87 Strongly Landlord-Friendly
- State Texas
- 87 Strongly Landlord-Friendly · R+5
- County
- — inherits STATE
- City
- — inherits STATE
ZIP-level market 76476
- Home prices YoY
- 0.0%
- Active inventory
- 137
- Price-to-rent
- 10.8×
Monthly cashflow live
- Estimated rent
- $1,771 high interval (Pro) →
- Mortgage (P&I)
- −$1,206
- Tax from tax record
- −$198 /mo · $2,375/yr
- Insurance
- −$96
- HOA
- −$0
- Vacancy / Maint / Mgmt
- −$372
- Net cashflow
- $-101
Break-even live
Sensitivity live
| Price | -10% $29 | -5% $-36 | +0% $-101 | +5% $-166 | +10% $-231 |
|---|---|---|---|---|---|
| Rent | -10% $-241 | -5% $-171 | +0% $-101 | +5% $-31 | +10% $39 |
| Rate | -1.0pp $15 | -0.5pp $-43 | base $-101 | +0.5pp $-161 | +1.0pp $-221 |
UW: 25.0% down · 7.5% · 30yr · 1.5% tax · 5.0% vac · 8.0% maint · 8.0% mgmt
Financing live
Cash to close
- Down payment
- $57,500
- Closing costs
- $6,900
- Reserves months
- —
- Total cash needed
- —
Loan-product check · same deal, 3 products live
Conventional
25% down · 7.5% · 30yr
- Down + closing
- —
- Monthly P&I
- —
- Monthly cashflow
- —
- DSCR
- —
- Eligible?
- —
Personal DTI + credit; lowest rate.
DSCR
20% down · 8.5% · 30yr
- Down + closing
- —
- Monthly P&I
- —
- Monthly cashflow
- —
- DSCR
- —
- Eligible?
- —
No personal income docs; deal must DSCR.
Hard money
10% down · 12.0% · 12mo
- Down + closing
- —
- Monthly P&I
- —
- Monthly cashflow
- —
- DSCR
- —
- Eligible?
- —
Short-term bridge; refi at stabilization.
Rent comps 7 comps
| Address | Beds | Baths | Sqft | Rent | $/sqft | DOM | Units | Dist |
|---|---|---|---|---|---|---|---|---|
| 206 E 3rd St Tolar, TX | 3.0 | 1.0 | 1350 | $1,895 | $1.40 | 9d | 1 | 0.08mi |
| 105 E 6th St Tolar, TX | 2.0 | 1.0 | 1100 | $1,495 | $1.36 | 26d | 1 | 0.15mi |
| 200 Cedar Ln Tolar, TX | 3.0 | 2.0 | 1768 | $1,850 | $1.05 | 26d | 1 | 0.23mi |
| 116 Donley St Tolar, TX | 3.0 | 2.0 | 1182 | $1,500 | $1.27 | 14d | 1 | 0.29mi |
| 121 Emerson Ln Tolar, TX | 3.0 | 2.0 | 1200 | $1,695 | $1.41 | 45d | 1 | 0.31mi |
| 811 Tolar Hwy Unit 121 Tolar, TX | 3.0 | 2.0 | 1200 | $1,695 | $1.41 | 45d | 1 | 0.32mi |
| 535 Calla Lily Way Tolar, TX | 4.0 | 2.0 | 1935 | $2,550 | $1.32 | 45d | 1 | 0.66mi |
Listing history 11 events
-
2026-06-09status $230,000 Pending 16 DOM
-
2026-06-08days on market $230,000 Active Option Contract 16 DOM
-
2026-06-07days on market $230,000 Active Option Contract 15 DOM
-
2026-06-05days on market $230,000 Active Option Contract 12 DOM
-
2026-06-02days on market $230,000 Active Option Contract 10 DOM
-
2026-06-01statusdays on market $230,000 Active Option Contract 9 DOM
-
2026-05-31days on market $230,000 Active 8 DOM
-
2026-05-30days on market $230,000 Active 7 DOM
-
2026-05-23$230,000 Active
-
2025-06-17soldstatus
-
1986-10-31soldstatus
ⓘ Source: listings_history table (triggers on properties + properties_extension) + one-shot
backfill from property_details.listing_events for pre-trigger history.
Tax reassessment forecast TX · Resets to sale price
- Current annual tax
- $2,375 · $198/mo
- Projected year-2 tax
- $4,209 · $351/mo
- Expected delta
- +$1,834/yr (+$153/mo · 77.2%)
ⓘ Screening estimate from a state-policy table — verify with the county assessor before closing.
Climate risk First Street
- Flood 1/10 Low FEMA zone X (unshaded) · 0% chance over 30 yrs
- Wildfire 7/10 Severe
- Heat 7/10 Severe 7 d/yr ≥107°F today · 23 d/yr by 30 yrs out
- Wind 6/10 Major 27% chance of damaging wind over 30 yrs
- Air quality 2/10 Low 1 unhealthy d/yr today · 1 by 30 yrs out
Nearby sold comps map
Loading sold comps map…
Walkable amenities ~0.75 mi
Loading nearby amenities…
Taxation est. · year 1
- Rental income
- $21,246
- − Mortgage interest
- −$12,884
- − Property taxes
- −$2,375
- − Insurance
- −$1,150
- − Repairs & maintenance
- −$1,700
- − Management
- −$1,700
- − Depreciation
- −$6,691
- Taxable loss
- −$5,253
- Est. tax savings @ 24.0%
- +$1,261
- After-tax cash flow
- $46/yr
For passive investors: Depreciation is non-cash, so a rental often shows a tax loss while cash-flowing — sheltering income. Rental losses are passive: they offset passive income freely, and up to $25,000/yr can offset ordinary (W-2) income if you actively participate and your MAGI is under $100k (phasing out to $0 by $150k); unused losses carry forward. On sale, claimed depreciation is recaptured at up to 25%, and gains may owe capital-gains tax (a 1031 exchange can defer both). Figures are a year-1 estimate at your 24.0% rate — not tax advice; consult a CPA.
Schools (NCES district)
- District
- Tolar ISD
- NCES district ID
- 4842900
- Math proficiency
- 55% ▼ -8.00%
- Reading proficiency
- 50% ▼ -6.00%
- Median HH income
- $55,351
- Composite
- 45.4/100
- National rank
- #2629
- State rank
- #131 of 826 in TX
Livability — Tolar
- Score
- 75/100
- State rank
- #146
- US rank
- #4139
Category grades
Schools grade is shown separately in the Schools card above.
Census & demographics
- Census place
- Tolar, TX
- Population (ZIP)
- 3,638
Population outlook (Hood County) Hauer SSP2
- Today (2025)
- 63,502 people
- By 2030
- 67,459 · +6.2%
- By 2040
- 74,958 · +18.0%
- By 2050
- 81,922 · +29.0%
- By 2075
- 98,872 · +55.7%
- By 2100
- 107,796 · +69.8%
Race, ethnicity, and origin ACS 2023
- Neighborhood character
- Predominantly White (91%)
- Race & ethnicity
- White 91% Two or more races 5% Hispanic / Latino 5%
- Common ancestry
- Italian 2% Iranian 1% Slovak 1%
- Foreign-born
- 0%
- Languages at home
- 99% English-only · Spanish 1%
Political lean MEDSL · Hood
- 2024 margin
- Solid R (+66.0) · D 16.6% · R 82.6%
- 2008→2024 swing
- -11.9pp toward R · 2008: -54.0pp · 2024: -66.0pp
- All cycles
- 2024: R+66.0 2020: R+64.1 2016: R+66.5 2012: R+64.7 2008: R+54.0
Not yet ingested
- Civics
- —
Market trends
- HPI YoY
- ▲ 0.07%
- Current HPI
- 308.4789
- Rent YoY
- —
- Metro
- —
- State GDP YoY
- ▲ 3.95%
- F500 in state
- 110
Industry mix (Fortune 500 HQ in TX)
| Industry | F500 HQs | Revenue |
|---|---|---|
| Energy | 16 | $1,198B |
|
||
| Technology | 5 | $198B |
|
||
| Engineering / Construction | 4 | $72B |
|
||
| Energy Services | 3 | $60B |
|
||
| Utilities | 3 | $41B |
|
||
| Healthcare | 2 | $330B |
|
||
Price history
3 events — show timeline
- 2026-05-23 Listed $230,000 NTREIS
- 2025-06-17 Sold (Public Records) — Public Records
- 1986-10-31 Sold (Public Records) — Public Records
Property tax history
+2.1%/yrLatest (2025): $2,375 · -1.9% YoY. Source: county tax records.
Cash-flow waterfall
monthlySold comps — $/sqft
last 12 mo · ≤1 miLoading sold comps…