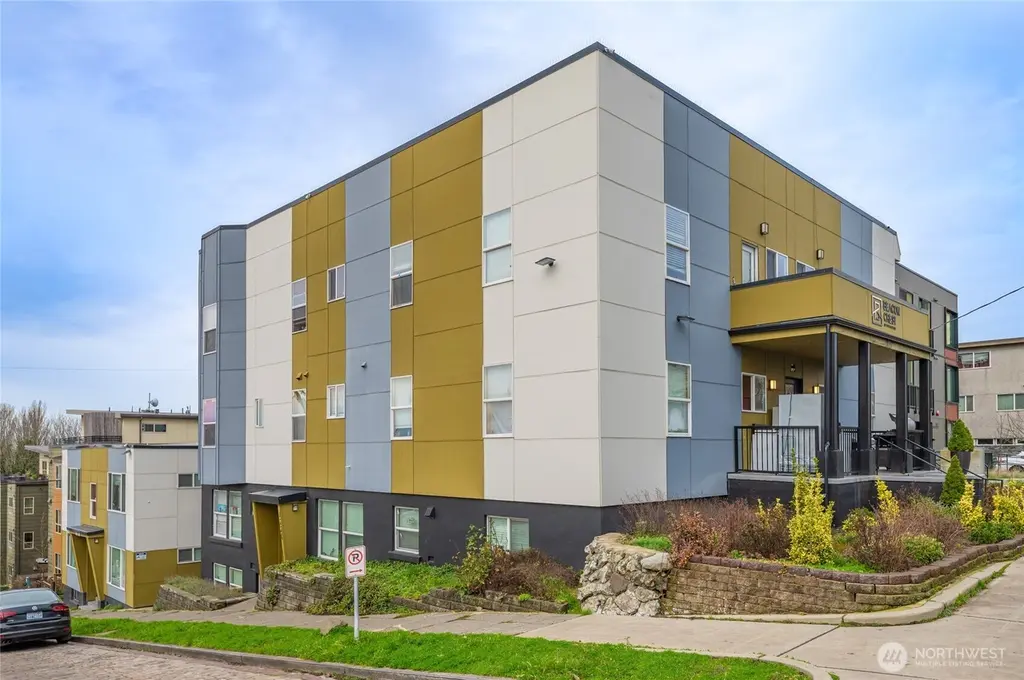
 22-Plex
1815 13th Ave S · Seattle, WA
Flood risk 1/10 · Minimal
- FEMA flood zone
- X (unshaded)
- Chance of flooding over 30 yrs
- 0.0%
- Est. flood insurance / yr
- $507 – $1,088
Fire risk 1/10 · Minimal
- Est. fire insurance / yr
- $604 – $1,122
Heat risk 3/10 · Minor
- Hot days now (above 86°F)
- 6 days/yr
- Hot days in 30 yrs
- 13 days/yr
Wind risk 1/10 · Minimal
- Chance of severe wind over 30 yrs
- —
Air-quality risk 7/10 · Major
- Unhealthy air days now
- 11 days/yr
- Unhealthy air days in 30 yrs
- 11 days/yr
Risk factors via First Street. Map © Google.
Why this score? — see what drove the B- grade
The composite is a weighted blend of 9 inputs, each scored 0–100. Each bar is that input's sub-score; the figure is the points it added to the 100-point composite (weight × sub-score).
- Cash flow +29.5/30.0
- DSCR +10.0/10.0
- 1% rule +7.7/10.0
- ARV discount +7.5/15.0
- Schools +6.1/10.0
- Livability +3.8/5.0
- Rent growth +3.0/5.0
- Condition / age +2.5/5.0
- Appreciation +0.0/10.0
$4,295,000
🖨 Deal sheet 📄 Offer letter ✓ Due diligence
Multi-family units
County records classify this as Multi-Family (5+ Unit). Listing-text estimate: 22 units. confirmed
5+ unit building — per-unit beds/baths from public records are typically unavailable; the breakdown below (if shown) is an estimate from the listing text.
Listing remarks
The property reflects true pride of ownership, with extensive upgrades completed in recent years. Improvements include full replacement of in-unit wiring and plumbing, along with comprehensive kitchen and bathroom remodels, ensuring modern comfort, durability, and reduced future capital needs. With an average unit size of 560 SF, the building offers efficient layouts that remain highly competitive in the Beacon Hill rental market. Offering a desirable and efficient unit mix of two studios, thirteen one-bedrooms, and seven two-bedrooms, this 22-unit asset delivers broad renter appeal and strong operational fundamentals. Residents benefit from close proximity to local amenities, outdoor recre
Key facts
- Outdoor recreation
- Efficient layouts
- Extensive upgrades
Tags
Neighborhood map
What this means for you Summary
Snapshot
- This is a 22 × 27-bed/23.0-bath units multifamily listed at $4.29M.
Deal economics
- At list price, monthly cash flow is $15k ($184k/yr) — positive. Per door: $698/mo.
- The deal already cash-flows at list — no discount required.
- Meets the 1% rule at list price ($55k rent vs $4.29M).
- Recommended offer: $3.78M (12.0% below list) — sets the bar for market timing.
- Cap rate 10.6% vs local median 1.6% in Seattle — top-decile yield for the area; either an underpriced asset or a hidden risk that comps aren't pricing in. Stress-test before assuming the spread holds.
Location & tenants
- Location reads 75/100 on livability (#166 in WA, #4,033 nationally) — a middle-class / working-renter tenant base. Strengths: amenities A+, commute A+, employment A+; Watch: crime F, cost of living F.
- Seattle Public Schools (urban): math 64% / reading 72% proficiency, ranked #19 of 291 in WA (top 6%) — acceptable for families but not a draw, mixed tenant base, ~2y average lease.
- Market conditions: Rents rising (+1.9%/yr); 200 active listings in the ZIP; solid renter incomes; 10,555 units permitted in King County in 2024 (7,119 in 5+ unit buildings).
- At $54,514/mo this rent would consume 675% of the median local household income ($97k/yr) (locally 1780% of renters already pay >50% of income on rent) — very limited rent-growth headroom before tenants either downsize or default.
Forward outlook
- Local home prices are declining (-3.0%/yr); year-one equity from $30k of loan paydown is wiped out by about $129k of value loss. Plan a longer hold.
- King County population projected at +44% by 2050 — long-run rental-demand tailwind backs the buy-and-hold thesis.
- At projected returns (-3.0% appreciation + 1.9% rent growth), your $1.20M cash investment doubles in ~9 years — after that, you're playing with house money.
Negotiation context
- It's been on market 137 days — a 12% lower offer ($3.78M) is reasonable based on typical stale-listing flexibility.
- Current owner paid $918k; list at $4.29M implies a 368% gain — meaningful room to come down on a strong offer.
Risks & watch-outs
- Watch-outs: built in 1911 — expect roof / HVAC / electrical / plumbing capex.
Questions for the listing agent
- It's been on market 137 days. Have you received any prior offers? Is the seller open to a 12% concession, seller financing, or rate buy-down credit?
- Can we see the unit-by-unit rent roll, current vacancy, and any below-market leases? What's the average tenancy length?
- What capital expenditures (roof, boiler, parking lot, exteriors) have been made in the last 5 years, and what's planned in the next 2?
- Built in 1911 — when were the roof, HVAC, electrical panel, plumbing, and water heater last replaced?
- Why hasn't it sold? Are there any deal-killer items the seller is aware of (foundation, flood, title, zoning, code violations)?
- Is there a deadline driving the sale (1031 exchange, divorce, estate, relocation)? That informs how much negotiation room exists.
- Schools are A-rated — typically a magnet for longer-tenancy family renters. What's the average tenant stay here, and is there a school-zone premium baked into asking?
- Crime grade is F in this area — have there been break-ins, vandalism, or insurance claims at this property in the last 3 years? What carrier currently insures it and at what premium?
- What's the average days-on-market for RENTAL listings here right now (not sales)? A rising rental-DOM trend means longer vacancies and softer asking-rent achievability than the comps imply.
- What's the recent tenant-quality profile in this submarket — average credit score on applications, eviction rate, late-payment / NSF rate, and stable-employment percentage? A property-management company in the area should have these aggregated.
- How much new apartment / multifamily construction is in the pipeline within 1–3 miles? Heavy new supply (>2% of stock underway) typically softens rents 12–24 months out; light construction supports rent growth.
Investment metrics
- 1% rule
- 1.27% ✓
- Cap rate
- 10.58%
- Cash-on-cash
- 15.31%
- DSCR
- 1.68
- GRM
- 6.6
CMA / ARV
- ARV (median comp)
- $2,762,332
- List price
- $4,295,000
- Delta
- 55.48%
- Verdict
- OVERPRICED
- Comps
- 1 within 2.0 mi
Projected returns pro-forma
-3.0% appreciation · 1.92% rent growth · sell at horizon
- IRR
- 4.8%
- Equity multiple
- 1.18×
- Total profit
- $222,396
- Equity at exit
- $640,398
- IRR
- 13.3%
- Equity multiple
- 2.01×
- Total profit
- $1,215,289
- Equity at exit
- $371,353
Cash invested: $1,202,600 (down + closing). Projections, not guarantees.
Landlord ↔ Tenant lean methodology
- Overall (CITY)
- 0 Strongly Tenant-Friendly
- State Washington
- 28 Tenant-Leaning · D+8
- County
- — inherits STATE
- City Seattle
- 0 Strongly Tenant-Friendly · D+52
ZIP-level market 98144
- Rents YoY
- 1.9%
- Active inventory
- 200
- Price-to-rent
- 144.4×
Monthly cashflow live
- Estimated rent
- $54,514 medium interval (Pro) →
- Mortgage (P&I)
- −$22,523
- Tax from tax record
- −$3,408 /mo · $40,890/yr
- Insurance
- −$1,790
- HOA
- −$0
- Vacancy / Maint / Mgmt
- −$11,448
- Net cashflow
- $15,346
Break-even live
22-unit breakdown (identical units grouped — click to expand)
| Units | Beds | Baths | Est. rent |
|---|---|---|---|
| 22× units | 27 | 23 | $54,516 |
| #1 | 27 | 23 | $2,478 |
| #2 | 27 | 23 | $2,478 |
| #3 | 27 | 23 | $2,478 |
| #4 | 27 | 23 | $2,478 |
| #5 | 27 | 23 | $2,478 |
| #6 | 27 | 23 | $2,478 |
| #7 | 27 | 23 | $2,478 |
| #8 | 27 | 23 | $2,478 |
| #9 | 27 | 23 | $2,478 |
| #10 | 27 | 23 | $2,478 |
| #11 | 27 | 23 | $2,478 |
| #12 | 27 | 23 | $2,478 |
| #13 | 27 | 23 | $2,478 |
| #14 | 27 | 23 | $2,478 |
| #15 | 27 | 23 | $2,478 |
| #16 | 27 | 23 | $2,478 |
| #17 | 27 | 23 | $2,478 |
| #18 | 27 | 23 | $2,478 |
| #19 | 27 | 23 | $2,478 |
| #20 | 27 | 23 | $2,478 |
| #21 | 27 | 23 | $2,478 |
| #22 | 27 | 23 | $2,478 |
| Total (22 units) | $54,514 | ||
UW: 25.0% down · 7.5% · 30yr · 1.5% tax · 5.0% vac · 8.0% maint · 8.0% mgmt
Financing live
Cash to close
- Down payment
- $1,073,750
- Closing costs
- $128,850
- Reserves months
- —
- Total cash needed
- —
Loan-product check · same deal, 3 products live
Conventional
25% down · 7.5% · 30yr
- Down + closing
- —
- Monthly P&I
- —
- Monthly cashflow
- —
- DSCR
- —
- Eligible?
- —
Personal DTI + credit; lowest rate.
DSCR
20% down · 8.5% · 30yr
- Down + closing
- —
- Monthly P&I
- —
- Monthly cashflow
- —
- DSCR
- —
- Eligible?
- —
No personal income docs; deal must DSCR.
Hard money
10% down · 12.0% · 12mo
- Down + closing
- —
- Monthly P&I
- —
- Monthly cashflow
- —
- DSCR
- —
- Eligible?
- —
Short-term bridge; refi at stabilization.
Listing history 25 events
-
2026-06-19days on market $4,295,000 Active 137 DOM
-
2026-06-18days on market $4,295,000 Active 136 DOM
-
2026-06-17days on market $4,295,000 Active 135 DOM
-
2026-06-16days on market $4,295,000 Active 134 DOM
-
2026-06-15days on market $4,295,000 Active 133 DOM
-
2026-06-15days on market $4,295,000 Active 132 DOM
-
2026-06-13days on market $4,295,000 Active 131 DOM
-
2026-06-12days on market $4,295,000 Active 130 DOM
-
2026-06-10days on market $4,295,000 Active 128 DOM
-
2026-06-09days on market $4,295,000 Active 127 DOM
-
2026-06-08days on market $4,295,000 Active 126 DOM
-
2026-06-07days on market $4,295,000 Active 125 DOM
-
2026-06-07days on market $4,295,000 Active 124 DOM
-
2026-06-04days on market $4,295,000 Active 122 DOM
-
2026-06-03days on market $4,295,000 Active 121 DOM
-
2026-06-02days on market $4,295,000 Active 120 DOM
-
2026-06-01days on market $4,295,000 Active 119 DOM
-
2026-05-31days on market $4,295,000 Active 118 DOM
-
2026-03-10price $4,295,000
-
2026-02-02$4,895,000 Active
-
1999-12-15soldstatus $917,800
-
1989-11-08soldstatus $450,000
-
1985-07-26soldstatus $465,000
-
1984-03-30soldstatus $345,000
-
1979-07-09soldstatus $320,000
ⓘ Source: listings_history table (triggers on properties + properties_extension) + one-shot
backfill from property_details.listing_events for pre-trigger history.
Tax reassessment forecast WA · Resets to sale price
- Current annual tax
- $40,890 · $3,408/mo
- Projected year-2 tax
- $42,091 · $3,508/mo
- Expected delta
- +$1,201/yr (+$100/mo · 2.9%)
ⓘ Screening estimate from a state-policy table — verify with the county assessor before closing.
Climate risk First Street
- Flood 1/10 Low FEMA zone X (unshaded) · 0% chance over 30 yrs
- Wildfire 1/10 Low
- Heat 3/10 Moderate 6 d/yr ≥86°F today · 13 d/yr by 30 yrs out
- Wind 1/10 Low
- Air quality 7/10 Severe 11 unhealthy d/yr today · 11 by 30 yrs out
Nearby sold comps map
Loading sold comps map…
Walkable amenities ~0.75 mi
Loading nearby amenities…
Taxation est. · year 1
- Rental income
- $654,168
- − Mortgage interest
- −$240,587
- − Property taxes
- −$40,890
- − Insurance
- −$21,475
- − Repairs & maintenance
- −$52,333
- − Management
- −$52,333
- − Depreciation
- −$124,945
- Taxable income
- $121,604
- Est. tax owed @ 24.0%
- −$29,185
- After-tax cash flow
- $154,961/yr
For passive investors: Depreciation is non-cash, so a rental often shows a tax loss while cash-flowing — sheltering income. Rental losses are passive: they offset passive income freely, and up to $25,000/yr can offset ordinary (W-2) income if you actively participate and your MAGI is under $100k (phasing out to $0 by $150k); unused losses carry forward. On sale, claimed depreciation is recaptured at up to 25%, and gains may owe capital-gains tax (a 1031 exchange can defer both). Figures are a year-1 estimate at your 24.0% rate — not tax advice; consult a CPA.
Schools (NCES district)
- District
- Seattle Public Schools
- NCES district ID
- 5307710
- Math proficiency
- 64% ▼ -1.00%
- Reading proficiency
- 72% ▬ 0.00%
- Median HH income
- $68,695
- Composite
- 60.76/100
- National rank
- #1649
- State rank
- #19 of 291 in WA
Livability — Seattle
- Score
- 75/100
- State rank
- #166
- US rank
- #4033
Category grades
Schools grade is shown separately in the Schools card above.
Census & demographics
- Census place
- Seattle, WA
- County
- King County · 2,251,916 people
- City population
- 706,262
- Metro
- Seattle-Tacoma-Bellevue, WA
- Population (ZIP)
- 33,787
- Household income
- $96,969
- Rent vs Own
- Severe rent burden
- 1780.0
Population outlook (King County) Hauer SSP2
- Today (2025)
- 2,576,485 people
- By 2030
- 2,803,316 · +8.8%
- By 2040
- 3,255,921 · +26.4%
- By 2050
- 3,706,444 · +43.9%
- By 2075
- 4,746,063 · +84.2%
- By 2100
- 5,407,730 · +109.9%
Race, ethnicity, and origin ACS 2023
- Neighborhood character
- Highly diverse neighborhood (Simpson 0.73)
- Race & ethnicity
- White 45% Asian 19% Two or more races 13% Black 13% Hispanic / Latino 11%
- Hispanic origin (detail)
- Mexican 8%
- Common ancestry
- Lithuanian 3% Italian 3% Slovak 2%
- Foreign-born
- 22% · Canada, China, Vietnam
- Languages at home
- 74% English-only · Spanish 8% Chinese 7% Vietnamese 2%
Political lean MEDSL · King
- 2024 margin
- Solid D (+51.7) · D 74.2% · R 22.5% · Other 3.4%
- 2008→2024 swing
- +9.6pp toward D · 2008: 42.1pp · 2024: 51.7pp
- All cycles
- 2024: D+51.7 2020: D+52.7 2016: D+50.4 2012: D+39.9 2008: D+42.1
Not yet ingested
- Civics
- —
Market trends
- HPI YoY
- ▼ -1662.88%
- Current HPI
- 296.7568
- Rent YoY
- ▲ 1.92%
- Metro
- Seattle-Tacoma-Bellevue, WA
- State GDP YoY
- ▲ 4.65%
- F500 in state
- 22
Industry mix (Fortune 500 HQ in WA)
| Industry | F500 HQs | Revenue |
|---|---|---|
| Retail | 2 | $269B |
|
||
| Technology / Retail | 1 | $638B |
|
||
| Technology | 1 | $245B |
|
||
| Telecommunications | 1 | $38B |
|
||
| Food / Beverage | 1 | $36B |
|
||
| Automotive / Trucks | 1 | $34B |
|
||
Price history
+1242.2% since first listed7 events — show timeline
- 2026-03-10 Price Changed $4,295,000 NWMLS as Distributed by MLS Grid
- 2026-02-02 Listed $4,895,000 NWMLS as Distributed by MLS Grid
- 1999-12-15 Sold (Public Records) $917,800 Public Records
- 1989-11-08 Sold (Public Records) $450,000 Public Records
- 1985-07-26 Sold (Public Records) $465,000 Public Records
- 1984-03-30 Sold (Public Records) $345,000 Public Records
- 1979-07-09 Sold (Public Records) $320,000 Public Records
Property tax history
+8.2%/yrLatest (2025): $40,890 · -5.0% YoY. Source: county tax records.
Cash-flow waterfall
monthlySold comps — $/sqft
last 12 mo · ≤1 miLoading sold comps…