10123 Canoe Dr · Union, KY
Flood risk 1/10 · Minimal
- FEMA flood zone
- X (unshaded)
- Chance of flooding over 30 yrs
- 0.0%
- Est. flood insurance / yr
- $507 – $1,088
Fire risk 2/10 · Minimal
- Est. fire insurance / yr
- $839 – $1,559
Heat risk 4/10 · Minor
- Hot days now (above 102°F)
- 7 days/yr
- Hot days in 30 yrs
- 19 days/yr
Wind risk 2/10 · Minimal
- Chance of severe wind over 30 yrs
- 1.0%
Air-quality risk 3/10 · Minor
- Unhealthy air days now
- 2 days/yr
- Unhealthy air days in 30 yrs
- 4 days/yr
Risk factors via First Street. Map © Google.
Why this score? — see what drove the C grade
The composite is a weighted blend of 9 inputs, each scored 0–100. Each bar is that input's sub-score; the figure is the points it added to the 100-point composite (weight × sub-score).
- Cash flow +19.0/30.0
- ARV discount +15.0/15.0
- DSCR +6.0/10.0
- 1% rule +4.1/10.0
- Schools +4.1/10.0
- Livability +3.9/5.0
- Rent growth +2.5/5.0
- Condition / age +2.5/5.0
- Appreciation +0.0/10.0
$274,900
🖨 Deal sheet 📄 Offer letter ✓ Due diligence
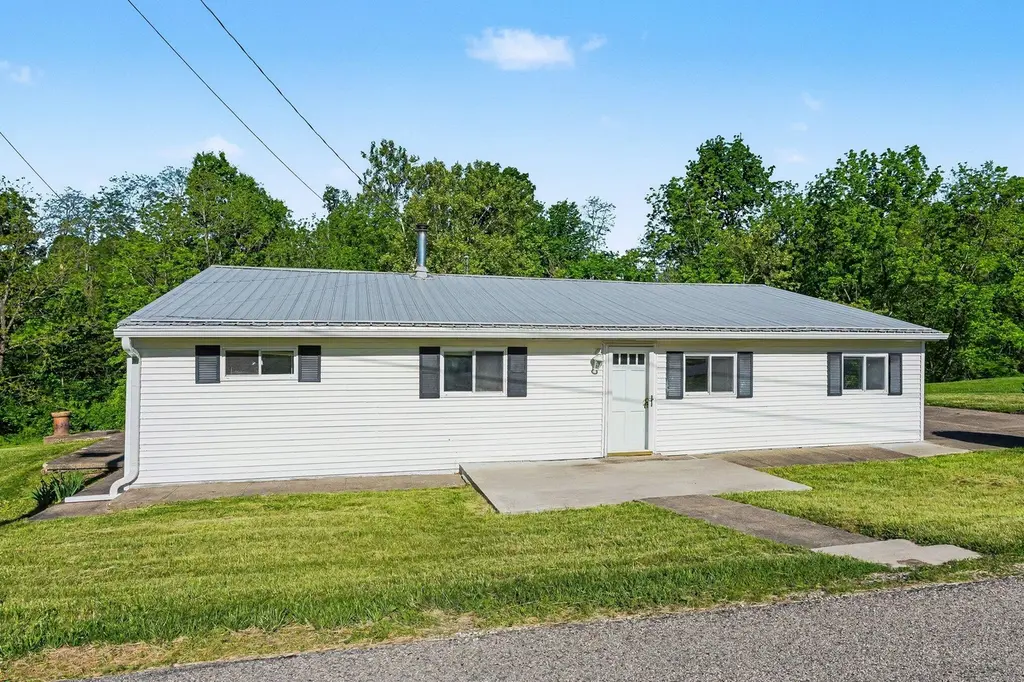
Listing remarks
Hard to find home in Union at this price point! 3 BR, 2 full bath ranch with equipped kitchen, oversized attached garage, workshop, large covered deck and gazebo. 1813 Sq. Ft. per Realist. Separate detached 1 car garage building/shed for your toys or lawn equipment. Feel like you are in the country with your large 1.57 acre lot but the convenience of having I-71/75 and shopping only minutes away. Hurry!
Key facts
- Gazebo
- Large lot
- Large covered deck
Tags
Property features AI
Exterior
- Parking: Attached and detached garage options; Garage faces side; Off-street parking; Driveway; 3 garage spaces
- Utilities: Cistern water; Septic tank; Cable available; Propane available
- Home design: Single family residence; One level; Built in 1950; Metal roof; Vinyl siding
- Construction: Block foundation
- Exterior features: Cleared lot; Rolling slope; Gazebo; Workshop (separate structure); Vinyl clad windows
Interior
- Kitchen: Electric range; Refrigerator
- Bedrooms: Primary bedroom (15 x 10); Bedroom 2 (13 x 11); Bedroom 3 (10 x 10)
- Flooring: Concrete flooring in workshop
- Bathrooms: 2 full bathrooms; Primary bath (8 x 6); Second bathroom (9 x 5)
- Heating & cooling: Forced air heating; Central air conditioning
- Interior features: Living room; Dining room; Family room; Workshop with concrete flooring; Covered porch; Deck
- Laundry & utility: Washer; Dryer; Washer hookup; Electric dryer hookup (main level)
Neighborhood map
What this means for you Summary
Snapshot
- This is a 3-bed/2.0-bath single-family listed at $275k.
Deal economics
- At list price, monthly cash flow is $287 ($3k/yr) — positive.
- The deal already cash-flows at list — no discount required.
- To meet the 1% rule (rent ≥ 1% of price), the offer needs to be $250k (9.2% below list).
- Recommended offer: $250k (9.2% below list) — sets the bar for 1% rule.
- Cap rate 7.5% vs local median 2.4% in Union — top-decile yield for the area; either an underpriced asset or a hidden risk that comps aren't pricing in. Stress-test before assuming the spread holds.
Location & tenants
- Location reads 78/100 on livability (#79 in KY, #2,521 nationally) — a middle-class / working-renter tenant base. Strengths: crime A+, employment A+, housing A+; Watch: amenities F, commute F.
- Boone County (suburban): math 43% / reading 49% proficiency, ranked #12 of 165 in KY (top 7%) — families likely to look elsewhere, expect single-tenant / working-renter base with shorter leases.
- Zoned schools: Longbranch Elementary School (math 60% / reading 61%, grade B-, #31 of 676 statewide, top 5%, 867 students, 26% FRL); Ballyshannon Middle School (math 45% / reading 49%, grade D+, #27 of 217 statewide, top 12%, 633 students, 28% FRL); Larry A. Ryle High School (math 50% / reading 48%, grade D, #15 of 254 statewide, top 6%, 2,013 students, 32% FRL) — zoned schools at 29% FRL track the district average.
- Market conditions: 469 active listings in the ZIP; 1 comparable units currently listed for rent nearby; 1,430 units permitted in Boone County in 2024 (928 in 5+ unit buildings).
Forward outlook
- Local home prices are declining (-3.0%/yr); year-one equity from $2k of loan paydown is wiped out by about $8k of value loss. Plan a longer hold.
- Boone County population projected at +24% by 2050 — long-run rental-demand tailwind backs the buy-and-hold thesis.
Negotiation context
- It's been on market 19 days — a 2% lower offer ($271k) is reasonable based on typical stale-listing flexibility.
Risks & watch-outs
- Watch-outs: built in 1950 — expect roof / HVAC / electrical / plumbing capex.
Questions for the listing agent
- Built in 1950 — when were the roof, HVAC, electrical panel, plumbing, and water heater last replaced?
- Is there a deadline driving the sale (1031 exchange, divorce, estate, relocation)? That informs how much negotiation room exists.
- Schools are A-rated — typically a magnet for longer-tenancy family renters. What's the average tenant stay here, and is there a school-zone premium baked into asking?
- What's the average days-on-market for RENTAL listings here right now (not sales)? A rising rental-DOM trend means longer vacancies and softer asking-rent achievability than the comps imply.
- What's the recent tenant-quality profile in this submarket — average credit score on applications, eviction rate, late-payment / NSF rate, and stable-employment percentage? A property-management company in the area should have these aggregated.
- How much new for-sale + rental construction is in the pipeline within 1–3 miles? Heavy new supply typically softens prices + rents 12–24 months out; constrained supply supports both.
Investment metrics
- 1% rule
- 0.91% ✗
- Cap rate
- 7.55%
- Cash-on-cash
- 4.48%
- DSCR
- 1.20
- GRM
- 9.2
CMA / ARV
- ARV (on-the-fly)
- $402,486
- Comps found
- 12
Show comp detail 12 sales within ~0.75 mi
| Address | Dist | Beds/Ba | Sqft | Sold | Price | $/sf | Match |
|---|---|---|---|---|---|---|---|
| 6837 Green Isle Ln | 0.66mi | 2/2.0 (-1) | 1,845 (+2%) | 7mo | $429,000 | $233 | 55 |
| 2316 O'clery Ave | 0.64mi | 2/2.0 (-1) | 1,733 (-4%) | 4mo | $415,000 | $239 | 55 |
| 6829 Green Isle Ln | 0.66mi | 2/2.0 (-1) | 1,763 (-3%) | 8mo | $453,500 | $257 | 53 |
| 3324 Mackenzie Ct Unit B | 0.56mi | 3/2.5 | 1,651 (-9%) | 6mo | $288,717 | $175 | 52 |
| 6805 Green Isle Ln | 0.68mi | 3/2.0 | 1,632 (-10%) | 1mo | $375,000 | $230 | 51 |
| 3320 Mackenzie Ct Unit 716A | 0.56mi | 3/2.5 | 1,651 (-9%) | 9mo | $313,400 | $190 | 50 |
| 3316 Mackenzie Ct Unit 716B | 0.57mi | 3/2.5 | 1,651 (-9%) | 9mo | $286,963 | $174 | 50 |
| 4233 Aine Dr Unit 709A | 0.58mi | 3/2.5 | 1,651 (-9%) | 9mo | $309,501 | $187 | 49 |
| 2312 O Clery Ave | 0.65mi | 2/2.0 (-1) | 1,687 (-7%) | 6mo | $374,168 | $222 | 48 |
| 6800 Green Isle Ln | 0.71mi | 2/2.0 (-1) | 1,714 (-6%) | 5mo | $422,000 | $246 | 48 |
| 6139 Vintage Fleet Ln | 0.55mi | 3/2.5 | 2,040 (+12%) | 5mo | $444,900 | $218 | 47 |
| 2301 O Clery Ave | 0.67mi | 3/2.0 | 2,068 (+14%) | 6mo | $372,389 | $180 | 40 |
Match score weights: distance 35% · size 25% · config 20% · recency 20%. Top-matched comps best support the ARV.
Projected returns pro-forma
-3.0% appreciation · 3.0% rent growth · sell at horizon
- IRR
- -9.3%
- Equity multiple
- 0.66×
- Total profit
- $-26,342
- Equity at exit
- $40,988
- IRR
- 0.0%
- Equity multiple
- 1.00×
- Total profit
- $239
- Equity at exit
- $23,768
Cash invested: $76,972 (down + closing). Projections, not guarantees.
Landlord ↔ Tenant lean methodology
- Overall (STATE)
- 83 Strongly Landlord-Friendly
- State Kentucky
- 83 Strongly Landlord-Friendly · R+16
- County
- — inherits STATE
- City
- — inherits STATE
ZIP-level market 41091
- Active inventory
- 469
- Price-to-rent
- 9.2×
Monthly cashflow live
- Estimated rent
- $2,495 medium interval (Pro) →
- Mortgage (P&I)
- −$1,442
- Tax from tax record
- −$128 /mo · $1,531/yr
- Insurance
- −$115
- HOA
- −$0
- Vacancy / Maint / Mgmt
- −$524
- Net cashflow
- $287
Break-even live
UW: 25.0% down · 7.5% · 30yr · 1.5% tax · 5.0% vac · 8.0% maint · 8.0% mgmt
Financing live
Cash to close
- Down payment
- $68,725
- Closing costs
- $8,247
- Reserves months
- —
- Total cash needed
- —
Loan-product check · same deal, 3 products live
Conventional
25% down · 7.5% · 30yr
- Down + closing
- —
- Monthly P&I
- —
- Monthly cashflow
- —
- DSCR
- —
- Eligible?
- —
Personal DTI + credit; lowest rate.
DSCR
20% down · 8.5% · 30yr
- Down + closing
- —
- Monthly P&I
- —
- Monthly cashflow
- —
- DSCR
- —
- Eligible?
- —
No personal income docs; deal must DSCR.
Hard money
10% down · 12.0% · 12mo
- Down + closing
- —
- Monthly P&I
- —
- Monthly cashflow
- —
- DSCR
- —
- Eligible?
- —
Short-term bridge; refi at stabilization.
Rent comps 1 comps
| Address | Beds | Baths | Sqft | Rent | $/sqft | DOM | Units | Dist |
|---|---|---|---|---|---|---|---|---|
| 4208 Aine Dr Union, KY | 3.0 | 2.5 | 1650 | $2,495 | $1.51 | 17d | 1 | 0.62mi |
Listing history 9 events
-
2026-06-18days on market $274,900 Active 19 DOM
-
2026-06-17days on market $274,900 Active 18 DOM
-
2026-06-16days on market $274,900 Active 17 DOM
-
2026-06-15days on market $274,900 Active 16 DOM
-
2026-06-13status $274,900 Active 14 DOM
-
2026-06-02statusdays on market $274,900 Pending 14 DOM
-
2026-06-01days on market $274,900 Active 13 DOM
-
2026-05-31days on market $274,900 Active 12 DOM
-
2026-05-15$274,900 Active
ⓘ Source: listings_history table (triggers on properties + properties_extension) + one-shot
backfill from property_details.listing_events for pre-trigger history.
Tax reassessment forecast KY · Resets to sale price
- Current annual tax
- $1,531 · $128/mo
- Projected year-2 tax
- $2,364 · $197/mo
- Expected delta
- +$833/yr (+$69/mo · 54.4%)
ⓘ Screening estimate from a state-policy table — verify with the county assessor before closing.
Climate risk First Street
- Flood 1/10 Low FEMA zone X (unshaded) · 0% chance over 30 yrs
- Wildfire 2/10 Low
- Heat 4/10 Moderate 7 d/yr ≥102°F today · 19 d/yr by 30 yrs out
- Wind 2/10 Low 100% chance of damaging wind over 30 yrs
- Air quality 3/10 Moderate 2 unhealthy d/yr today · 4 by 30 yrs out
Nearby sold comps map
Loading sold comps map…
Walkable amenities ~0.75 mi
Loading nearby amenities…
Taxation est. · year 1
- Rental income
- $29,940
- − Mortgage interest
- −$15,399
- − Property taxes
- −$1,531
- − Insurance
- −$1,374
- − Repairs & maintenance
- −$2,395
- − Management
- −$2,395
- − Depreciation
- −$7,997
- Taxable loss
- −$1,152
- Est. tax savings @ 24.0%
- +$276
- After-tax cash flow
- $3,724/yr
For passive investors: Depreciation is non-cash, so a rental often shows a tax loss while cash-flowing — sheltering income. Rental losses are passive: they offset passive income freely, and up to $25,000/yr can offset ordinary (W-2) income if you actively participate and your MAGI is under $100k (phasing out to $0 by $150k); unused losses carry forward. On sale, claimed depreciation is recaptured at up to 25%, and gains may owe capital-gains tax (a 1031 exchange can defer both). Figures are a year-1 estimate at your 24.0% rate — not tax advice; consult a CPA.
Schools (NCES district)
- District
- Boone County
- NCES district ID
- 2100510
- Math proficiency
- 43% ▼ -10.00%
- Reading proficiency
- 49% ▼ -12.00%
- Median HH income
- $68,096
- Composite
- 41.18/100
- National rank
- #3550
- State rank
- #12 of 165 in KY
Livability — Union
- Score
- 78/100
- State rank
- #79
- US rank
- #2521
Category grades
Schools grade is shown separately in the Schools card above.
Census & demographics
- Population (ZIP)
- 24,371
Population outlook (Boone County) Hauer SSP2
- Today (2025)
- 144,066 people
- By 2030
- 152,005 · +5.5%
- By 2040
- 166,776 · +15.8%
- By 2050
- 178,974 · +24.2%
- By 2075
- 204,515 · +42.0%
- By 2100
- 215,306 · +49.4%
Race, ethnicity, and origin ACS 2023
- Neighborhood character
- Predominantly White (90%)
- Race & ethnicity
- White 90% Two or more races 4% Asian 3% Black 2% Hispanic / Latino 2%
- Common ancestry
- Italian 4% Lithuanian 3% Serbian 2%
- Foreign-born
- 4% · Canada
- Languages at home
- 95% English-only · Spanish 1% Other Indo-European 1% Other Asian/Pacific 1%
Political lean MEDSL · Boone
- 2024 margin
- Solid R (+37.2) · D 30.6% · R 67.8% · Other 1.7%
- 2008→2024 swing
- -2.7pp toward R · 2008: -34.5pp · 2024: -37.2pp
- All cycles
- 2024: R+37.2 2020: R+35.7 2016: R+41.8 2012: R+38.7 2008: R+34.5
Not yet ingested
- Civics
- —
Market trends
- HPI YoY
- ▼ -101.29%
- Current HPI
- 175.3571
- Rent YoY
- —
- Metro
- —
- State GDP YoY
- ▲ 1.81%
- F500 in state
- 4
Industry mix (Fortune 500 HQ in KY)
| Industry | F500 HQs | Revenue |
|---|---|---|
| Healthcare | 1 | $118B |
|
||
| Food / Beverage | 1 | $7B |
|
||
Price history
1 event — show timeline
- 2026-05-15 Listed $274,900 NKMLS
Property tax history
+4.2%/yrLatest (2025): $1,531 · -0.4% YoY. Source: county tax records.
Cash-flow waterfall
monthlySold comps — $/sqft
last 12 mo · ≤1 miLoading sold comps…