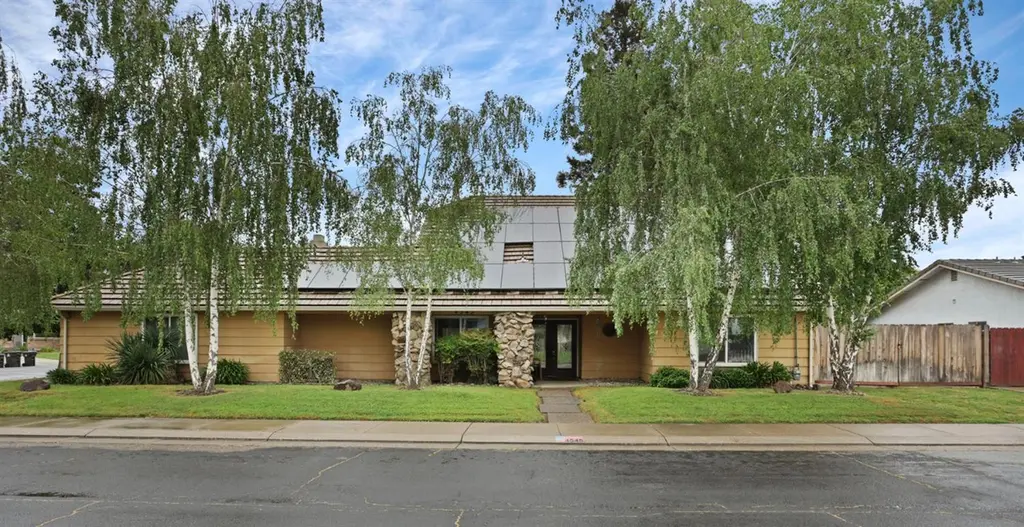
4545 Winding River Cir · Stockton, CA
Flood risk 4/10 · Minor
- FEMA flood zone
- X
- Chance of flooding over 30 yrs
- 0.22%
- Est. flood insurance / yr
- $507 – $1,088
Fire risk 1/10 · Minimal
- Est. fire insurance / yr
- $659 – $1,223
Heat risk 7/10 · Major
- Hot days now (above 103°F)
- 7 days/yr
- Hot days in 30 yrs
- 15 days/yr
Wind risk 1/10 · Minimal
- Chance of severe wind over 30 yrs
- —
Air-quality risk 10/10 · Severe
- Unhealthy air days now
- 30 days/yr
- Unhealthy air days in 30 yrs
- 30 days/yr
Risk factors via First Street. Map © Google.
Why this score? — see what drove the D grade
The composite is a weighted blend of 9 inputs, each scored 0–100. Each bar is that input's sub-score; the figure is the points it added to the 100-point composite (weight × sub-score).
- Appreciation +10.0/10.0
- ARV discount +8.8/15.0
- Cash flow +7.6/30.0
- Rent growth +3.5/5.0
- Schools +3.0/10.0
- Livability +2.9/5.0
- Condition / age +2.5/5.0
- 1% rule +1.8/10.0
- DSCR +1.7/10.0
$599,000
🖨 Deal sheet (PDF) 📄 Offer letter ✓ Due diligence
Listing remarks
Located in one of the most established and desirable Stockton neighborhoods, Winding River Circle, this home offers comfort and value. Featuring a 3 year old redone pool & spa, it's perfect for entertaining or unwinding in your own backyard. With this strong market positioning home owners will enjoy the added benefit of immediate equity.
Key facts
- 7,802 sq ft lot
- 2 garage spots
- Pool
Neighborhood map
What this means for you Summary
Snapshot
- This is a 5-bed/3.0-bath single-family listed at $599k.
Deal economics
- At list price, monthly cash flow is $-725 ($-9k/yr) — negative.
- To cash-flow at today's rent, offer at most $471k (21.4% below list).
- To meet the 1% rule (rent ≥ 1% of price), the offer needs to be $405k (32.4% below list).
- Recommended offer: $405k (32.4% below list) — sets the bar for 1% rule.
- Cap rate 4.8% vs local median 3.6% in Stockton — top-decile yield for the area; either an underpriced asset or a hidden risk that comps aren't pricing in. Stress-test before assuming the spread holds.
Location & tenants
- Location reads 57/100 on livability (#734 in CA) — a working-class tenant base; expect higher turnover. Strengths: housing A+, health & safety A, amenities A-; Watch: employment C-, crime F, commute F.
- Lincoln Unified (urban): math 26% / reading 41% proficiency, ranked #284 of 517 in CA (top 55%) — families likely to look elsewhere, expect single-tenant / working-renter base with shorter leases.
- Zoned schools: Claudia Landeen (math 19% / reading 30%, grade F, #973 of 1,571 statewide, top 73%, 525 students, 77% FRL); Sierra Middle (math 25% / reading 48%, grade F, #175 of 498 statewide, top 36%, 572 students, 73% FRL); Lincoln High (math 35% / reading 64%, grade D, #352 of 1,170 statewide, top 31%, 2,936 students, 53% FRL) — zoned schools average 68% FRL vs 50% district-wide (18 pts higher); higher-poverty schools than district average — tighter screening recommended.
- Market conditions: Rents rising fast (+4.2%/yr); 217 active listings in the ZIP; 4 comparable units currently listed for rent nearby; rentals lingering (median 46d on market — plan ~5-8 weeks vacancy on turnover, expect pricing pressure); 50% of comp listings sitting > 30 days — soft ceiling on asking rent; high-income renter base; 3,779 units permitted in San Joaquin County in 2024 (0 in 5+ unit buildings).
- This rent runs 43% of the median local income ($112k/yr) — at the standard rent-burdened threshold; future hikes will face affordability resistance.
Forward outlook
- In year one you build about $64k of equity ($4k loan paydown + $60k appreciation (10.0% local appreciation)).
- San Joaquin County population projected at +17% by 2050 — long-run rental-demand tailwind backs the buy-and-hold thesis.
- By year 2, paydown + projected appreciation supports a ~$103k cash-out refi (75% LTV) — recoverable capital for the next deal without selling this one.
Negotiation context
- It's been on market 41 days — a 3% lower offer ($581k) is reasonable based on typical stale-listing flexibility.
- Current owner paid $424k; 41% above their basis — modest negotiation headroom, anchor on the comps not their cost.
Risks & watch-outs
- Climate carrying-cost: extreme-heat days projected 7→15/yr by 2055 (HVAC capex compounding) — expect insurance premiums to compound above CPI over the hold.
Questions for the listing agent
- What do current leases actually rent for vs. the listed asking? Can we see a recent rent roll and the last 12 months of T-12 income?
- It's been on market 41 days. Have you received any prior offers? Is the seller open to a 32% concession, seller financing, or rate buy-down credit?
- Built in 1979 — when were the roof, HVAC, electrical panel, plumbing, and water heater last replaced?
- What does the HOA fee cover, when was the last increase, and are there any pending special assessments or reserve-fund shortfalls?
- Is there a deadline driving the sale (1031 exchange, divorce, estate, relocation)? That informs how much negotiation room exists.
- Schools are D-rated, which usually means shorter tenancies and higher turnover. Who's the typical renter profile here, and what's been the actual vacancy rate?
- Crime grade is F in this area — have there been break-ins, vandalism, or insurance claims at this property in the last 3 years? What carrier currently insures it and at what premium?
- The area grade is low — what's the realistic commute time and amenity access for the typical tenant pool here? Any planned neighborhood developments (good or bad) we should know about?
- What's the average days-on-market for RENTAL listings here right now (not sales)? A rising rental-DOM trend means longer vacancies and softer asking-rent achievability than the comps imply.
- What's the recent tenant-quality profile in this submarket — average credit score on applications, eviction rate, late-payment / NSF rate, and stable-employment percentage? A property-management company in the area should have these aggregated.
- How much new for-sale + rental construction is in the pipeline within 1–3 miles? Heavy new supply typically softens prices + rents 12–24 months out; constrained supply supports both.
Investment metrics
- 1% rule
- 0.68% ✗
- Cap rate
- 4.84%
- Cash-on-cash
- -5.18%
- DSCR
- 0.77
- GRM
- 12.3
CMA / ARV
- ARV (median comp)
- $616,235
- List price
- $599,000
- Delta
- -2.80%
- Verdict
- FAIR
- Comps
- 20 within 1.0 mi
Show comp detail 12 sales within ~0.75 mi
| Address | Dist | Beds/Ba | Sqft | Sold | Price | $/sf | Match |
|---|---|---|---|---|---|---|---|
| 4545 Winding River Cir | 0.00mi | 5/3.0 | 2,493 (0%) | 0mo | $600,000 | $241 | 100 |
| 2918 Snowbrook Ct | 0.07mi | 5/3.5 | 2,461 (-1%) | 18mo | $548,000 | $223 | 77 |
| 4430 Winding River Cir | 0.14mi | 5/3.0 | 2,374 (-5%) | 10mo | $668,000 | $281 | 77 |
| 4301 Boulder Creek Cir | 0.18mi | 5/3.0 | 2,390 (-4%) | 18mo | $605,000 | $253 | 70 |
| 4240 Pinehurst Cir | 0.55mi | 4/3.0 (-1) | 2,390 (-4%) | 1mo | $670,000 | $280 | 62 |
| 4119 Saint Andrews Dr | 0.50mi | 4/3.0 (-1) | 2,572 (+3%) | 17mo | $825,000 | $321 | 52 |
| 3611 Longcove Ct | 0.63mi | 4/2.5 (-1) | 2,443 (-2%) | 19mo | $788,000 | $323 | 45 |
| 3338 Heatherbrook Dr | 0.61mi | 4/3.0 (-1) | 2,390 (-4%) | 18mo | $600,000 | $251 | 45 |
| 2565 Michaelangelo | 0.57mi | 4/2.5 (-1) | 2,345 (-6%) | 15mo | $560,000 | $239 | 44 |
| 6863 Brook Falls Cir | 0.68mi | 4/2.5 (-1) | 2,520 (+1%) | 21mo | $705,000 | $280 | 42 |
| 6777 Brook Falls Cir | 0.73mi | 4/3.0 (-1) | 2,311 (-7%) | 10mo | $545,000 | $236 | 41 |
| 3395 Willowbrook Cir | 0.55mi | 4/3.0 (-1) | 2,120 (-15%) | 13mo | $605,000 | $285 | 34 |
Match score weights: distance 35% · size 25% · config 20% · recency 20%. Top-matched comps best support the ARV.
Projected returns pro-forma
10.0% appreciation · 4.16% rent growth · sell at horizon
- IRR
- 20.9%
- Equity multiple
- 2.70×
- Total profit
- $284,784
- Equity at exit
- $539,627
- IRR
- 19.2%
- Equity multiple
- 6.28×
- Total profit
- $884,960
- Equity at exit
- $1,163,725
Cash invested: $167,720 (down + closing). Projections, not guarantees.
Landlord ↔ Tenant lean methodology
- Overall (STATE)
- 18 Strongly Tenant-Friendly
- State California
- 18 Strongly Tenant-Friendly · D+13
- County
- — inherits STATE
- City
- — inherits STATE
ZIP-level market 95219
- Home prices YoY
- 6.6%
- Rents YoY
- 4.2%
- Active inventory
- 217
- Price-to-rent
- 12.3×
Monthly cashflow live
- Estimated rent
- $4,048 medium interval (Pro) →
- Mortgage (P&I)
- −$3,141
- Tax from tax record
- −$479 /mo · $5,754/yr
- Insurance
- −$250
- HOA
- −$52
- Vacancy / Maint / Mgmt
- −$850
- Net cashflow
- $-725
Break-even live
Sensitivity live
| Price | -10% $-386 | -5% $-555 | +0% $-725 | +5% $-894 | +10% $-1,064 |
|---|---|---|---|---|---|
| Rent | -10% $-1,044 | -5% $-885 | +0% $-725 | +5% $-565 | +10% $-405 |
| Rate | -1.0pp $-423 | -0.5pp $-572 | base $-725 | +0.5pp $-880 | +1.0pp $-1,038 |
UW: 25.0% down · 7.5% · 30yr · 1.5% tax · 5.0% vac · 8.0% maint · 8.0% mgmt
Financing live
Cash to close
- Down payment
- $149,750
- Closing costs
- $17,970
- Reserves months
- —
- Total cash needed
- —
Loan-product check · same deal, 3 products live
Conventional
25% down · 7.5% · 30yr
- Down + closing
- —
- Monthly P&I
- —
- Monthly cashflow
- —
- DSCR
- —
- Eligible?
- —
Personal DTI + credit; lowest rate.
DSCR
20% down · 8.5% · 30yr
- Down + closing
- —
- Monthly P&I
- —
- Monthly cashflow
- —
- DSCR
- —
- Eligible?
- —
No personal income docs; deal must DSCR.
Hard money
10% down · 12.0% · 12mo
- Down + closing
- —
- Monthly P&I
- —
- Monthly cashflow
- —
- DSCR
- —
- Eligible?
- —
Short-term bridge; refi at stabilization.
Rent comps 4 comps
| Address | Beds | Baths | Sqft | Rent | $/sqft | DOM | Units | Dist |
|---|---|---|---|---|---|---|---|---|
| 3906 Brook Valley Cir Stockton, CA | 4.0 | 3.0 | 2426 | $3,100 | $1.28 | 45d | 1 | 0.71mi |
| 3936 Dennis Ave Stockton, CA | 4.0 | 2.0 | 1583 | $2,625 | $1.66 | 4d | 1 | 0.84mi |
| 3616 Wood Duck Cir Stockton, CA | 5.0 | 3.0 | 2302 | $7,500 | $3.26 | 25d | 1 | 0.85mi |
| 5956 Saint Andrews Dr Stockton, CA | 4.0 | 2.5 | 3345 | $3,300 | $0.99 | 45d | 1 | 1.29mi |
HOA detail
- Monthly dues
- $52 · $624/yr
- Likely covers
- pool
Listing history 3 events
-
2017-09-07soldstatus $424,000
-
2009-07-28soldstatus $350,000
-
2001-10-25soldstatus $313,000
ⓘ Source: listings_history table (triggers on properties + properties_extension) + one-shot
backfill from property_details.listing_events for pre-trigger history.
Tax reassessment forecast CA · Resets to sale price
- Current annual tax
- $5,754 · $479/mo
- Projected year-2 tax
- $5,754 · $479/mo
- Expected delta
- $0/yr ($0/mo · 0.0%)
ⓘ Screening estimate from a state-policy table — verify with the county assessor before closing.
Climate risk First Street
- Flood 4/10 Moderate FEMA zone X · 22% chance over 30 yrs
- Wildfire 1/10 Low
- Heat 7/10 Severe 7 d/yr ≥103°F today · 15 d/yr by 30 yrs out
- Wind 1/10 Low
- Air quality 10/10 Extreme 30 unhealthy d/yr today · 30 by 30 yrs out
Nearby sold comps map
Loading sold comps map…
Walkable amenities ~0.75 mi
Loading nearby amenities…
Taxation est. · year 1
- Rental income
- $48,572
- − Mortgage interest
- −$33,553
- − Property taxes
- −$5,754
- − Insurance
- −$2,995
- − Repairs & maintenance
- −$3,886
- − Management
- −$3,886
- − HOA
- −$624
- − Depreciation
- −$17,425
- Taxable loss
- −$19,551
- Est. tax savings @ 24.0%
- +$4,692
- After-tax cash flow
- $-4,003/yr
For passive investors: Depreciation is non-cash, so a rental often shows a tax loss while cash-flowing — sheltering income. Rental losses are passive: they offset passive income freely, and up to $25,000/yr can offset ordinary (W-2) income if you actively participate and your MAGI is under $100k (phasing out to $0 by $150k); unused losses carry forward. On sale, claimed depreciation is recaptured at up to 25%, and gains may owe capital-gains tax (a 1031 exchange can defer both). Figures are a year-1 estimate at your 24.0% rate — not tax advice; consult a CPA.
Schools (NCES district)
- District
- Lincoln Unified
- NCES district ID
- 0621690
- Math proficiency
- 26% ▼ -11.00%
- Reading proficiency
- 41% ▼ -11.00%
- Median HH income
- $56,356
- Composite
- 29.66/100
- National rank
- #6465
- State rank
- #284 of 517 in CA
Livability — Stockton
- Score
- 57/100
- State rank
- #734
- US rank
- #21638
Category grades
Schools grade is shown separately in the Schools card above.
Census & demographics
- Census place
- Stockton, CA
- County
- San Joaquin County · 729,570 people
- City population
- 332,006
- Metro
- Stockton, CA
- Population (ZIP)
- 31,713
- Household income
- $112,268
- Rent vs Own
- Severe rent burden
- 825.0
Population outlook (San Joaquin County) Hauer SSP2
- Today (2025)
- 796,965 people
- By 2030
- 828,849 · +4.0%
- By 2040
- 885,611 · +11.1%
- By 2050
- 929,798 · +16.7%
- By 2075
- 994,578 · +24.8%
- By 2100
- 971,291 · +21.9%
Race, ethnicity, and origin ACS 2023
- Neighborhood character
- Highly diverse neighborhood (Simpson 0.75)
- Race & ethnicity
- White 33% Hispanic / Latino 30% Asian 21% Two or more races 18% Black 9%
- Hispanic origin (detail)
- Mexican 27%
- Common ancestry
- Slovak 2% Italian 2% Portuguese 1%
- Foreign-born
- 20% · Canada, China, Vietnam
- Languages at home
- 69% English-only · Spanish 14% Other Indo-European 4% Other Asian/Pacific 4%
Political lean MEDSL · San Joaquin
- 2024 margin
- Toss-up / Even · D 48.0% · R 48.9% · Other 3.0%
- 2008→2024 swing
- -11.6pp toward R · 2008: 10.7pp · 2024: -0.9pp
- All cycles
- 2024: R+0.9 2020: D+13.9 2016: D+12.9 2012: D+8.9 2008: D+10.7
Not yet ingested
- Civics
- —
Market trends
- HPI YoY
- ▲ 69.26%
- Current HPI
- 1122.61
- Rent YoY
- ▲ 4.16%
- Metro
- Stockton, CA
- State GDP YoY
- ▲ 3.21%
- F500 in state
- 116
Industry mix (Fortune 500 HQ in CA)
| Industry | F500 HQs | Revenue |
|---|---|---|
| Technology | 27 | $1,492B |
|
||
| Financial Services | 3 | $174B |
|
||
| Retail | 3 | $44B |
|
||
| Insurance | 3 | $26B |
|
||
| Media / Entertainment | 2 | $115B |
|
||
| Pharmaceuticals / Biotech | 2 | $62B |
|
||
Price history
+35.5% since first listed3 events — show timeline
- 2017-09-07 Sold (Public Records) $424,000 Public Records
- 2009-07-28 Sold (Public Records) $350,000 Public Records
- 2001-10-25 Sold (Public Records) $313,000 Public Records
Property tax history
+2.2%/yrLatest (2025): $5,754 · +2.2% YoY. Source: county tax records.
Cash-flow waterfall
monthlySold comps — $/sqft
last 12 mo · ≤1 miLoading sold comps…