1823 Freeland Ave · San Angelo, TX
Flood risk No data
- FEMA flood zone
- —
- Chance of flooding over 30 yrs
- —
- Est. flood insurance / yr
- —
Fire risk No data
- Est. fire insurance / yr
- —
Heat risk No data
- Hot days now (above threshold)
- —
- Hot days in 30 yrs
- —
Wind risk No data
- Chance of severe wind over 30 yrs
- —
Air-quality risk No data
- Unhealthy air days now
- —
- Unhealthy air days in 30 yrs
- —
Risk factors via First Street. Map © Google.
Why this score? — see what drove the D grade
The composite is a weighted blend of 9 inputs, each scored 0–100. Each bar is that input's sub-score; the figure is the points it added to the 100-point composite (weight × sub-score).
- Cash flow +11.3/30.0
- Appreciation +10.0/10.0
- Rent growth +3.9/5.0
- Livability +3.7/5.0
- 1% rule +3.3/10.0
- DSCR +3.3/10.0
- Schools +2.6/10.0
- Condition / age +2.2/5.0
- ARV discount +1.3/15.0
$249,900
🖨 Deal sheet (PDF) 📄 Offer letter ✓ Due diligence
Listing remarks MLS
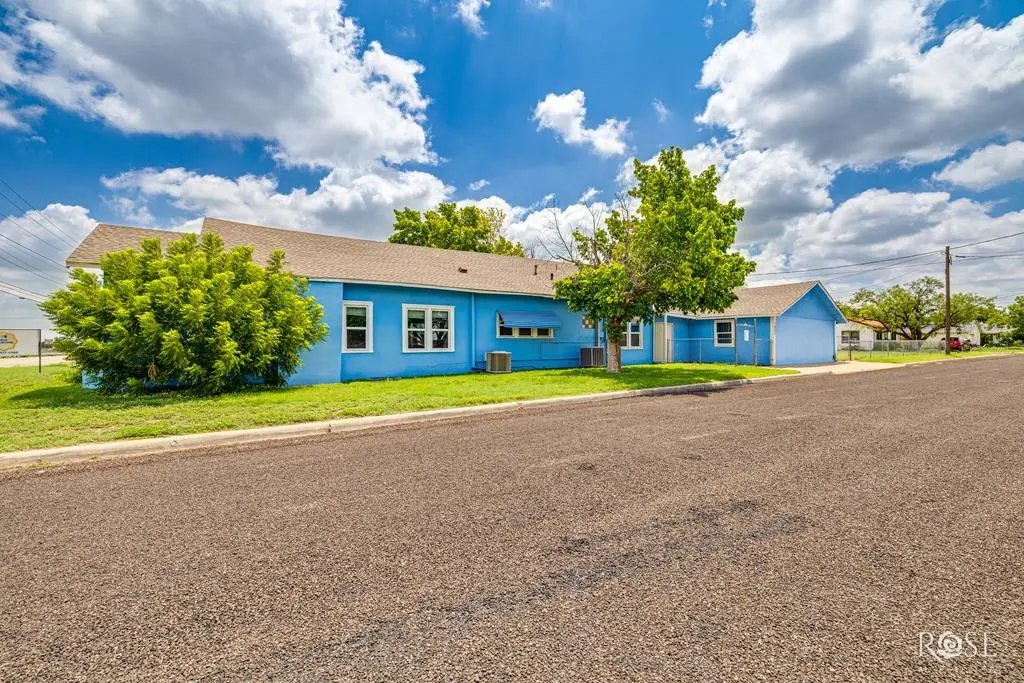
Spacious home offering over 3000 sq. ft. with an incredibly flexible floor plan- situated on two lots-on almost 1/2 acre. Previously used as a commercial daycare, the home provides multiple large spaces ideal for playrooms, home offices, or gathering areas. The fenced side yard and backyard offer plenty of room for kids and pets to play. With its convenient location and versatile floor plan, this home is a wonderful fit for growing families, multi-generational living or anyone needing extra space to spread out. Call today for your showing!
Key facts
- Flexible floor plan
- Fenced side yard
- Backyard
Tags
Neighborhood map
What this means for you Summary
Snapshot
- This is a 4-bed/1.5-bath single-family listed at $250k. Condition is rated fair.
Deal economics
- At list price, monthly cash flow is $-90 ($-1k/yr) — negative.
- To cash-flow at today's rent, offer at most $237k (5.2% below list).
- To meet the 1% rule (rent ≥ 1% of price), the offer needs to be $207k (17.1% below list).
- Recommended offer: $207k (17.1% below list) — sets the bar for 1% rule.
- Cap rate 5.9% vs local median 3.8% in San Angelo — top-decile yield for the area; either an underpriced asset or a hidden risk that comps aren't pricing in. Stress-test before assuming the spread holds.
Location & tenants
- Location reads 73/100 on livability (#199 in TX) — a middle-class / working-renter tenant base. Strengths: cost of living A+, housing A+, health & safety A+; Watch: employment C-, amenities F, commute F.
- San Angelo ISD (urban): math 27% / reading 33% proficiency, ranked #627 of 826 in TX (top 76%) — families likely to look elsewhere, expect single-tenant / working-renter base with shorter leases.
- Zoned schools: Austin El (math 22% / reading 22%, grade F, #3,333 of 4,322 statewide, top 80%, 355 students, 79% FRL); Lone Star Middle (math 28% / reading 32%, grade F, #1,056 of 1,662 statewide, top 65%, 903 students, 63% FRL); Central H S (math 22% / reading 43%, grade F, #1,029 of 1,632 statewide, top 64%, 3,065 students, 48% FRL).
- Market conditions: Rents rising fast (+5.8%/yr); 334 active listings in the ZIP; 1 comparable units currently listed for rent nearby; 233 units permitted in Tom Green County in 2024 (0 in 5+ unit buildings).
- This rent runs 36% of the median local income ($69k/yr) — at the standard rent-burdened threshold; future hikes will face affordability resistance.
Forward outlook
- In year one you build about $27k of equity ($2k loan paydown + $25k appreciation (10.0% local appreciation)).
- Tom Green County population projected at +35% by 2050 — long-run rental-demand tailwind backs the buy-and-hold thesis.
- By year 2, paydown + projected appreciation supports a ~$43k cash-out refi (75% LTV) — recoverable capital for the next deal without selling this one.
Negotiation context
- It's been on market 138 days — a 12% lower offer ($220k) is reasonable based on typical stale-listing flexibility.
- 3 sale attempts since 4y ago; this cycle's ask has dropped $25k (9%) from the opening price — seller is motivated, your offer sets the floor, not the list.
Risks & watch-outs
- Watch-outs: built in 1959 — expect roof / HVAC / electrical / plumbing capex.
Questions for the listing agent
- What do current leases actually rent for vs. the listed asking? Can we see a recent rent roll and the last 12 months of T-12 income?
- It's been on market 138 days. Have you received any prior offers? Is the seller open to a 17% concession, seller financing, or rate buy-down credit?
- Have any recent inspections been done? Can we get a copy of the seller's disclosures and any deferred-maintenance estimates?
- Built in 1959 — when were the roof, HVAC, electrical panel, plumbing, and water heater last replaced?
- Why hasn't it sold? Are there any deal-killer items the seller is aware of (foundation, flood, title, zoning, code violations)?
- Is there a deadline driving the sale (1031 exchange, divorce, estate, relocation)? That informs how much negotiation room exists.
- Schools are F-rated, which usually means shorter tenancies and higher turnover. Who's the typical renter profile here, and what's been the actual vacancy rate?
- The area grade is low — what's the realistic commute time and amenity access for the typical tenant pool here? Any planned neighborhood developments (good or bad) we should know about?
- What's the average days-on-market for RENTAL listings here right now (not sales)? A rising rental-DOM trend means longer vacancies and softer asking-rent achievability than the comps imply.
- What's the recent tenant-quality profile in this submarket — average credit score on applications, eviction rate, late-payment / NSF rate, and stable-employment percentage? A property-management company in the area should have these aggregated.
- How much new for-sale + rental construction is in the pipeline within 1–3 miles? Heavy new supply typically softens prices + rents 12–24 months out; constrained supply supports both.
Investment metrics
- 1% rule
- 0.83% ✗
- Cap rate
- 5.86%
- Cash-on-cash
- -1.54%
- DSCR
- 0.93
- GRM
- 10.0
CMA / ARV
- ARV (median comp)
- $219,446
- List price
- $249,900
- Delta
- 13.88%
- Verdict
- OVERPRICED
- Comps
- 20 within 1.0 mi
Show comp detail 3 sales within ~0.75 mi
| Address | Dist | Beds/Ba | Sqft | Sold | Price | $/sf | Match |
|---|---|---|---|---|---|---|---|
| 2208 Waco St | 0.34mi | 4/3.5 | 3,150 (+2%) | 13mo | $340,000 | $108 | 62 |
| 910 - 918 N Jefferson St | 0.49mi | 5/4.0 (+1) | 2,638 (-14%) | 5mo | $342,500 | $130 | 34 |
| 209 Bishop St | 0.47mi | 3/2.5 (-1) | 2,650 (-14%) | 20mo | $199,000 | $75 | 29 |
Match score weights: distance 35% · size 25% · config 20% · recency 20%. Top-matched comps best support the ARV.
Projected returns pro-forma
10.0% appreciation · 5.78% rent growth · sell at horizon
- IRR
- 24.1%
- Equity multiple
- 2.95×
- Total profit
- $136,378
- Equity at exit
- $225,130
- IRR
- 22.1%
- Equity multiple
- 7.00×
- Total profit
- $419,694
- Equity at exit
- $485,501
Cash invested: $69,972 (down + closing). Projections, not guarantees.
Landlord ↔ Tenant lean methodology
- Overall (STATE)
- 87 Strongly Landlord-Friendly
- State Texas
- 87 Strongly Landlord-Friendly · R+5
- County
- — inherits STATE
- City
- — inherits STATE
ZIP-level market 76901
- Home prices YoY
- 6.4%
- Rents YoY
- 5.8%
- Active inventory
- 334
- Price-to-rent
- 10.0×
Monthly cashflow live
- Estimated rent
- $2,073 medium interval (Pro) →
- Mortgage (P&I)
- −$1,311
- Tax est. 1.5%
- −$312 /mo · $3,748/yr
- Insurance
- −$104
- HOA
- −$0
- Vacancy / Maint / Mgmt
- −$435
- Net cashflow
- $-90
Break-even live
Sensitivity live
| Price | -10% $83 | -5% $-3 | +0% $-90 | +5% $-176 | +10% $-262 |
|---|---|---|---|---|---|
| Rent | -10% $-253 | -5% $-172 | +0% $-90 | +5% $-8 | +10% $74 |
| Rate | -1.0pp $36 | -0.5pp $-26 | base $-90 | +0.5pp $-154 | +1.0pp $-220 |
UW: 25.0% down · 7.5% · 30yr · 1.5% tax · 5.0% vac · 8.0% maint · 8.0% mgmt
Financing live
Cash to close
- Down payment
- $62,475
- Closing costs
- $7,497
- Reserves months
- —
- Total cash needed
- —
Loan-product check · same deal, 3 products live
Conventional
25% down · 7.5% · 30yr
- Down + closing
- —
- Monthly P&I
- —
- Monthly cashflow
- —
- DSCR
- —
- Eligible?
- —
Personal DTI + credit; lowest rate.
DSCR
20% down · 8.5% · 30yr
- Down + closing
- —
- Monthly P&I
- —
- Monthly cashflow
- —
- DSCR
- —
- Eligible?
- —
No personal income docs; deal must DSCR.
Hard money
10% down · 12.0% · 12mo
- Down + closing
- —
- Monthly P&I
- —
- Monthly cashflow
- —
- DSCR
- —
- Eligible?
- —
Short-term bridge; refi at stabilization.
Rent comps 1 comps
| Address | Beds | Baths | Sqft | Rent | $/sqft | DOM | Units | Dist |
|---|---|---|---|---|---|---|---|---|
| 2018 Douglas Dr San Angelo, TX | 5.0 | 3.0 | 2672 | $2,400 | $0.90 | 23d | 1 | 1.37mi |
Listing history 20 events
-
2026-06-22days on market $249,900 Active 138 DOM
-
2026-06-19days on market $249,900 Active 136 DOM
-
2026-06-18days on market $249,900 Active 135 DOM
-
2026-06-17days on market $249,900 Active 134 DOM
-
2026-06-16days on market $249,900 Active 133 DOM
-
2026-06-15days on market $249,900 Active 132 DOM
-
2026-06-14days on market $249,900 Active 130 DOM
-
2026-06-13days on market $249,900 Active 129 DOM
-
2026-06-10days on market $249,900 Active 127 DOM
-
2026-06-09days on market $249,900 Active 126 DOM
-
2026-06-08days on market $249,900 Active 125 DOM
-
2026-06-07days on market $249,900 Active 124 DOM
-
2026-06-02days on market $249,900 Active 119 DOM
-
2026-06-01days on market $249,900 Active 118 DOM
-
2026-05-31days on market $249,900 Active 117 DOM
-
2026-05-30days on market $249,900 Active 116 DOM
-
2026-03-20price $249,900 545-char remark
Show marketing remark (545 chars)
Spacious home offering over 3000 sq. ft. with an incredibly flexible floor plan- situated on two lots-on almost 1/2 acre. Previously used as a commercial daycare, the home provides multiple large spaces ideal for playrooms, home offices, or gathering areas. The fenced side yard and backyard offer plenty of room for kids and pets to play. With its convenient location and versatile floor plan, this home is a wonderful fit for growing families, multi-generational living or anyone needing extra space to spread out. Call today for your showing!
-
2026-02-03$275,000 Active 545-char remark
Show marketing remark (545 chars)
Spacious home offering over 3000 sq. ft. with an incredibly flexible floor plan- situated on two lots-on almost 1/2 acre. Previously used as a commercial daycare, the home provides multiple large spaces ideal for playrooms, home offices, or gathering areas. The fenced side yard and backyard offer plenty of room for kids and pets to play. With its convenient location and versatile floor plan, this home is a wonderful fit for growing families, multi-generational living or anyone needing extra space to spread out. Call today for your showing!
-
2023-01-19status Active
-
2022-07-18$300,000 Active
ⓘ Source: listings_history table (triggers on properties + properties_extension) + one-shot
backfill from property_details.listing_events for pre-trigger history.
Nearby sold comps map
Loading sold comps map…
Walkable amenities ~0.75 mi
Loading nearby amenities…
Taxation est. · year 1
- Rental income
- $24,870
- − Mortgage interest
- −$13,998
- − Property taxes
- −$3,748
- − Insurance
- −$1,250
- − Repairs & maintenance
- −$1,990
- − Management
- −$1,990
- − Depreciation
- −$7,270
- Taxable loss
- −$5,375
- Est. tax savings @ 24.0%
- +$1,290
- After-tax cash flow
- $214/yr
For passive investors: Depreciation is non-cash, so a rental often shows a tax loss while cash-flowing — sheltering income. Rental losses are passive: they offset passive income freely, and up to $25,000/yr can offset ordinary (W-2) income if you actively participate and your MAGI is under $100k (phasing out to $0 by $150k); unused losses carry forward. On sale, claimed depreciation is recaptured at up to 25%, and gains may owe capital-gains tax (a 1031 exchange can defer both). Figures are a year-1 estimate at your 24.0% rate — not tax advice; consult a CPA.
Condition & rehab AI · 12 photos
This property requires moderate rehabilitation to improve its condition and appearance, enhancing its resale and rental value.
Repairs flagged
- Major exterior paint — Blue exterior paint is peeling
- Major interior paint — Painted walls are chipping
- Major flooring — Carpeted floors are worn
Value-add opportunities
- Resale paint exterior — Fresh paint enhances curb appeal
- Resale paint interior — Fresh paint improves interior appearance
- Resale replace carpet — New carpet enhances comfort and appearance
- Resale update kitchen cabinets — Fresh cabinets improve kitchen functionality and appearance
- Resale update bathrooms — Fresh fixtures and paint improve bathroom functionality and appearance
Renovation cost estimate screening
| Repair item | Severity | Est. cost |
|---|---|---|
| exterior paint · Blue exterior paint is peeling | Major | $15,000–50,000 |
| interior paint · Painted walls are chipping | Major | $15,000–50,000 |
| flooring · Carpeted floors are worn | Major | $15,000–50,000 |
| Total estimated repair cost · 3 items | $45,000–150,000 |
Value-add ROI direction
- Resale paint exterior — Fresh paint enhances curb appeal ↑
- Resale paint interior — Fresh paint improves interior appearance ↑
- Resale replace carpet — New carpet enhances comfort and appearance ↑
- Resale update kitchen cabinets — Fresh cabinets improve kitchen functionality and appearance ↑
- Resale update bathrooms — Fresh fixtures and paint improve bathroom functionality and appearance ↑
ⓘ Cost ranges are severity-bucket heuristics (US national rule-of-thumb). Get contractor quotes + a written scope before underwriting a rehab budget.
Schools (NCES district)
- District
- San Angelo ISD
- NCES district ID
- 4838700
- Math proficiency
- 27% ▼ -9.00%
- Reading proficiency
- 33% ▼ -3.00%
- Median HH income
- $43,501
- Composite
- 25.56/100
- National rank
- #7427
- State rank
- #627 of 826 in TX
Livability — San Angelo
- Score
- 73/100
- State rank
- #199
- US rank
- #5030
Category grades
Schools grade is shown separately in the Schools card above.
Census & demographics
- Census place
- San Angelo, TX
- County
- Tom Green County · 113,188 people
- City population
- 81,357
- Metro
- San Angelo, TX
- Population (ZIP)
- 31,831
- Household income
- $69,450
- Rent vs Own
- Severe rent burden
- 1034.0
Population outlook (Tom Green County) Hauer SSP2
- Today (2025)
- 135,110 people
- By 2030
- 144,090 · +6.6%
- By 2040
- 162,561 · +20.3%
- By 2050
- 182,158 · +34.8%
- By 2075
- 232,274 · +71.9%
- By 2100
- 268,218 · +98.5%
Race, ethnicity, and origin ACS 2023
- Neighborhood character
- Majority White (55%)
- Race & ethnicity
- White 55% Hispanic / Latino 41% Two or more races 17% Black 2%
- Hispanic origin (detail)
- Mexican 38%
- Common ancestry
- Lithuanian 3% Slovak 3% Iranian 1%
- Foreign-born
- 5% · Canada
- Languages at home
- 77% English-only · Spanish 21% German/W. Germanic 1%
Political lean MEDSL · Tom Green
- 2024 margin
- Solid R (+48.0) · D 25.5% · R 73.5% · Other 1.0%
- 2008→2024 swing
- -6.3pp toward R · 2008: -41.7pp · 2024: -48.0pp
- All cycles
- 2024: R+48.0 2020: R+44.4 2016: R+47.9 2012: R+47.9 2008: R+41.7
Not yet ingested
- Civics
- —
Market trends
- HPI YoY
- ▲ 47.96%
- Current HPI
- 798.58
- Rent YoY
- ▲ 5.78%
- Metro
- San Angelo, TX
- State GDP YoY
- ▲ 3.95%
- F500 in state
- 110
Industry mix (Fortune 500 HQ in TX)
| Industry | F500 HQs | Revenue |
|---|---|---|
| Energy | 16 | $1,198B |
|
||
| Technology | 5 | $198B |
|
||
| Engineering / Construction | 4 | $72B |
|
||
| Energy Services | 3 | $60B |
|
||
| Utilities | 3 | $41B |
|
||
| Healthcare | 2 | $330B |
|
||
Price history
-16.7% since first listed4 events — show timeline
- 2026-03-20 Price Changed $249,900 SAAR TX
- 2026-02-03 Listed $275,000 SAAR TX
- 2023-01-19 Relisted — SAAR TX
- 2022-07-18 Listed $300,000 SAAR TX
Cash-flow waterfall
monthlySold comps — $/sqft
last 12 mo · ≤1 miLoading sold comps…