189 NE 156th St · Cross City, FL
Flood risk 6/10 · Moderate
- FEMA flood zone
- AE
- Chance of flooding over 30 yrs
- 0.69%
- Est. flood insurance / yr
- $1,737 – $8,500
Fire risk 5/10 · Moderate
- Est. fire insurance / yr
- $947 – $1,759
Heat risk 8/10 · Major
- Hot days now (above 105°F)
- 6 days/yr
- Hot days in 30 yrs
- 19 days/yr
Wind risk 9/10 · Severe
- Chance of severe wind over 30 yrs
- 99.0%
Air-quality risk 2/10 · Minimal
- Unhealthy air days now
- 1 days/yr
- Unhealthy air days in 30 yrs
- 2 days/yr
Risk factors via First Street. Map © Google.
Why this score? — see what drove the B+ grade
The composite is a weighted blend of 9 inputs, each scored 0–100. Each bar is that input's sub-score; the figure is the points it added to the 100-point composite (weight × sub-score).
- Cash flow +30.0/30.0
- 1% rule +10.0/10.0
- DSCR +10.0/10.0
- ARV discount +7.5/15.0
- Appreciation +7.1/10.0
- Schools +4.2/10.0
- Livability +3.5/5.0
- Rent growth +2.5/5.0
- Condition / age +2.5/5.0
$69,900
🖨 Deal sheet 📄 Offer letter ✓ Due diligence
Listing remarks
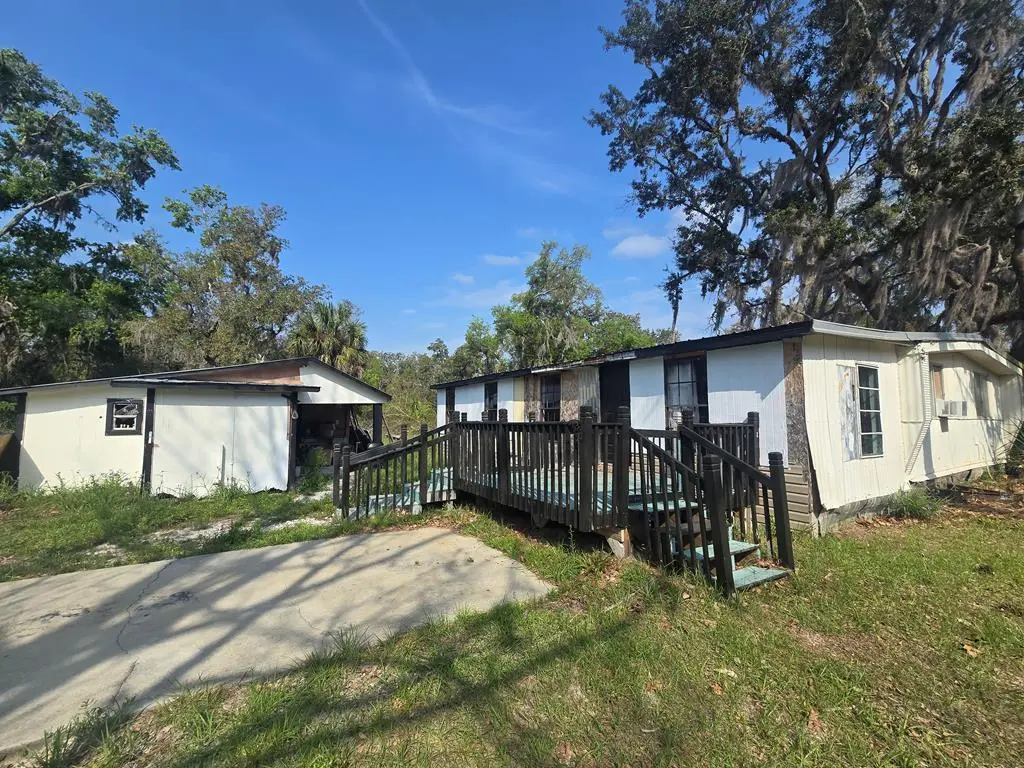
Owner Financing with 25k down at 10%. Length of loan is negotiable. Needs a complete remodel. This 3 bedroom and 2 bathroom manufactured home with 1360 Sq ft gives enough space for a 4th bedroom if needed. This home needs work inside and out but if your willing to put in the work and need owner financing it would be the perfect solution for a fresh start. There is also an outside building for storage that sits on a paved driveway and concrete slab. The home has city water and sewer.
Key facts
- Complete remodel
- Paved driveway
- Concrete slab
Tags
Property features AI
Finance
- Other: Directions available from US 19 south of Cross City
Exterior
- Parking: Concrete off-street parking
- Utilities: Public sewer
- Home design: Residential mobile home; Located in the Central Court subdivision
- Construction: Metal roof; Workshop on the property
- Exterior features: Level lot
Interior
- Bedrooms: No specific bedroom level information provided
- Bathrooms: 2 full bathrooms
- Interior features: Crawl space basement; 6 total rooms
Neighborhood map
What this means for you Summary
Snapshot
- This is a 3-bed/1.0-bath manufactured listed at $70k.
Deal economics
- At list price, monthly cash flow is $60 ($715/yr) — positive.
- The deal already cash-flows at list — no discount required.
- Meets the 1% rule at list price ($1k rent vs $70k).
- Recommended offer: $66k (6.0% below list) — sets the bar for market timing.
- Cap rate 14.6% vs local median 4.0% in Cross City — top-decile yield for the area; either an underpriced asset or a hidden risk that comps aren't pricing in. Stress-test before assuming the spread holds.
Location & tenants
- Location reads 70/100 on livability (#412 in FL) — a middle-class / working-renter tenant base. Strengths: cost of living A+, housing A+, health & safety A+; Watch: amenities F, commute F, employment F.
- Dixie (rural): math 52% / reading 50% proficiency, ranked #36 of 73 in FL (top 49%) — acceptable for families but not a draw, mixed tenant base, ~2y average lease; 85% free/reduced lunch — lower-income household profile, screen leases tightly.
- Market conditions: 47 active listings in the ZIP; 49 units permitted in Dixie County in 2024 (0 in 5+ unit buildings).
Forward outlook
- In year one you build about $3k of equity ($483 loan paydown + $3k appreciation (4.2% local appreciation)).
- Dixie County population projected at -16% by 2050 — secular population decline; favor cash flow + early exit over multi-decade hold.
- At projected returns (4.2% appreciation + 3.0% rent growth), your $20k cash investment doubles in ~5 years — after that, you're playing with house money.
- By year 10, paydown + projected appreciation supports a ~$33k cash-out refi (75% LTV) — recoverable capital for the next deal without selling this one.
Negotiation context
- It's been on market 80 days — a 6% lower offer ($66k) is reasonable based on typical stale-listing flexibility.
- Current owner paid $29k; list at $70k implies a 143% gain — meaningful room to come down on a strong offer.
Risks & watch-outs
- Watch-outs: flood insurance adds $427/mo.
- Climate carrying-cost: in FEMA flood zone AE (mandatory federal flood insurance); severe wind risk, 99% chance of damaging wind over 30y; moderate wildfire risk; extreme-heat days projected 6→19/yr by 2055 (HVAC capex compounding) — expect insurance premiums to compound above CPI over the hold.
Questions for the listing agent
- It's been on market 80 days. Have you received any prior offers? Is the seller open to a 6% concession, seller financing, or rate buy-down credit?
- What's the actual annual flood-insurance premium (NFIP or private), and is the property in a SFHA with mandatory coverage?
- Why hasn't it sold? Are there any deal-killer items the seller is aware of (foundation, flood, title, zoning, code violations)?
- Is there a deadline driving the sale (1031 exchange, divorce, estate, relocation)? That informs how much negotiation room exists.
- What's the average days-on-market for RENTAL listings here right now (not sales)? A rising rental-DOM trend means longer vacancies and softer asking-rent achievability than the comps imply.
- What's the recent tenant-quality profile in this submarket — average credit score on applications, eviction rate, late-payment / NSF rate, and stable-employment percentage? A property-management company in the area should have these aggregated.
- How much new for-sale + rental construction is in the pipeline within 1–3 miles? Heavy new supply typically softens prices + rents 12–24 months out; constrained supply supports both.
Investment metrics
- 1% rule
- 1.67% ✓
- Cap rate
- 14.64%
- Cash-on-cash
- 29.81%
- DSCR
- 2.33
- GRM
- 5.0
CMA / ARV
- ARV (on-the-fly)
- $159,120
- Comps found
- 1
Show comp detail 1 sale within ~0.75 mi
| Address | Dist | Beds/Ba | Sqft | Sold | Price | $/sf | Match |
|---|---|---|---|---|---|---|---|
| 477 NE 214th Ave | 0.34mi | 3/2.0 | 1,248 (-8%) | 3mo | $146,500 | $117 | 64 |
Match score weights: distance 35% · size 25% · config 20% · recency 20%. Top-matched comps best support the ARV.
Projected returns pro-forma
4.18% appreciation · 3.0% rent growth · sell at horizon
- IRR
- 14.2%
- Equity multiple
- 1.87×
- Total profit
- $16,935
- Equity at exit
- $36,181
- IRR
- 15.4%
- Equity multiple
- 3.56×
- Total profit
- $50,084
- Equity at exit
- $59,775
Cash invested: $19,572 (down + closing). Projections, not guarantees.
Landlord ↔ Tenant lean methodology
- Overall (STATE)
- 87 Strongly Landlord-Friendly
- State Florida
- 87 Strongly Landlord-Friendly · R+3
- County
- — inherits STATE
- City
- — inherits STATE
ZIP-level market 32628
- Home prices YoY
- 1.1%
- Active inventory
- 47
- Price-to-rent
- 5.0×
Monthly cashflow live
- Estimated rent
- $1,171 medium interval (Pro) →
- Mortgage (P&I)
- −$367
- Tax from tax record
- −$43 /mo · $516/yr
- Insurance
- −$29
- Flood insurance flood zone
- −$427 /mo · $5,118/yr
- HOA
- −$0
- Vacancy / Maint / Mgmt
- −$246
- Net cashflow
- $60
Break-even live
UW: 25.0% down · 7.5% · 30yr · 1.5% tax · 5.0% vac · 8.0% maint · 8.0% mgmt
Financing live
Cash to close
- Down payment
- $17,475
- Closing costs
- $2,097
- Reserves months
- —
- Total cash needed
- —
Loan-product check · same deal, 3 products live
Conventional
25% down · 7.5% · 30yr
- Down + closing
- —
- Monthly P&I
- —
- Monthly cashflow
- —
- DSCR
- —
- Eligible?
- —
Personal DTI + credit; lowest rate.
DSCR
20% down · 8.5% · 30yr
- Down + closing
- —
- Monthly P&I
- —
- Monthly cashflow
- —
- DSCR
- —
- Eligible?
- —
No personal income docs; deal must DSCR.
Hard money
10% down · 12.0% · 12mo
- Down + closing
- —
- Monthly P&I
- —
- Monthly cashflow
- —
- DSCR
- —
- Eligible?
- —
Short-term bridge; refi at stabilization.
Listing history 19 events
-
2026-06-18price $69,900 Active 80 DOM
-
2026-06-18days on market $85,000 Active 80 DOM
-
2026-06-17days on market $85,000 Active 79 DOM
-
2026-06-16days on market $85,000 Active 78 DOM
-
2026-06-15days on market $85,000 Active 77 DOM
-
2026-06-13days on market $85,000 Active 75 DOM
-
2026-06-12days on market $85,000 Active 74 DOM
-
2026-06-09days on market $85,000 Active 71 DOM
-
2026-06-08days on market $85,000 Active 70 DOM
-
2026-06-07days on market $85,000 Active 69 DOM
-
2026-06-07days on market $85,000 Active 68 DOM
-
2026-06-04days on market $85,000 Active 65 DOM
-
2026-06-02days on market $85,000 Active 64 DOM
-
2026-06-01days on market $85,000 Active 63 DOM
-
2026-05-31days on market $85,000 Active 62 DOM
-
2026-05-31days on market $85,000 Active 61 DOM
-
2026-03-30$85,000 Active
-
2010-07-12soldstatus $28,775
-
2002-02-20soldstatus $16,900
ⓘ Source: listings_history table (triggers on properties + properties_extension) + one-shot
backfill from property_details.listing_events for pre-trigger history.
Tax reassessment forecast FL · Resets to sale price
- Current annual tax
- $516 · $43/mo
- Projected year-2 tax
- $580 · $48/mo
- Expected delta
- +$65/yr (+$5/mo · 12.5%)
ⓘ Screening estimate from a state-policy table — verify with the county assessor before closing.
Climate risk First Street
- Flood 6/10 Major FEMA zone AE · 69% chance over 30 yrs
- Wildfire 5/10 Major
- Heat 8/10 Severe 6 d/yr ≥105°F today · 19 d/yr by 30 yrs out
- Wind 9/10 Extreme 99% chance of damaging wind over 30 yrs
- Air quality 2/10 Low 1 unhealthy d/yr today · 2 by 30 yrs out
Nearby sold comps map
Loading sold comps map…
Walkable amenities ~0.75 mi
Loading nearby amenities…
Taxation est. · year 1
- Rental income
- $14,048
- − Mortgage interest
- −$3,915
- − Property taxes
- −$516
- − Insurance
- −$5,468
- − Repairs & maintenance
- −$1,124
- − Management
- −$1,124
- − Depreciation
- −$2,033
- Taxable loss
- −$133
- Est. tax savings @ 24.0%
- +$32
- After-tax cash flow
- $747/yr
For passive investors: Depreciation is non-cash, so a rental often shows a tax loss while cash-flowing — sheltering income. Rental losses are passive: they offset passive income freely, and up to $25,000/yr can offset ordinary (W-2) income if you actively participate and your MAGI is under $100k (phasing out to $0 by $150k); unused losses carry forward. On sale, claimed depreciation is recaptured at up to 25%, and gains may owe capital-gains tax (a 1031 exchange can defer both). Figures are a year-1 estimate at your 24.0% rate — not tax advice; consult a CPA.
Schools (NCES district)
- District
- Dixie
- NCES district ID
- 1200450
- Math proficiency
- 52% ▼ -3.00%
- Reading proficiency
- 50% ▼ -4.00%
- Median HH income
- $34,799
- Composite
- 42.18/100
- National rank
- #3290
- State rank
- #36 of 73 in FL
Livability — Cross City
- Score
- 70/100
- State rank
- #412
- US rank
- #7340
Category grades
Schools grade is shown separately in the Schools card above.
Census & demographics
- Population (ZIP)
- 5,423
Population outlook (Dixie County) Hauer SSP2
- Today (2025)
- 15,122 people
- By 2030
- 14,521 · -4.0%
- By 2040
- 13,503 · -10.7%
- By 2050
- 12,671 · -16.2%
- By 2075
- 10,857 · -28.2%
- By 2100
- 8,344 · -44.8%
Race, ethnicity, and origin ACS 2023
- Neighborhood character
- Diverse neighborhood (Simpson 0.59)
- Race & ethnicity
- White 61% Black 18% Two or more races 15% Hispanic / Latino 7% Asian 1%
- Hispanic origin (detail)
- Cuban 2%
- Common ancestry
- Italian 1% Hispanic 1% Romanian 1%
- Foreign-born
- 3% · Canada
- Languages at home
- 93% English-only · Spanish 5% Arabic 1% Other Asian/Pacific 1%
Political lean MEDSL · Dixie
- 2024 margin
- Solid R (+70.4) · D 14.5% · R 84.9%
- 2008→2024 swing
- -25.4pp toward R · 2008: -45.0pp · 2024: -70.4pp
- All cycles
- 2024: R+70.4 2020: R+66.0 2016: R+63.2 2012: R+46.9 2008: R+45.0
Not yet ingested
- Civics
- —
Market trends
- HPI YoY
- ▲ 4.18%
- Current HPI
- 398.3675
- Rent YoY
- —
- Metro
- —
- State GDP YoY
- ▲ 3.28%
- F500 in state
- 36
Industry mix (Fortune 500 HQ in FL)
| Industry | F500 HQs | Revenue |
|---|---|---|
| Industrial Technology | 2 | $29B |
|
||
| Insurance | 2 | $17B |
|
||
| Retail | 1 | $60B |
|
||
| Technology Distribution | 1 | $58B |
|
||
| Homebuilding | 1 | $35B |
|
||
| Technology Manufacturing | 1 | $35B |
|
||
Price history
+403.0% since first listed3 events — show timeline
- 2026-03-30 Listed $85,000 DGLMLS
- 2010-07-12 Sold (Public Records) $28,775 Public Records
- 2002-02-20 Sold (Public Records) $16,900 Public Records
Property tax history
+3.0%/yrLatest (2025): $516 · +4.4% YoY. Source: county tax records.
Cash-flow waterfall
monthlySold comps — $/sqft
last 12 mo · ≤1 miLoading sold comps…