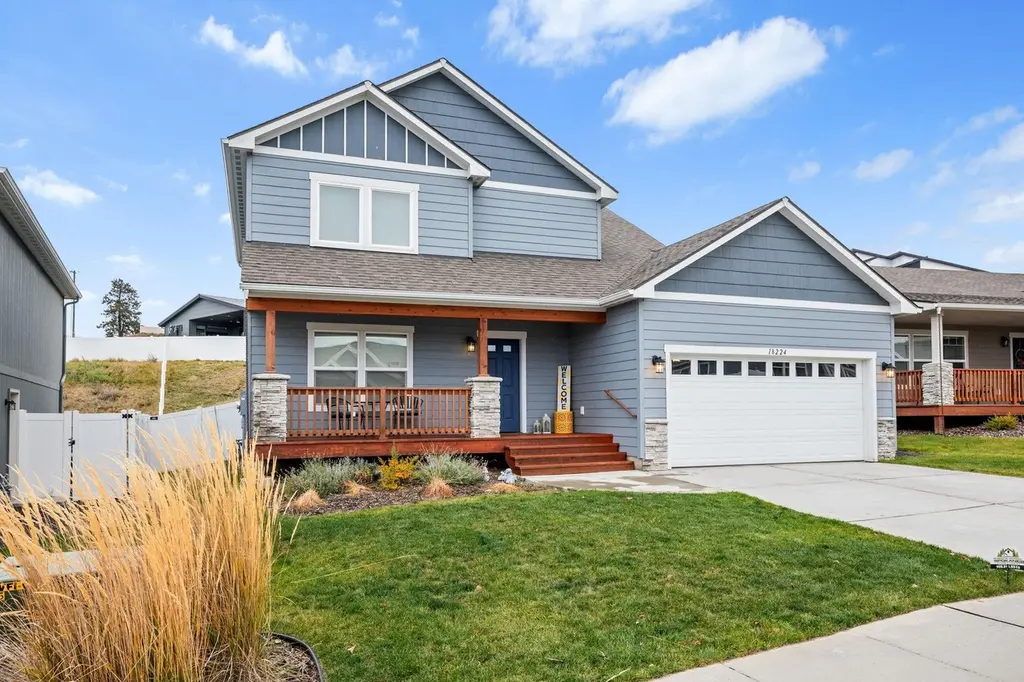
18224 E Selkirk Estates Rd · Spokane Valley, WA
Flood risk 1/10 · Minimal
- FEMA flood zone
- X (unshaded)
- Chance of flooding over 30 yrs
- 0.0%
- Est. flood insurance / yr
- $507 – $1,088
Fire risk 7/10 · Major
- Est. fire insurance / yr
- $604 – $1,122
Heat risk 3/10 · Minor
- Hot days now (above 92°F)
- 7 days/yr
- Hot days in 30 yrs
- 15 days/yr
Wind risk 1/10 · Minimal
- Chance of severe wind over 30 yrs
- —
Air-quality risk 8/10 · Major
- Unhealthy air days now
- 12 days/yr
- Unhealthy air days in 30 yrs
- 15 days/yr
Risk factors via First Street. Map © Google.
Why this score? — see what drove the D- grade
The composite is a weighted blend of 9 inputs, each scored 0–100. Each bar is that input's sub-score; the figure is the points it added to the 100-point composite (weight × sub-score).
- ARV discount +15.0/15.0
- Cash flow +7.1/30.0
- Schools +5.4/10.0
- Livability +4.2/5.0
- Rent growth +3.0/5.0
- Condition / age +2.5/5.0
- 1% rule +1.4/10.0
- DSCR +1.3/10.0
- Appreciation +0.0/10.0
$425,000
🖨 Deal sheet (PDF) 📄 Offer letter ✓ Due diligence
Listing remarks
Welcome to this impeccably maintained two story home in the highly sought after Selkirk Estates of Greenacres. Built in 2019, it offers a welcoming covered front porch, an oversized garage with extra storage, and a bright, open layout filled with natural light. The elevated backyard is a natural hillside that provides exceptional privacy and separation from having neighbors directly behind you. It also creates a great space for pets, making it an ideal setup for a dog. The hillside remains a blank canvas ready for your vision, whether you imagine terracing, gardening, or a simple low maintenance design. The main suite features a full ensuite bath and a generous walk in closet. Located in th
Key facts
- Covered front porch
- Elevated backyard
- Natural hillside
Tags
Property features AI
Exterior
- Parking: Attached garage with garage door opener; Off-site parking available; 2 garage spaces
- Home design: Single family residence; Two-story structure; Residential property
- Construction: Wood siding; Composition roof; Low wall foundation; Built as two-story
- Exterior features: Fenced yard; City street frontage
Interior
- Kitchen: Free-standing range; Dishwasher; Refrigerator
- Bedrooms: 3 bedrooms
- Heating & cooling: Forced air heating; Central air conditioning
- Interior features: Utility room; No basement
- Laundry & utility: Washer; Dryer
Neighborhood map
What this means for you Summary
Snapshot
- This is a 3-bed/2.5-bath single-family listed at $425k.
Deal economics
- At list price, monthly cash flow is $-603 ($-7k/yr) — negative.
- To cash-flow at today's rent, offer at most $318k (25.1% below list).
- To meet the 1% rule (rent ≥ 1% of price), the offer needs to be $272k (36.0% below list).
- Recommended offer: $272k (36.0% below list) — sets the bar for 1% rule.
- Cap rate 4.6% vs local median 3.0% in Spokane Valley — top-decile yield for the area; either an underpriced asset or a hidden risk that comps aren't pricing in. Stress-test before assuming the spread holds.
Location & tenants
- Location reads 85/100 on livability (#31 in WA, #512 nationally) — a professional / high-income tenant draw. Strengths: amenities A+, commute A+, housing A+; Watch: crime D+.
- Central Valley School District (urban): math 55% / reading 66% proficiency, ranked #55 of 291 in WA (top 19%) — acceptable for families but not a draw, mixed tenant base, ~2y average lease.
- Zoned schools: Greenacres Elementary (606 students, 51% FRL); Greenacres Middle School (512 students, 40% FRL); Ridgeline High School (1,368 students, 32% FRL).
- Market conditions: Rents rising (+2.1%/yr); 228 active listings in the ZIP; 7 comparable units currently listed for rent nearby; rentals at typical pace (median 23d on market — plan ~3-4 weeks tenant-placement turnaround); 43% of comp listings sitting > 30 days — soft ceiling on asking rent; solid renter incomes; 3,608 units permitted in Spokane County in 2024 (1,792 in 5+ unit buildings).
- This rent runs 32% of the median local income ($103k/yr) — at the standard rent-burdened threshold; future hikes will face affordability resistance.
Forward outlook
- Local home prices are declining (-3.0%/yr); year-one equity from $3k of loan paydown is wiped out by about $13k of value loss. Plan a longer hold.
- Spokane County population projected at +13% by 2050 — modest demand growth; plan on rents tracking national, not racing it.
Negotiation context
- Only 4 days on market — expect competitive offers; lowballing is unlikely to land.
- 13 sale attempts since 7y ago with the ask held roughly flat each time — persistent listings suggest the price (not the market) is what's stuck; bring a comps-based counter.
Risks & watch-outs
- Climate carrying-cost: major wildfire risk — expect insurance premiums to compound above CPI over the hold.
Questions for the listing agent
- What do current leases actually rent for vs. the listed asking? Can we see a recent rent roll and the last 12 months of T-12 income?
- Is there a deadline driving the sale (1031 exchange, divorce, estate, relocation)? That informs how much negotiation room exists.
- Schools are B-rated — typically a magnet for longer-tenancy family renters. What's the average tenant stay here, and is there a school-zone premium baked into asking?
- Crime grade is D in this area — have there been break-ins, vandalism, or insurance claims at this property in the last 3 years? What carrier currently insures it and at what premium?
- The area grade is low — what's the realistic commute time and amenity access for the typical tenant pool here? Any planned neighborhood developments (good or bad) we should know about?
- What's the average days-on-market for RENTAL listings here right now (not sales)? A rising rental-DOM trend means longer vacancies and softer asking-rent achievability than the comps imply.
- What's the recent tenant-quality profile in this submarket — average credit score on applications, eviction rate, late-payment / NSF rate, and stable-employment percentage? A property-management company in the area should have these aggregated.
- How much new for-sale + rental construction is in the pipeline within 1–3 miles? Heavy new supply typically softens prices + rents 12–24 months out; constrained supply supports both.
Investment metrics
- 1% rule
- 0.64% ✗
- Cap rate
- 4.59%
- Cash-on-cash
- -6.08%
- DSCR
- 0.73
- GRM
- 13.0
CMA / ARV
- ARV (median comp)
- $525,364
- List price
- $425,000
- Delta
- -19.10%
- Verdict
- UNDERPRICED
- Comps
- 20 within 1.0 mi
Show comp detail 12 sales within ~0.75 mi
| Address | Dist | Beds/Ba | Sqft | Sold | Price | $/sf | Match |
|---|---|---|---|---|---|---|---|
| 18224 E Selkirk Estates Rd | 0.00mi | 3/3.0 | 1,692 (0%) | 1mo | $430,000 | $254 | 98 |
| 18105 E Selkirk Estates Rd | 0.16mi | 3/2.0 | 1,620 (-4%) | 6mo | $504,000 | $311 | 79 |
| 18160 E Barclay Ct | 0.15mi | 3/2.0 | 1,574 (-7%) | 1mo | $514,990 | $327 | 79 |
| 18134 E Barclay Ct | 0.18mi | 3/2.0 | 1,574 (-7%) | 3mo | $509,990 | $324 | 76 |
| 18110 E Barclay Ct | 0.21mi | 3/2.0 | 1,574 (-7%) | 3mo | $499,990 | $318 | 74 |
| 1725 S Donwood St | 0.25mi | 3/2.0 | 1,570 (-7%) | 2mo | $549,000 | $350 | 73 |
| 1812 S Eden St | 0.28mi | 3/2.0 | 1,794 (+6%) | 9mo | $515,000 | $287 | 68 |
| 18314 E 19th St | 0.29mi | 3/2.0 | 1,574 (-7%) | 9mo | $514,995 | $327 | 65 |
| 18118 E Barclay Ct Unit 2/4 Orchard | 0.59mi | 3/2.0 | 1,800 (+6%) | 4mo | $534,990 | $297 | 56 |
| 18149 E Barclay Ct Unit 5/3 Orchard | 0.56mi | 3/2.0 | 1,800 (+6%) | 12mo | $609,029 | $338 | 52 |
| 18067 E Wind Rose Ct | 0.69mi | 3/2.0 | 1,870 (+10%) | 8mo | $786,077 | $420 | 42 |
| 321 S Greenacres Rd | 0.72mi | 4/2.0 (+1) | 1,878 (+11%) | 6mo | $430,000 | $229 | 36 |
Match score weights: distance 35% · size 25% · config 20% · recency 20%. Top-matched comps best support the ARV.
Projected returns pro-forma
-3.0% appreciation · 2.15% rent growth · sell at horizon
- IRR
- -27.7%
- Equity multiple
- 0.08×
- Total profit
- $-109,650
- Equity at exit
- $63,369
- IRR
- -29.3%
- Equity multiple
- -0.30×
- Total profit
- $-154,530
- Equity at exit
- $36,746
Cash invested: $119,000 (down + closing). Projections, not guarantees.
Landlord ↔ Tenant lean methodology
- Overall (STATE)
- 28 Tenant-Leaning
- State Washington
- 28 Tenant-Leaning · D+8
- County
- — inherits STATE
- City
- — inherits STATE
ZIP-level market 99016
- Home prices YoY
- -28.8%
- Rents YoY
- 2.1%
- Active inventory
- 228
- Price-to-rent
- 13.0×
Monthly cashflow live
- Estimated rent
- $2,720 high interval (Pro) →
- Mortgage (P&I)
- −$2,229
- Tax from tax record
- −$346 /mo · $4,147/yr
- Insurance
- −$177
- HOA
- −$0
- Vacancy / Maint / Mgmt
- −$571
- Net cashflow
- $-603
Break-even live
Sensitivity live
| Price | -10% $-362 | -5% $-483 | +0% $-603 | +5% $-723 | +10% $-844 |
|---|---|---|---|---|---|
| Rent | -10% $-818 | -5% $-710 | +0% $-603 | +5% $-496 | +10% $-388 |
| Rate | -1.0pp $-389 | -0.5pp $-495 | base $-603 | +0.5pp $-713 | +1.0pp $-825 |
UW: 25.0% down · 7.5% · 30yr · 1.5% tax · 5.0% vac · 8.0% maint · 8.0% mgmt
Financing live
Cash to close
- Down payment
- $106,250
- Closing costs
- $12,750
- Reserves months
- —
- Total cash needed
- —
Loan-product check · same deal, 3 products live
Conventional
25% down · 7.5% · 30yr
- Down + closing
- —
- Monthly P&I
- —
- Monthly cashflow
- —
- DSCR
- —
- Eligible?
- —
Personal DTI + credit; lowest rate.
DSCR
20% down · 8.5% · 30yr
- Down + closing
- —
- Monthly P&I
- —
- Monthly cashflow
- —
- DSCR
- —
- Eligible?
- —
No personal income docs; deal must DSCR.
Hard money
10% down · 12.0% · 12mo
- Down + closing
- —
- Monthly P&I
- —
- Monthly cashflow
- —
- DSCR
- —
- Eligible?
- —
Short-term bridge; refi at stabilization.
Rent comps 7 comps
| Address | Beds | Baths | Sqft | Rent | $/sqft | DOM | Units | Dist |
|---|---|---|---|---|---|---|---|---|
| 18277 E 17th Ave Spokane Valley, WA | 3.0 | 2.5 | 1800 | $3,500 | $1.94 | 45d | 1 | 0.12mi |
| 610 S Crescent Ln Greenacres, WA | 3.0 | 2.0 | 1300 | $1,995 | $1.53 | 23d | 1 | 0.60mi |
| 19321 E 8th Ave Spokane Valley, WA | 3.0 | 2.5 | 1416 | $2,495 | $1.76 | 45d | 1 | 0.79mi |
| 112 S Drummond Ln Greenacres, WA | 3.0 | 2.0 | 1500 | $2,200 | $1.47 | 45d | 1 | 0.92mi |
| 116 N Barker Rd Greenacres, WA | 2.0–3.0 | 1.0–2.0 | 1020 | $1,695 | $1.66 | 15d | 4 | 1.09mi |
| 18417 E Appleway Ave Spokane Valley, WA | 1.0–3.0 | 1.0–2.0 | 1025 | $1,895 | $1.85 | 15d | 8 | 1.22mi |
| 215 S Conklin Rd Spokane Valley, WA | 1.0–2.0 | 1.0–2.0 | 1065 | $2,020 | $1.90 | 15d | 11 | 1.40mi |
Listing history 31 events
-
2026-05-05status Pending 910-char remark
-
2026-05-01$425,000 Active 910-char remark
-
2026-05-01historical
-
2026-04-16price $425,000
-
2026-04-11price $435,000
-
2026-04-09$440,000 Active
-
2026-04-09historical
-
2026-03-19$440,000 Active
-
2026-03-19historical
-
2026-02-27$440,000 Active
-
2026-02-26historical
-
2026-02-25price $440,000
-
2026-01-29$450,000 Active
-
2026-01-28historical
-
2026-01-15$450,000 Active
-
2026-01-14historical
-
2026-01-02$450,000 Active
-
2026-01-01historical
-
2025-12-18$450,000 Active
-
2025-12-17historical
-
2025-12-04$450,000 Active
-
2025-12-03historical
-
2025-11-21$450,000 Active
-
2025-11-19historical
-
2025-11-18price $450,000
-
2025-11-07$460,000 Active
-
2019-08-21soldstatus $70,000
-
2019-06-10soldstatus $266,900 Sold
-
2019-03-12status Pending
-
2019-01-28Pending on Inspection
-
2019-01-28$266,900
ⓘ Source: listings_history table (triggers on properties + properties_extension) + one-shot
backfill from property_details.listing_events for pre-trigger history.
Tax reassessment forecast WA · Resets to sale price
- Current annual tax
- $4,147 · $346/mo
- Projected year-2 tax
- $4,165 · $347/mo
- Expected delta
- +$18/yr (+$2/mo · 0.4%)
ⓘ Screening estimate from a state-policy table — verify with the county assessor before closing.
Climate risk First Street
- Flood 1/10 Low FEMA zone X (unshaded) · 0% chance over 30 yrs
- Wildfire 7/10 Severe
- Heat 3/10 Moderate 7 d/yr ≥92°F today · 15 d/yr by 30 yrs out
- Wind 1/10 Low
- Air quality 8/10 Severe 12 unhealthy d/yr today · 15 by 30 yrs out
Nearby sold comps map
Loading sold comps map…
Walkable amenities ~0.75 mi
Loading nearby amenities…
Taxation est. · year 1
- Rental income
- $32,634
- − Mortgage interest
- −$23,807
- − Property taxes
- −$4,147
- − Insurance
- −$2,125
- − Repairs & maintenance
- −$2,611
- − Management
- −$2,611
- − Depreciation
- −$12,364
- Taxable loss
- −$15,029
- Est. tax savings @ 24.0%
- +$3,607
- After-tax cash flow
- $-3,628/yr
For passive investors: Depreciation is non-cash, so a rental often shows a tax loss while cash-flowing — sheltering income. Rental losses are passive: they offset passive income freely, and up to $25,000/yr can offset ordinary (W-2) income if you actively participate and your MAGI is under $100k (phasing out to $0 by $150k); unused losses carry forward. On sale, claimed depreciation is recaptured at up to 25%, and gains may owe capital-gains tax (a 1031 exchange can defer both). Figures are a year-1 estimate at your 24.0% rate — not tax advice; consult a CPA.
Schools (NCES district)
- District
- Central Valley School District
- NCES district ID
- 5301110
- Math proficiency
- 55% ▬ 0.00%
- Reading proficiency
- 66% ▬ 0.00%
- Median HH income
- $55,824
- Composite
- 53.62/100
- National rank
- #3107
- State rank
- #55 of 291 in WA
Livability — Spokane Valley
- Score
- 85/100
- State rank
- #31
- US rank
- #512
Category grades
Schools grade is shown separately in the Schools card above.
Census & demographics
- County
- Spokane County · 496,401 people
- City population
- 129,511
- Metro
- Spokane-Spokane Valley, WA
- Population (ZIP)
- 21,615
- Household income
- $103,472
- Rent vs Own
- Severe rent burden
- 483.0
Population outlook (Spokane County) Hauer SSP2
- Today (2025)
- 531,314 people
- By 2030
- 549,278 · +3.4%
- By 2040
- 577,822 · +8.8%
- By 2050
- 598,188 · +12.6%
- By 2075
- 630,744 · +18.7%
- By 2100
- 622,360 · +17.1%
Race, ethnicity, and origin ACS 2023
- Neighborhood character
- Predominantly White (84%)
- Race & ethnicity
- White 84% Hispanic / Latino 8% Two or more races 8% Asian 4%
- Hispanic origin (detail)
- Mexican 6%
- Common ancestry
- Portuguese 4% Romanian 3% Slovak 3%
- Foreign-born
- 6% · Vietnam, Canada
- Languages at home
- 92% English-only · Russian/Polish/Slavic 2% Vietnamese 2% Spanish 2%
Political lean MEDSL · Spokane
- 2024 margin
- Toss-up / Even · D 46.0% · R 51.0% · Other 3.0%
- 2008→2024 swing
- -3.8pp toward R · 2008: -1.1pp · 2024: -5.0pp
- All cycles
- 2024: R+5.0 2020: R+4.3 2016: R+8.3 2012: R+6.3 2008: R+1.1
Not yet ingested
- Civics
- —
Market trends
- HPI YoY
- ▼ -132.35%
- Current HPI
- 327.0732
- Rent YoY
- ▲ 2.15%
- Metro
- Spokane-Spokane Valley, WA
- State GDP YoY
- ▲ 4.65%
- F500 in state
- 22
Industry mix (Fortune 500 HQ in WA)
| Industry | F500 HQs | Revenue |
|---|---|---|
| Retail | 2 | $269B |
|
||
| Technology / Retail | 1 | $638B |
|
||
| Technology | 1 | $245B |
|
||
| Telecommunications | 1 | $38B |
|
||
| Food / Beverage | 1 | $36B |
|
||
| Automotive / Trucks | 1 | $34B |
|
||
Price history
+61.1% since first listed33 events — show timeline
- 2026-06-05 Sold (MLS) $430,000 SPOKANEMLS as Distributed by MLS Grid
- 2026-05-05 Pending — SPOKANEMLS as Distributed by MLS Grid
- 2026-05-05 Price Changed $430,000 SPOKANEMLS as Distributed by MLS Grid
- 2026-05-01 Listing Removed — SPOKANEMLS as Distributed by MLS Grid
- 2026-05-01 Listed $425,000 SPOKANEMLS as Distributed by MLS Grid
- 2026-04-16 Price Changed $425,000 SPOKANEMLS as Distributed by MLS Grid
- 2026-04-11 Price Changed $435,000 SPOKANEMLS as Distributed by MLS Grid
- 2026-04-09 Listing Removed — SPOKANEMLS as Distributed by MLS Grid
- 2026-04-09 Listed $440,000 SPOKANEMLS as Distributed by MLS Grid
- 2026-03-19 Listing Removed — SPOKANEMLS as Distributed by MLS Grid
- 2026-03-19 Listed $440,000 SPOKANEMLS as Distributed by MLS Grid
- 2026-02-27 Listed $440,000 SPOKANEMLS as Distributed by MLS Grid
- 2026-02-26 Listing Removed — SPOKANEMLS as Distributed by MLS Grid
- 2026-02-25 Price Changed $440,000 SPOKANEMLS as Distributed by MLS Grid
- 2026-01-29 Listed $450,000 SPOKANEMLS as Distributed by MLS Grid
- 2026-01-28 Listing Removed — SPOKANEMLS as Distributed by MLS Grid
- 2026-01-15 Listed $450,000 SPOKANEMLS as Distributed by MLS Grid
- 2026-01-14 Listing Removed — SPOKANEMLS as Distributed by MLS Grid
- 2026-01-02 Listed $450,000 SPOKANEMLS as Distributed by MLS Grid
- 2026-01-01 Listing Removed — SPOKANEMLS as Distributed by MLS Grid
- 2025-12-18 Listed $450,000 SPOKANEMLS as Distributed by MLS Grid
- 2025-12-17 Listing Removed — SPOKANEMLS as Distributed by MLS Grid
- 2025-12-04 Listed $450,000 SPOKANEMLS as Distributed by MLS Grid
- 2025-12-03 Listing Removed — SPOKANEMLS as Distributed by MLS Grid
- 2025-11-21 Listed $450,000 SPOKANEMLS as Distributed by MLS Grid
- 2025-11-19 Listing Removed — SPOKANEMLS as Distributed by MLS Grid
- 2025-11-18 Price Changed $450,000 SPOKANEMLS as Distributed by MLS Grid
- 2025-11-07 Listed $460,000 SPOKANEMLS as Distributed by MLS Grid
- 2019-08-21 Sold (Public Records) $70,000 Public Records
- 2019-06-10 Sold (MLS) $266,900 SPOKANEMLS as Distributed by MLS Grid
- 2019-03-12 Pending — SPOKANEMLS as Distributed by MLS Grid
- 2019-01-28 Listed — SPOKANEMLS as Distributed by MLS Grid
- 2019-01-28 Listed $266,900 SPOKANEMLS as Distributed by MLS Grid
Property tax history
+30.2%/yrLatest (2026): $4,147 · +10.8% YoY. Source: county tax records.
Cash-flow waterfall
monthlySold comps — $/sqft
last 12 mo · ≤1 miLoading sold comps…