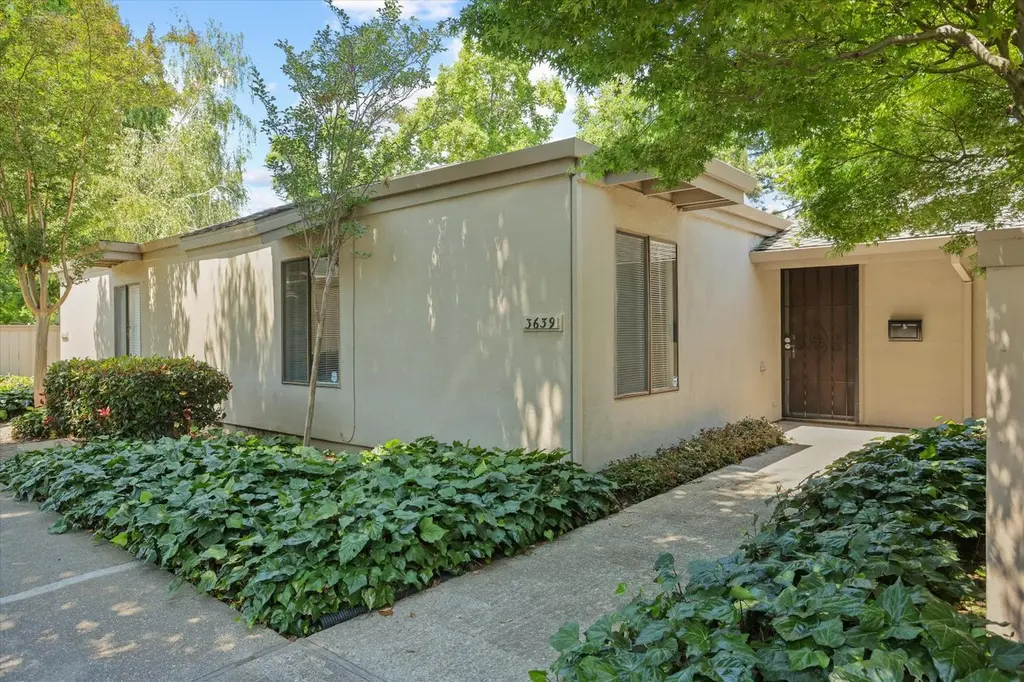
3639 Appleton Way · Stockton, CA
Flood risk 1/10 · Minimal
- FEMA flood zone
- X
- Chance of flooding over 30 yrs
- 0.0%
- Est. flood insurance / yr
- $507 – $1,088
Fire risk 1/10 · Minimal
- Est. fire insurance / yr
- $659 – $1,223
Heat risk 7/10 · Major
- Hot days now (above 103°F)
- 7 days/yr
- Hot days in 30 yrs
- 15 days/yr
Wind risk 1/10 · Minimal
- Chance of severe wind over 30 yrs
- —
Air-quality risk 10/10 · Severe
- Unhealthy air days now
- 22 days/yr
- Unhealthy air days in 30 yrs
- 24 days/yr
Risk factors via First Street. Map © Google.
Why this score? — see what drove the D grade
The composite is a weighted blend of 9 inputs, each scored 0–100. Each bar is that input's sub-score; the figure is the points it added to the 100-point composite (weight × sub-score).
- ARV discount +14.0/15.0
- Appreciation +10.0/10.0
- Cash flow +5.4/30.0
- Rent growth +3.5/5.0
- Schools +3.0/10.0
- Livability +2.9/5.0
- Condition / age +2.5/5.0
- 1% rule +1.9/10.0
- DSCR +0.0/10.0
$284,900
🖨 Deal sheet (PDF) 📄 Offer letter ✓ Due diligence
Listing remarks
SELLER OFFERING A $10,000 CREDIT FOR AN INTEREST RATE BUYDOWN! Easily eligible for FHA/VA this PUD sits in the heart of Lincoln Village West, a quiet and well kept community with quick access to I5 and the highly rated Lincoln School District. You're close to shopping, restaurants, and just a short trip to the marina great for anyone who enjoys evening walks and sunsets by the water. This home has been nicely updated throughout with new countertops, new flooring, fresh baseboards, and a brand new shower. Major improvements are already taken care of: the flat roof was recently replaced (approx. $12k), plus a new water heater, new oven, new sinks, and more. The backyard has a new fence, givin
Key facts
- New shower
- New flooring
- New water heater
Tags
Property features AI
Finance
- HOA & community: Mandatory homeowners association; Monthly HOA fee ($310) covering grounds maintenance and pool access; Community pool amenity
Exterior
- Parking: No garage; assigned parking
- Utilities: Public water; Sewer: Other
- Home design: Attached single-family residence in a planned unit development; One-story home; Built in 1972
- Construction: Composition and flat roof
- Exterior features: Low-maintenance lot; Private gunite pool
Interior
- Kitchen: Granite countertops
- Bedrooms: 2 bedrooms (main level)
- Bathrooms: 1 full bathroom with tub/shower over
- Heating & cooling: Central heating; Central air conditioning
- Interior features: Cathedral/vaulted living area; Dining and living areas combined with a formal dining area; Laundry closet located inside
- Laundry & utility: Laundry closet with 220V in laundry
Neighborhood map
What this means for you Summary
Snapshot
- This is a 2-bed/1.0-bath condo listed at $285k.
Deal economics
- At list price, monthly cash flow is $-615 ($-7k/yr) — negative.
- To cash-flow at today's rent, offer at most $176k (38.1% below list).
- To meet the 1% rule (rent ≥ 1% of price), the offer needs to be $196k (31.1% below list).
- Recommended offer: $176k (38.1% below list) — sets the bar for cash-flow.
Location & tenants
- Location reads 57/100 on livability (#734 in CA) — a working-class tenant base; expect higher turnover. Strengths: housing A+, health & safety A, amenities A-; Watch: employment C-, crime F, commute F.
- Lincoln Unified (urban): math 26% / reading 41% proficiency, ranked #284 of 517 in CA (top 55%) — families likely to look elsewhere, expect single-tenant / working-renter base with shorter leases.
- Zoned schools: Mable Barron (math 23% / reading 31%, grade F, #917 of 1,571 statewide, top 60%, 672 students, 57% FRL); Sierra Middle (math 25% / reading 48%, grade F, #175 of 498 statewide, top 36%, 572 students, 73% FRL); Lincoln High (math 35% / reading 64%, grade D, #352 of 1,170 statewide, top 31%, 2,936 students, 53% FRL).
- Market conditions: Rents rising fast (+4.2%/yr); 217 active listings in the ZIP; 31 comparable units currently listed for rent nearby; rentals leasing fast (median 5d on market — plan ~1-2 weeks tenant-placement turnaround); high-income renter base; 3,779 units permitted in San Joaquin County in 2024 (0 in 5+ unit buildings).
Forward outlook
- In year one you build about $30k of equity ($2k loan paydown + $28k appreciation (10.0% local appreciation)).
- San Joaquin County population projected at +17% by 2050 — long-run rental-demand tailwind backs the buy-and-hold thesis.
- By year 2, paydown + projected appreciation supports a ~$49k cash-out refi (75% LTV) — recoverable capital for the next deal without selling this one.
Negotiation context
- It's been on market 37 days — a 3% lower offer ($276k) is reasonable based on typical stale-listing flexibility.
- Current owner paid $160k; list at $285k implies a 78% gain — meaningful room to come down on a strong offer.
Risks & watch-outs
- Climate carrying-cost: extreme-heat days projected 7→15/yr by 2055 (HVAC capex compounding) — expect insurance premiums to compound above CPI over the hold.
Questions for the listing agent
- What do current leases actually rent for vs. the listed asking? Can we see a recent rent roll and the last 12 months of T-12 income?
- It's been on market 37 days. Have you received any prior offers? Is the seller open to a 38% concession, seller financing, or rate buy-down credit?
- Built in 1972 — when were the roof, HVAC, electrical panel, plumbing, and water heater last replaced?
- What does the HOA fee cover, when was the last increase, and are there any pending special assessments or reserve-fund shortfalls?
- Any open or pending special assessments — roof, HVAC, plumbing, elevator, façade? What's the per-unit balance and payoff schedule, and is the seller paying it off at close or rolling it to the buyer?
- Is there a deadline driving the sale (1031 exchange, divorce, estate, relocation)? That informs how much negotiation room exists.
- Schools are D-rated, which usually means shorter tenancies and higher turnover. Who's the typical renter profile here, and what's been the actual vacancy rate?
- Crime grade is F in this area — have there been break-ins, vandalism, or insurance claims at this property in the last 3 years? What carrier currently insures it and at what premium?
- The area grade is low — what's the realistic commute time and amenity access for the typical tenant pool here? Any planned neighborhood developments (good or bad) we should know about?
- What's the average days-on-market for RENTAL listings here right now (not sales)? A rising rental-DOM trend means longer vacancies and softer asking-rent achievability than the comps imply.
- What's the recent tenant-quality profile in this submarket — average credit score on applications, eviction rate, late-payment / NSF rate, and stable-employment percentage? A property-management company in the area should have these aggregated.
- How much new apartment / multifamily construction is in the pipeline within 1–3 miles? Heavy new supply (>2% of stock underway) typically softens rents 12–24 months out; light construction supports rent growth.
Investment metrics
- 1% rule
- 0.69% ✗
- Cap rate
- 3.70%
- Cash-on-cash
- -9.25%
- DSCR
- 0.59
- GRM
- 12.1
CMA / ARV
- ARV (median comp)
- $332,722
- List price
- $284,900
- Delta
- -14.37%
- Verdict
- UNDERPRICED
- Comps
- 20 within 1.0 mi
Projected returns pro-forma
10.0% appreciation · 4.16% rent growth · sell at horizon
- IRR
- 18.1%
- Equity multiple
- 2.48×
- Total profit
- $118,460
- Equity at exit
- $256,660
- IRR
- 17.2%
- Equity multiple
- 5.82×
- Total profit
- $384,875
- Equity at exit
- $553,498
Cash invested: $79,772 (down + closing). Projections, not guarantees.
Landlord ↔ Tenant lean methodology
- Overall (STATE)
- 18 Strongly Tenant-Friendly
- State California
- 18 Strongly Tenant-Friendly · D+13
- County
- — inherits STATE
- City
- — inherits STATE
ZIP-level market 95219
- Home prices YoY
- 6.6%
- Rents YoY
- 4.2%
- Active inventory
- 217
- Price-to-rent
- 12.1×
Monthly cashflow live
- Estimated rent
- $1,962 high interval (Pro) →
- Mortgage (P&I)
- −$1,494
- Tax from tax record
- −$242 /mo · $2,907/yr
- Insurance
- −$119
- HOA
- −$310
- Vacancy / Maint / Mgmt
- −$412
- Net cashflow
- $-615
Break-even live
Sensitivity live
| Price | -10% $-454 | -5% $-534 | +0% $-615 | +5% $-696 | +10% $-776 |
|---|---|---|---|---|---|
| Rent | -10% $-770 | -5% $-693 | +0% $-615 | +5% $-538 | +10% $-460 |
| Rate | -1.0pp $-472 | -0.5pp $-543 | base $-615 | +0.5pp $-689 | +1.0pp $-764 |
UW: 25.0% down · 7.5% · 30yr · 1.5% tax · 5.0% vac · 8.0% maint · 8.0% mgmt
Financing live
Cash to close
- Down payment
- $71,225
- Closing costs
- $8,547
- Reserves months
- —
- Total cash needed
- —
Loan-product check · same deal, 3 products live
Conventional
25% down · 7.5% · 30yr
- Down + closing
- —
- Monthly P&I
- —
- Monthly cashflow
- —
- DSCR
- —
- Eligible?
- —
Personal DTI + credit; lowest rate.
DSCR
20% down · 8.5% · 30yr
- Down + closing
- —
- Monthly P&I
- —
- Monthly cashflow
- —
- DSCR
- —
- Eligible?
- —
No personal income docs; deal must DSCR.
Hard money
10% down · 12.0% · 12mo
- Down + closing
- —
- Monthly P&I
- —
- Monthly cashflow
- —
- DSCR
- —
- Eligible?
- —
Short-term bridge; refi at stabilization.
Rent comps 31 comps
| Address | Beds | Baths | Sqft | Rent | $/sqft | DOM | Units | Dist |
|---|---|---|---|---|---|---|---|---|
| 3525 W Benjamin Holt Dr Stockton, CA | 1.0–2.0 | 1.0–1.5 | 710 | $2,015 | $2.84 | 4d | 11 | 0.12mi |
| 3722 W Benjamin Holt Dr #13 Stockton, CA | 2.0 | 2.0 | 978 | $2,000 | $2.04 | 45d | 1 | 0.26mi |
| 3286 Blue Ridge Cir Stockton, CA | 2.0 | 1.0 | 975 | $1,950 | $2.00 | 25d | 1 | 0.35mi |
| 3286 Blue Ridge Cir Stockton, CA | 1.0 | 1.0 | 725 | $1,495 | $2.06 | 5d | 1 | 0.35mi |
| 3286 Blue Ridge Cir Stockton, CA | 1.0–2.0 | 1.0 | 850 | $1,950 | $2.29 | 12d | 2 | 0.35mi |
| 3790 W Benjamin Holt Dr #13 Stockton, CA | 2.0 | 2.0 | 979 | $1,850 | $1.89 | 25d | 1 | 0.36mi |
| 3335 Riverton Way Stockton, CA | 2.0 | 1.0 | 1064 | $2,402 | $2.26 | 21d | 1 | 0.40mi |
| 6851 Plymouth Rd Unit 3 Stockton, CA | 3.0 | 2.0 | 1100 | $2,350 | $2.14 | 45d | 1 | 0.53mi |
| 6851 Plymouth Rd Unit 1 Stockton, CA | 1.0 | 1.0 | 680 | $1,450 | $2.13 | 45d | 1 | 0.53mi |
| 6851 Plymouth Rd Unit 2 Stockton, CA | 2.0 | 1.0 | 860 | $1,750 | $2.03 | 45d | 1 | 0.53mi |
| 6353 Morgan Pl Stockton, CA | 2.0 | 1.0 | 875 | $1,975 | $2.26 | 45d | 1 | 0.54mi |
| 6408 Morgan Pl Stockton, CA | 1.0–2.0 | 1.0 | 615 | $1,960 | $3.19 | 4d | 4 | 0.56mi |
| 6724 Plymouth Rd #37 Stockton, CA | 2.0 | 1.0 | 760 | $1,850 | $2.43 | 25d | 1 | 0.59mi |
| 2903 Whittier Ct Stockton, CA | 3.0 | 2.0 | 1102 | $1,995 | $1.81 | 25d | 1 | 0.60mi |
| 6724 Plymouth Rd Stockton, CA | 1.0–2.0 | 1.0 | 660 | $1,850 | $2.80 | 5d | 2 | 0.60mi |
| 6724 Plymouth Rd Stockton, CA | 1.0 | 1.0 | 560 | $1,400 | $2.50 | 45d | 1 | 0.60mi |
| 3038 W Swain Rd Stockton, CA | 2.0 | 1.0 | 920 | $2,100 | $2.28 | 5d | 1 | 0.62mi |
| 2973 W Swain Rd Stockton, CA | 1.0–2.0 | 1.0 | 685 | $1,925 | $2.81 | 4d | 6 | 0.62mi |
| 7355 Kelley Dr Stockton, CA | 2.0 | 1.0 | 890 | $1,800 | $2.02 | 5d | 1 | 0.77mi |
| 5858 Morgan Pl Stockton, CA | 2.0 | 1.0–2.0 | 884 | $1,872 | $2.12 | 4d | 7 | 0.78mi |
| 7356 Kelley Dr Stockton, CA | 2.0 | 2.0 | 1110 | $1,600 | $1.44 | 25d | 1 | 0.80mi |
| 7565 Shoreline Dr Stockton, CA | 1.0–2.0 | 1.0–2.0 | 847 | $2,255 | $2.66 | 3d | 4 | 0.87mi |
| 5834 Brush Creek Dr Stockton, CA | 3.0 | 2.0 | 1100 | $2,295 | $2.09 | 4d | 1 | 0.99mi |
| 7901 Montgomery Ave Unit 009 Stockton, CA | 2.0 | 1.5 | 1050 | $2,100 | $2.00 | 4d | 1 | 1.15mi |
| 7901 Montgomery Ave Unit 010 Stockton, CA | 2.0 | 1.5 | 1050 | $2,075 | $1.98 | 4d | 1 | 1.15mi |
| 7921 Montgomery Ave Stockton, CA | 3.0 | 2.0 | 1125 | $1,695 | $1.51 | 45d | 1 | 1.18mi |
| 7912 Richland Way Stockton, CA | 2.0–3.0 | 1.0–2.0 | 997 | $2,079 | $2.08 | 0d | 7 | 1.23mi |
| 8035 Mariners Dr Stockton, CA | 1.0–2.0 | 1.0–2.0 | 942 | $2,179 | $2.31 | 0d | 19 | 1.25mi |
| 5301 Feather River Dr Stockton, CA | 1.0–2.0 | 1.0–2.0 | 852 | $2,575 | $3.02 | 4d | 6 | 1.29mi |
| 8473 Kelley Dr Unit D Stockton, CA | 2.0 | 1.5 | 980 | $1,650 | $1.68 | 13d | 1 | 1.39mi |
| 3591 Quail Lakes Dr Stockton, CA | 2.0 | 2.0 | 930 | $1,595 | $1.72 | 5d | 1 | 1.40mi |
HOA detail condo
- Monthly dues
- $310 · $3,720/yr
- Likely covers
- water
- Assessments
- None detected in remarks — confirm with the listing agent.
Listing history 16 events
-
2026-06-22price $284,900 Active 37 DOM
-
2026-06-21days on market $285,000 Active 37 DOM
-
2026-06-18days on market $285,000 Active 34 DOM
-
2026-06-17days on market $285,000 Active 33 DOM
-
2026-06-16days on market $285,000 Active 32 DOM
-
2026-06-15days on market $285,000 Active 31 DOM
-
2026-06-14days on market $285,000 Active 29 DOM
-
2026-06-13statusdays on market $285,000 Active 28 DOM
-
2026-06-07statusdays on market $285,000 Pending 26 DOM
-
2026-06-03days on market $285,000 Active 25 DOM
-
2026-06-03pricedays on market $285,000 Active 24 DOM
-
2026-06-01days on market $297,000 Active 23 DOM
-
2026-05-31days on market $297,000 Active 22 DOM
-
2004-07-30soldstatus $160,000
-
2001-10-22soldstatus $114,000
-
1997-07-25soldstatus $55,000
ⓘ Source: listings_history table (triggers on properties + properties_extension) + one-shot
backfill from property_details.listing_events for pre-trigger history.
Tax reassessment forecast CA · Resets to sale price
- Current annual tax
- $2,907 · $242/mo
- Projected year-2 tax
- $2,907 · $242/mo
- Expected delta
- $0/yr ($0/mo · -0.0%)
ⓘ Screening estimate from a state-policy table — verify with the county assessor before closing.
Climate risk First Street
- Flood 1/10 Low FEMA zone X · 0% chance over 30 yrs
- Wildfire 1/10 Low
- Heat 7/10 Severe 7 d/yr ≥103°F today · 15 d/yr by 30 yrs out
- Wind 1/10 Low
- Air quality 10/10 Extreme 22 unhealthy d/yr today · 24 by 30 yrs out
Nearby sold comps map
Loading sold comps map…
Walkable amenities ~0.75 mi
Loading nearby amenities…
Taxation est. · year 1
- Rental income
- $23,544
- − Mortgage interest
- −$15,959
- − Property taxes
- −$2,907
- − Insurance
- −$1,424
- − Repairs & maintenance
- −$1,884
- − Management
- −$1,884
- − HOA
- −$3,720
- − Depreciation
- −$8,288
- Taxable loss
- −$12,521
- Est. tax savings @ 24.0%
- +$3,005
- After-tax cash flow
- $-4,375/yr
For passive investors: Depreciation is non-cash, so a rental often shows a tax loss while cash-flowing — sheltering income. Rental losses are passive: they offset passive income freely, and up to $25,000/yr can offset ordinary (W-2) income if you actively participate and your MAGI is under $100k (phasing out to $0 by $150k); unused losses carry forward. On sale, claimed depreciation is recaptured at up to 25%, and gains may owe capital-gains tax (a 1031 exchange can defer both). Figures are a year-1 estimate at your 24.0% rate — not tax advice; consult a CPA.
Schools (NCES district)
- District
- Lincoln Unified
- NCES district ID
- 0621690
- Math proficiency
- 26% ▼ -11.00%
- Reading proficiency
- 41% ▼ -11.00%
- Median HH income
- $56,356
- Composite
- 29.66/100
- National rank
- #6465
- State rank
- #284 of 517 in CA
Livability — Stockton
- Score
- 57/100
- State rank
- #734
- US rank
- #21638
Category grades
Schools grade is shown separately in the Schools card above.
Census & demographics
- Census place
- Stockton, CA
- County
- San Joaquin County · 729,570 people
- City population
- 332,006
- Metro
- Stockton, CA
- Population (ZIP)
- 31,713
- Household income
- $112,268
- Rent vs Own
- Severe rent burden
- 825.0
Population outlook (San Joaquin County) Hauer SSP2
- Today (2025)
- 796,965 people
- By 2030
- 828,849 · +4.0%
- By 2040
- 885,611 · +11.1%
- By 2050
- 929,798 · +16.7%
- By 2075
- 994,578 · +24.8%
- By 2100
- 971,291 · +21.9%
Race, ethnicity, and origin ACS 2023
- Neighborhood character
- Highly diverse neighborhood (Simpson 0.75)
- Race & ethnicity
- White 33% Hispanic / Latino 30% Asian 21% Two or more races 18% Black 9%
- Hispanic origin (detail)
- Mexican 27%
- Common ancestry
- Slovak 2% Italian 2% Portuguese 1%
- Foreign-born
- 20% · Canada, China, Vietnam
- Languages at home
- 69% English-only · Spanish 14% Other Indo-European 4% Other Asian/Pacific 4%
Political lean MEDSL · San Joaquin
- 2024 margin
- Toss-up / Even · D 48.0% · R 48.9% · Other 3.0%
- 2008→2024 swing
- -11.6pp toward R · 2008: 10.7pp · 2024: -0.9pp
- All cycles
- 2024: R+0.9 2020: D+13.9 2016: D+12.9 2012: D+8.9 2008: D+10.7
Not yet ingested
- Civics
- —
Market trends
- HPI YoY
- ▲ 69.26%
- Current HPI
- 1122.61
- Rent YoY
- ▲ 4.16%
- Metro
- Stockton, CA
- State GDP YoY
- ▲ 3.21%
- F500 in state
- 116
Industry mix (Fortune 500 HQ in CA)
| Industry | F500 HQs | Revenue |
|---|---|---|
| Technology | 27 | $1,492B |
|
||
| Financial Services | 3 | $174B |
|
||
| Retail | 3 | $44B |
|
||
| Insurance | 3 | $26B |
|
||
| Media / Entertainment | 2 | $115B |
|
||
| Pharmaceuticals / Biotech | 2 | $62B |
|
||
Price history
+190.9% since first listed3 events — show timeline
- 2004-07-30 Sold (Public Records) $160,000 Public Records
- 2001-10-22 Sold (Public Records) $114,000 Public Records
- 1997-07-25 Sold (Public Records) $55,000 Public Records
Property tax history
+2.8%/yrLatest (2025): $2,907 · +2.9% YoY. Source: county tax records.
Cash-flow waterfall
monthlySold comps — $/sqft
last 12 mo · ≤1 miLoading sold comps…