466 Lady Liberty Way · Red Bank, SC
Flood risk No data
- FEMA flood zone
- —
- Chance of flooding over 30 yrs
- —
- Est. flood insurance / yr
- —
Fire risk No data
- Est. fire insurance / yr
- —
Heat risk No data
- Hot days now (above threshold)
- —
- Hot days in 30 yrs
- —
Wind risk No data
- Chance of severe wind over 30 yrs
- —
Air-quality risk No data
- Unhealthy air days now
- —
- Unhealthy air days in 30 yrs
- —
Risk factors via First Street. Map © Google.
Why this score? — see what drove the D- grade
The composite is a weighted blend of 9 inputs, each scored 0–100. Each bar is that input's sub-score; the figure is the points it added to the 100-point composite (weight × sub-score).
- Cash flow +10.2/30.0
- ARV discount +7.5/15.0
- Condition / age +4.8/5.0
- Schools +4.2/10.0
- 1% rule +3.8/10.0
- Rent growth +3.3/5.0
- Livability +3.3/5.0
- DSCR +2.9/10.0
- Appreciation +0.0/10.0
$239,900
🖨 Deal sheet (PDF) 📄 Offer letter ✓ Due diligence
Listing remarks
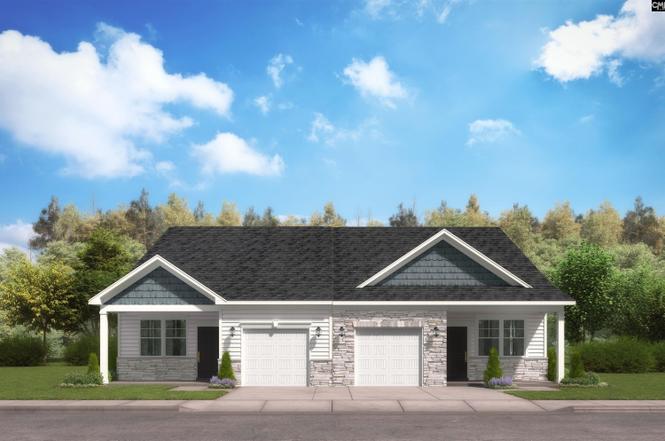
Welcome home to Copper Crest Townhomes, offering affordable, low maintenance living with easy access to Lexington's wonderful dining, shopping & entertainment options! The Leyla plan is a must see, providing multigenerational living opportunities. You will be delighted as you step into a spacious family room with that open concept living that everyone is searching for. The stunning kitchen overlooks the family room, making it easy to entertain or just prepping meals while watching your evening shows. The designer finishes will wow you from the gorgeous pendant lights, tile backsplash, walk-in pantry, and highly sought after color selections. Nestled away on the main floor is your prim
Key facts
- Open concept living
- Stunning kitchen
- Walk in pantry
Tags
Property features AI
Finance
- HOA & community: Property is part of an association
Exterior
- Parking: Attached garage with 1 garage space
- Utilities: Public sewer; Public water
- Home design: Two-story home; Slab foundation
- Construction: Partial brick and vinyl exterior; Slab foundation
- Exterior features: Partial brick above foundation and vinyl siding; Paved road access; Public water
Interior
- Kitchen: Pantry; Granite countertops; Tiled backsplash; Painted cabinets; Recessed lighting; Luxury vinyl plank flooring; Dishwasher; Disposal; Microwave (above stove); Free-standing gas range
- Bedrooms: Master bedroom on main level with double vanity, private bath, walk-in closet, tray ceilings and carpeted floors; Second bedroom on main level; Third bedroom on second level
- Flooring: Carpet in bedrooms; Luxury vinyl plank in kitchen
- Bathrooms: Three full bathrooms total; Two full bathrooms on the main level
- Heating & cooling: Central cooling; Gas heating (first and second levels)
- Interior features: Recessed lighting; Tray ceilings in master bedroom; Closets (including walk-in and private closets)
Neighborhood map
What this means for you Summary
Snapshot
- This is a 3-bed/3.0-bath townhouse listed at $240k. Condition is rated excellent.
Deal economics
- At list price, monthly cash flow is $-134 ($-2k/yr) — negative.
- To cash-flow at today's rent, offer at most $220k (8.1% below list).
- To meet the 1% rule (rent ≥ 1% of price), the offer needs to be $210k (12.4% below list).
- Recommended offer: $210k (12.4% below list) — sets the bar for 1% rule.
Location & tenants
- Location reads 66/100 on livability (#121 in SC) — a middle-class / working-renter tenant base. Strengths: cost of living A+, housing A+, health & safety B; Watch: employment C-, crime D+, amenities F.
- Lexington 01 (suburban): math 42% / reading 53% proficiency, ranked #11 of 80 in SC (top 14%) — families likely to look elsewhere, expect single-tenant / working-renter base with shorter leases.
- Zoned schools: Red Bank Elementary (math 36% / reading 45%, grade F, #286 of 597 statewide, top 49%, 568 students, 41% FRL); Carolina Springs Middle (math 25% / reading 39%, grade F, #119 of 229 statewide, top 54%, 914 students, 46% FRL); White Knoll High (math 47% / reading 85%, grade B, #81 of 196 statewide, top 42%, 2,204 students, 45% FRL).
- Market conditions: Rents rising (+3.2%/yr); 572 active listings in the ZIP; 11 comparable units currently listed for rent nearby; rentals at typical pace (median 16d on market — plan ~3-4 weeks tenant-placement turnaround); solid renter incomes; 1,712 units permitted in Lexington County in 2024 (0 in 5+ unit buildings).
- This rent runs 33% of the median local income ($77k/yr) — at the standard rent-burdened threshold; future hikes will face affordability resistance.
Forward outlook
- Local home prices are declining (-3.0%/yr); year-one equity from $2k of loan paydown is wiped out by about $7k of value loss. Plan a longer hold.
- Lexington County population projected at +26% by 2050 — long-run rental-demand tailwind backs the buy-and-hold thesis.
Negotiation context
- It's been on market 60 days — a 3% lower offer ($233k) is reasonable based on typical stale-listing flexibility.
Questions for the listing agent
- What do current leases actually rent for vs. the listed asking? Can we see a recent rent roll and the last 12 months of T-12 income?
- It's been on market 60 days. Have you received any prior offers? Is the seller open to a 12% concession, seller financing, or rate buy-down credit?
- What does the HOA fee cover, when was the last increase, and are there any pending special assessments or reserve-fund shortfalls?
- Is there a deadline driving the sale (1031 exchange, divorce, estate, relocation)? That informs how much negotiation room exists.
- Schools are F-rated, which usually means shorter tenancies and higher turnover. Who's the typical renter profile here, and what's been the actual vacancy rate?
- Crime grade is D in this area — have there been break-ins, vandalism, or insurance claims at this property in the last 3 years? What carrier currently insures it and at what premium?
- The area grade is low — what's the realistic commute time and amenity access for the typical tenant pool here? Any planned neighborhood developments (good or bad) we should know about?
- What's the average days-on-market for RENTAL listings here right now (not sales)? A rising rental-DOM trend means longer vacancies and softer asking-rent achievability than the comps imply.
- What's the recent tenant-quality profile in this submarket — average credit score on applications, eviction rate, late-payment / NSF rate, and stable-employment percentage? A property-management company in the area should have these aggregated.
- How much new for-sale + rental construction is in the pipeline within 1–3 miles? Heavy new supply typically softens prices + rents 12–24 months out; constrained supply supports both.
Investment metrics
- 1% rule
- 0.88% ✗
- Cap rate
- 5.62%
- Cash-on-cash
- -2.40%
- DSCR
- 0.89
- GRM
- 9.5
CMA / ARV
No comps found within radius.
Projected returns pro-forma
-3.0% appreciation · 3.24% rent growth · sell at horizon
- IRR
- -19.9%
- Equity multiple
- 0.30×
- Total profit
- $-46,812
- Equity at exit
- $35,770
- IRR
- -12.2%
- Equity multiple
- 0.27×
- Total profit
- $-49,223
- Equity at exit
- $20,742
Cash invested: $67,172 (down + closing). Projections, not guarantees.
Landlord ↔ Tenant lean methodology
- Overall (STATE)
- 90 Strongly Landlord-Friendly
- State South Carolina
- 90 Strongly Landlord-Friendly · R+6
- County
- — inherits STATE
- City
- — inherits STATE
ZIP-level market 29073
- Home prices YoY
- -19.1%
- Rents YoY
- 3.2%
- Active inventory
- 572
- Price-to-rent
- 9.5×
Monthly cashflow live
- Estimated rent
- $2,101 high interval (Pro) →
- Mortgage (P&I)
- −$1,258
- Tax est. 1.5%
- −$300 /mo · $3,598/yr
- Insurance
- −$100
- HOA
- −$136
- Vacancy / Maint / Mgmt
- −$441
- Net cashflow
- $-134
Break-even live
Sensitivity live
| Price | -10% $31 | -5% $-52 | +0% $-134 | +5% $-217 | +10% $-300 |
|---|---|---|---|---|---|
| Rent | -10% $-300 | -5% $-217 | +0% $-134 | +5% $-51 | +10% $32 |
| Rate | -1.0pp $-14 | -0.5pp $-73 | base $-134 | +0.5pp $-197 | +1.0pp $-260 |
UW: 25.0% down · 7.5% · 30yr · 1.5% tax · 5.0% vac · 8.0% maint · 8.0% mgmt
Financing live
Cash to close
- Down payment
- $59,975
- Closing costs
- $7,197
- Reserves months
- —
- Total cash needed
- —
Loan-product check · same deal, 3 products live
Conventional
25% down · 7.5% · 30yr
- Down + closing
- —
- Monthly P&I
- —
- Monthly cashflow
- —
- DSCR
- —
- Eligible?
- —
Personal DTI + credit; lowest rate.
DSCR
20% down · 8.5% · 30yr
- Down + closing
- —
- Monthly P&I
- —
- Monthly cashflow
- —
- DSCR
- —
- Eligible?
- —
No personal income docs; deal must DSCR.
Hard money
10% down · 12.0% · 12mo
- Down + closing
- —
- Monthly P&I
- —
- Monthly cashflow
- —
- DSCR
- —
- Eligible?
- —
Short-term bridge; refi at stabilization.
Rent comps 11 comps
| Address | Beds | Baths | Sqft | Rent | $/sqft | DOM | Units | Dist |
|---|---|---|---|---|---|---|---|---|
| 464 Lady Liberty Way Lexington, SC | 4.0 | 2.5 | 2100 | $2,150 | $1.02 | 25d | 1 | 0.03mi |
| 449 Lady Liberty Way Lexington, SC | 3.0 | 3.0 | 1635 | $1,995 | $1.22 | 25d | 1 | 0.04mi |
| 110 Darian Dr Lexington, SC | 3.0 | 2.0 | 1364 | $1,949 | $1.43 | 16d | 1 | 0.33mi |
| 1603 Commendable Ct Lexington, SC | 3.0 | 2.0 | 1399 | $2,033 | $1.45 | 5d | 1 | 0.54mi |
| 1607 Commendable Ct Lexington, SC | 4.0 | 2.5 | 1783 | $2,238 | $1.26 | 25d | 1 | 0.54mi |
| 120 W Lake Dr Lexington, SC | 3.0 | 2.0 | 1476 | $1,880 | $1.27 | 5d | 1 | 0.78mi |
| 140 Land of Lakes Cir Lexington, SC | 3.0 | 2.0 | 1452 | $1,925 | $1.33 | 5d | 1 | 0.82mi |
| 212 Pin Oak Dr Lexington, SC | 3.0 | 2.0 | 1349 | $1,710 | $1.27 | 16d | 1 | 0.94mi |
| 919 Dovefield Ln Lexington, SC | 4.0 | 2.5 | 2022 | $2,299 | $1.14 | 25d | 1 | 1.17mi |
| 290 Browning Ct Unit b Lexington, SC | 2.0 | 1.0 | 1100 | $1,495 | $1.36 | 23d | 1 | 1.18mi |
| 847 Dovefield Ln Lexington, SC | 3.0 | 2.0 | 1302 | $1,850 | $1.42 | 16d | 1 | 1.18mi |
HOA detail
- Monthly dues
- $136 · $1,632/yr
Listing history 3 events
-
2026-05-09status Pending
-
2026-03-26price $239,900
-
2026-03-10$243,320 Active
ⓘ Source: listings_history table (triggers on properties + properties_extension) + one-shot
backfill from property_details.listing_events for pre-trigger history.
Nearby sold comps map
Loading sold comps map…
Walkable amenities ~0.75 mi
Loading nearby amenities…
Taxation est. · year 1
- Rental income
- $25,207
- − Mortgage interest
- −$13,438
- − Property taxes
- −$3,598
- − Insurance
- −$1,200
- − Repairs & maintenance
- −$2,017
- − Management
- −$2,017
- − HOA
- −$1,632
- − Depreciation
- −$6,979
- Taxable loss
- −$5,673
- Est. tax savings @ 24.0%
- +$1,362
- After-tax cash flow
- $-252/yr
For passive investors: Depreciation is non-cash, so a rental often shows a tax loss while cash-flowing — sheltering income. Rental losses are passive: they offset passive income freely, and up to $25,000/yr can offset ordinary (W-2) income if you actively participate and your MAGI is under $100k (phasing out to $0 by $150k); unused losses carry forward. On sale, claimed depreciation is recaptured at up to 25%, and gains may owe capital-gains tax (a 1031 exchange can defer both). Figures are a year-1 estimate at your 24.0% rate — not tax advice; consult a CPA.
Condition & rehab AI · 13 photos
This townhouse is in excellent condition with modern finishes and a well-maintained exterior. It's move-in ready and would benefit from some landscaping and furniture to maximize its value.
Value-add opportunities
- Both landscaping — enhances curb appeal and adds value
- Both furniture — improves the home's livability and appeal
Renovation cost estimate screening
Value-add ROI direction
- Both landscaping — enhances curb appeal and adds value ↑
- Both furniture — improves the home's livability and appeal ↑
ⓘ Cost ranges are severity-bucket heuristics (US national rule-of-thumb). Get contractor quotes + a written scope before underwriting a rehab budget.
Schools (NCES district)
- District
- Lexington 01
- NCES district ID
- 4502700
- Math proficiency
- 42% ▼ -12.00%
- Reading proficiency
- 53% ▼ -2.00%
- Median HH income
- $61,298
- Composite
- 41.75/100
- National rank
- #3399
- State rank
- #11 of 80 in SC
Livability — Red Bank
- Score
- 66/100
- State rank
- #121
- US rank
- #11985
Category grades
Schools grade is shown separately in the Schools card above.
Census & demographics
- Census place
- Red Bank, SC
- County
- Lexington County · 232,571 people
- Metro
- Columbia, SC
- Population (ZIP)
- 53,156
- Household income
- $77,229
- Rent vs Own
- Severe rent burden
- 935.0
Population outlook (Lexington County) Hauer SSP2
- Today (2025)
- 322,999 people
- By 2030
- 342,356 · +6.0%
- By 2040
- 377,715 · +16.9%
- By 2050
- 406,984 · +26.0%
- By 2075
- 465,447 · +44.1%
- By 2100
- 485,674 · +50.4%
Race, ethnicity, and origin ACS 2023
- Neighborhood character
- Predominantly White (72%)
- Race & ethnicity
- White 72% Black 14% Two or more races 7% Hispanic / Latino 6% Asian 2%
- Hispanic origin (detail)
- Mexican 2% Puerto Rican 1%
- Common ancestry
- Romanian 3% Italian 2% Slovak 1%
- Foreign-born
- 4% · Canada, China
- Languages at home
- 93% English-only · Spanish 5% Other Indo-European 1%
Political lean MEDSL · Lexington
- 2024 margin
- Solid R (+33.5) · D 32.5% · R 66.0% · Other 1.4%
- 2008→2024 swing
- +4.6pp toward D · 2008: -38.0pp · 2024: -33.5pp
- All cycles
- 2024: R+33.5 2020: R+30.1 2016: R+36.7 2012: R+37.8 2008: R+38.0
Not yet ingested
- Civics
- —
Market trends
- HPI YoY
- ▼ -59.20%
- Current HPI
- 249.8957
- Rent YoY
- ▲ 3.24%
- Metro
- Columbia, SC
- State GDP YoY
- ▲ 4.51%
- F500 in state
- 2
Industry mix (Fortune 500 HQ in SC)
| Industry | F500 HQs | Revenue |
|---|---|---|
| Packaging | 1 | $7B |
|
||
Price history
-1.4% since first listed3 events — show timeline
- 2026-05-09 Pending — Consolidated MLS
- 2026-03-26 Price Changed $239,900 Consolidated MLS
- 2026-03-10 Listed $243,320 Consolidated MLS
Cash-flow waterfall
monthlySold comps — $/sqft
last 12 mo · ≤1 miLoading sold comps…