131 El Verano · Yuba City, CA
Flood risk 1/10 · Minimal
- FEMA flood zone
- —
- Chance of flooding over 30 yrs
- 0.0%
- Est. flood insurance / yr
- —
Fire risk 7/10 · Major
- Est. fire insurance / yr
- $659 – $1,223
Heat risk 7/10 · Major
- Hot days now (above 105°F)
- 7 days/yr
- Hot days in 30 yrs
- 16 days/yr
Wind risk 1/10 · Minimal
- Chance of severe wind over 30 yrs
- —
Air-quality risk 10/10 · Severe
- Unhealthy air days now
- 28 days/yr
- Unhealthy air days in 30 yrs
- 32 days/yr
Risk factors via First Street. Map © Google.
Why this score? — see what drove the B+ grade
The composite is a weighted blend of 9 inputs, each scored 0–100. Each bar is that input's sub-score; the figure is the points it added to the 100-point composite (weight × sub-score).
- Cash flow +30.0/30.0
- ARV discount +15.0/15.0
- 1% rule +10.0/10.0
- DSCR +10.0/10.0
- Livability +3.8/5.0
- Schools +3.2/10.0
- Rent growth +2.5/5.0
- Condition / age +2.2/5.0
- Appreciation +0.0/10.0
$80,000
🖨 Deal sheet 📄 Offer letter ✓ Due diligence
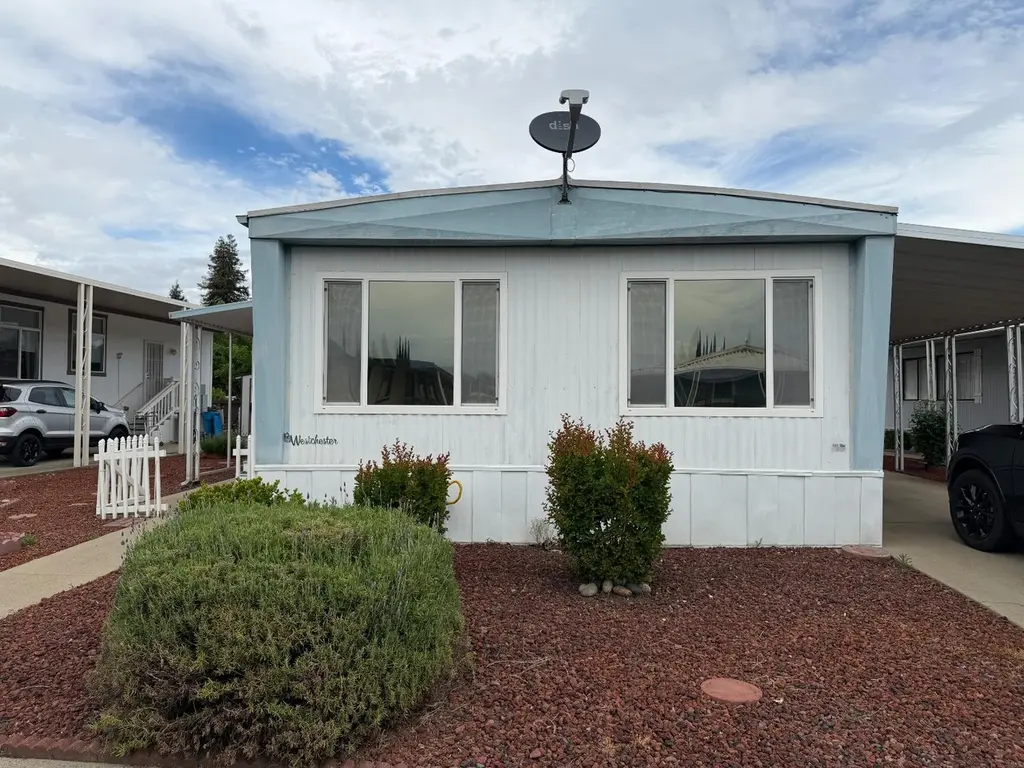
Listing remarks
Get ready to fall in love with this charming home at 131 El Verano, perfectly situated in a warm and welcoming 55+ community! This neighborhood offers the ideal blend of peace, connection, and independencemaking it a fantastic place to start your next chapter. This inviting 2-bedroom, 2-bath home features a spacious living area and a cozy dining room complete with built‑in cabinetry for added character and storage. The large kitchen provides plenty of room for all your culinary adventures, giving you the perfect foundation for easy, enjoyable living. Whether you're dreaming of modern updates or envisioning a comfortable retreat, this home is ready for you to make it your own. Step outside t
Key facts
- Attached carport
- Private yard
- Built in cabinetry
Tags
Property features AI
Finance
- Other: Located in Sutter County, CA (postal code 95993); Directions: Located between Tharp and Stabler on Butte House Rd in Del Prado Mobile Home Park
- Financial info: Land lease not indicated as 'Yes' (park land lease listed separately)
- HOA & community: Not part of an association; Located in a senior community; Community contains multiple units (approximately 186 units)
Exterior
- Parking: Off-street covered parking; Attached parking (carport/covered)
- Utilities: Public water; Public sewer; 220-volt outlet in laundry
- Home design: Manufactured home in a park; Double-wide unit; Single-story (manufactured) home; Built in 1971; Located at 131 El Verano, Yuba City, CA (faces within a mobile home community)
- Construction: Foam roof; Aluminum skirting; Manufacturer: Champion; Make: Western; Foundation typical for manufactured homes
- Exterior features: Carport awning; Porch awning; Fenced yard; Landscaped backyard; Close to clubhouse
Interior
- Kitchen: Laminate countertops; Free-standing refrigerator; Free-standing electric oven and range; Hood over range
- Bedrooms: 2 bedrooms (includes a master bedroom)
- Flooring: Carpet; Linoleum
- Bathrooms: 2 full bathrooms; Bathrooms with tub/shower over tub and separate shower stall(s)
- Heating & cooling: Central heating; Central cooling
- Interior features: Porch with steps; Covered deck with railing; Storage area; Fenced yard; Dining and living rooms combined; Living room with additional feature noted as 'Other'
- Laundry & utility: Indoor laundry area (220V in laundry)
Neighborhood map
What this means for you Summary
Snapshot
- This is a 2-bed/2.0-bath manufactured listed at $80k. Condition is rated fair.
Deal economics
- At list price, monthly cash flow is $839 ($10k/yr) — positive.
- The deal already cash-flows at list — no discount required.
- Meets the 1% rule at list price ($2k rent vs $80k).
- Recommended offer: $78k (3.0% below list) — sets the bar for market timing.
- Cap rate 18.9% vs local median 3.6% in Yuba City — top-decile yield for the area; either an underpriced asset or a hidden risk that comps aren't pricing in. Stress-test before assuming the spread holds.
Location & tenants
- Location reads 75/100 on livability (#111 in CA, #3,863 nationally) — a middle-class / working-renter tenant base. Strengths: commute A+, housing A+, health & safety A+; Watch: crime D+, schools D, cost of living F.
- Yuba City Unified (urban): math 20% / reading 53% proficiency, ranked #263 of 517 in CA (top 51%) — families likely to look elsewhere, expect single-tenant / working-renter base with shorter leases.
- Market conditions: 176 active listings in the ZIP; 22 comparable units currently listed for rent nearby; rentals at typical pace (median 21d on market — plan ~3-4 weeks tenant-placement turnaround); 41% of comp listings sitting > 30 days — soft ceiling on asking rent; solid renter incomes; 73 units permitted in Sutter County in 2024 (0 in 5+ unit buildings).
Forward outlook
- Local home prices are declining (-3.0%/yr); year-one equity from $553 of loan paydown is wiped out by about $2k of value loss. Plan a longer hold.
- Sutter County population projected to shrink 4% by 2050 — rents likely to lag national; underwrite the cash flow, not the appreciation.
- At projected returns (-3.0% appreciation + 3.0% rent growth), your $22k cash investment doubles in ~3 years — after that, you're playing with house money.
Negotiation context
- It's been on market 42 days — a 3% lower offer ($78k) is reasonable based on typical stale-listing flexibility.
Risks & watch-outs
- Climate carrying-cost: major wildfire risk; extreme-heat days projected 7→16/yr by 2055 (HVAC capex compounding) — expect insurance premiums to compound above CPI over the hold.
Questions for the listing agent
- It's been on market 42 days. Have you received any prior offers? Is the seller open to a 3% concession, seller financing, or rate buy-down credit?
- Have any recent inspections been done? Can we get a copy of the seller's disclosures and any deferred-maintenance estimates?
- Built in 1971 — when were the roof, HVAC, electrical panel, plumbing, and water heater last replaced?
- Is there a deadline driving the sale (1031 exchange, divorce, estate, relocation)? That informs how much negotiation room exists.
- Schools are D-rated, which usually means shorter tenancies and higher turnover. Who's the typical renter profile here, and what's been the actual vacancy rate?
- Crime grade is D in this area — have there been break-ins, vandalism, or insurance claims at this property in the last 3 years? What carrier currently insures it and at what premium?
- What's the average days-on-market for RENTAL listings here right now (not sales)? A rising rental-DOM trend means longer vacancies and softer asking-rent achievability than the comps imply.
- What's the recent tenant-quality profile in this submarket — average credit score on applications, eviction rate, late-payment / NSF rate, and stable-employment percentage? A property-management company in the area should have these aggregated.
- How much new for-sale + rental construction is in the pipeline within 1–3 miles? Heavy new supply typically softens prices + rents 12–24 months out; constrained supply supports both.
Investment metrics
- 1% rule
- 2.20% ✓
- Cap rate
- 18.88%
- Cash-on-cash
- 44.94%
- DSCR
- 3.00
- GRM
- 3.8
CMA / ARV
- ARV (median comp)
- $130,203
- List price
- $80,000
- Delta
- -38.56%
- Verdict
- UNDERPRICED
- Comps
- 5 within 1.0 mi
Show comp detail 2 sales within ~0.75 mi
| Address | Dist | Beds/Ba | Sqft | Sold | Price | $/sf | Match |
|---|---|---|---|---|---|---|---|
| 107 El Encino Way | 0.11mi | 2/1.5 | 1,080 (+4%) | 12mo | $79,000 | $73 | 76 |
| 103 La Entrada Way | 0.14mi | 3/2.0 (+1) | 1,152 (+11%) | 14mo | $125,000 | $109 | 59 |
Match score weights: distance 35% · size 25% · config 20% · recency 20%. Top-matched comps best support the ARV.
Projected returns pro-forma
-3.0% appreciation · 3.0% rent growth · sell at horizon
- IRR
- 42.0%
- Equity multiple
- 2.81×
- Total profit
- $40,497
- Equity at exit
- $11,928
- IRR
- 48.2%
- Equity multiple
- 5.65×
- Total profit
- $104,178
- Equity at exit
- $6,917
Cash invested: $22,400 (down + closing). Projections, not guarantees.
Landlord ↔ Tenant lean methodology
- Overall (STATE)
- 18 Strongly Tenant-Friendly
- State California
- 18 Strongly Tenant-Friendly · D+13
- County
- — inherits STATE
- City
- — inherits STATE
ZIP-level market 95993
- Active inventory
- 176
- Price-to-rent
- 3.8×
Monthly cashflow live
- Estimated rent
- $1,762 high interval (Pro) →
- Mortgage (P&I)
- −$420
- Tax est. 1.5%
- −$100 /mo · $1,200/yr
- Insurance
- −$33
- HOA
- −$0
- Vacancy / Maint / Mgmt
- −$370
- Net cashflow
- $839
Break-even live
UW: 25.0% down · 7.5% · 30yr · 1.5% tax · 5.0% vac · 8.0% maint · 8.0% mgmt
Financing live
Cash to close
- Down payment
- $20,000
- Closing costs
- $2,400
- Reserves months
- —
- Total cash needed
- —
Loan-product check · same deal, 3 products live
Conventional
25% down · 7.5% · 30yr
- Down + closing
- —
- Monthly P&I
- —
- Monthly cashflow
- —
- DSCR
- —
- Eligible?
- —
Personal DTI + credit; lowest rate.
DSCR
20% down · 8.5% · 30yr
- Down + closing
- —
- Monthly P&I
- —
- Monthly cashflow
- —
- DSCR
- —
- Eligible?
- —
No personal income docs; deal must DSCR.
Hard money
10% down · 12.0% · 12mo
- Down + closing
- —
- Monthly P&I
- —
- Monthly cashflow
- —
- DSCR
- —
- Eligible?
- —
Short-term bridge; refi at stabilization.
Rent comps 22 comps
| Address | Beds | Baths | Sqft | Rent | $/sqft | DOM | Units | Dist |
|---|---|---|---|---|---|---|---|---|
| 1575 Heather Dr Unit 1445 Yuba City, CA | 2.0 | 1.0 | 800 | $1,600 | $2.00 | 20d | 1 | 0.23mi |
| 1574 Heather Dr Unit 206 Yuba City, CA | 2.0 | 1.0 | 1005 | $1,650 | $1.64 | 20d | 1 | 0.27mi |
| 1572 Heather Dr Unit 119 Yuba City, CA | 1.0 | 1.0 | 700 | $1,400 | $2.00 | 43d | 1 | 0.28mi |
| 1572 Heather Dr Unit 109 Yuba City, CA | 1.0 | 1.0 | 700 | $1,300 | $1.86 | 43d | 1 | 0.28mi |
| 1431 Mirada Cir Yuba City, CA | 3.0 | 2.0 | 1370 | $2,400 | $1.75 | 20d | 1 | 0.33mi |
| 1341 Dustin Dr Yuba City, CA | 2.0 | 1.0 | 750 | $1,650 | $2.20 | 13d | 4 | 0.34mi |
| 1351 Dustin Dr Unit 45 Yuba City, CA | 2.0 | 1.0 | 750 | $1,400 | $1.87 | 43d | 1 | 0.38mi |
| 1250 Melton Dr Yuba City, CA | 1.0–2.0 | 1.0 | 646 | $1,300 | $2.01 | 13d | 2 | 0.79mi |
| 1211 Kenny Dr Unit 19 Yuba City, CA | 1.0 | 1.0 | 750 | $1,195 | $1.59 | 43d | 1 | 0.80mi |
| 1171 Kenny Dr Unit 10 Yuba City, CA | 2.0 | 1.0 | 900 | $1,375 | $1.53 | 43d | 1 | 0.83mi |
| 1171 Kenny Dr Yuba City, CA | 2.0 | 1.0 | 900 | $1,500 | $1.67 | 43d | 1 | 0.83mi |
| 1188 Casita Dr Yuba City, CA | 2.0 | 1.0 | 840 | $1,399 | $1.67 | 43d | 1 | 0.84mi |
| 1199 Casita Dr #1 Yuba City, CA | 2.0 | 1.0 | 896 | $1,500 | $1.67 | 20d | 1 | 0.84mi |
| 1290 Northgate Dr Unit 81 Yuba City, CA | 2.0 | 2.0 | 941 | $1,500 | $1.59 | 43d | 1 | 0.85mi |
| 1290 Northgate Dr Unit 28 Yuba City, CA | 2.0 | 1.0 | 872 | $1,450 | $1.66 | 20d | 1 | 0.87mi |
| 1570 Gray Ave Unit 16 Yuba City, CA | 1.0 | 1.0 | 700 | $1,275 | $1.82 | 20d | 1 | 0.88mi |
| 1138 Forestwood Dr Yuba City, CA | 2.0 | 2.0 | 964 | $2,025 | $2.10 | 20d | 1 | 0.92mi |
| 1518 Upland Dr Unit 1518 Yuba City, CA | 2.0 | 1.0 | 1084 | $1,900 | $1.75 | 43d | 1 | 1.17mi |
| 1722 Clark Ave Yuba City, CA | 3.0 | 2.0 | 1479 | $2,500 | $1.69 | 20d | 1 | 1.19mi |
| 1590 Alfred Way Unit 2 Yuba City, CA | 2.0 | 1.0 | 906 | $1,400 | $1.55 | 13d | 1 | 1.38mi |
| 515 Ohlson St Yuba City, CA | 3.0 | 2.0 | 1337 | $2,300 | $1.72 | 13d | 1 | 1.41mi |
| 1602 Wildflower Cir Unit 1602 Yuba City, CA | 3.0 | 2.0 | 1451 | $2,200 | $1.52 | 13d | 1 | 1.43mi |
Listing history 17 events
-
2026-06-19days on market $80,000 Active 42 DOM
-
2026-06-18days on market $80,000 Active 41 DOM
-
2026-06-17days on market $80,000 Active 40 DOM
-
2026-06-16days on market $80,000 Active 39 DOM
-
2026-06-15days on market $80,000 Active 38 DOM
-
2026-06-14days on market $80,000 Active 36 DOM
-
2026-06-13days on market $80,000 Active 35 DOM
-
2026-06-10days on market $80,000 Active 33 DOM
-
2026-06-09days on market $80,000 Active 32 DOM
-
2026-06-08days on market $80,000 Active 31 DOM
-
2026-06-07days on market $80,000 Active 30 DOM
-
2026-06-05days on market $80,000 Active 27 DOM
-
2026-06-03days on market $80,000 Active 26 DOM
-
2026-06-02days on market $80,000 Active 25 DOM
-
2026-06-01days on market $80,000 Active 24 DOM
-
2026-05-31days on market $80,000 Active 23 DOM
-
2026-05-30days on market $80,000 Active 22 DOM
ⓘ Source: listings_history table (triggers on properties + properties_extension) + one-shot
backfill from property_details.listing_events for pre-trigger history.
Climate risk First Street
- Flood 1/10 Low 0% chance over 30 yrs
- Wildfire 7/10 Severe
- Heat 7/10 Severe 7 d/yr ≥105°F today · 16 d/yr by 30 yrs out
- Wind 1/10 Low
- Air quality 10/10 Extreme 28 unhealthy d/yr today · 32 by 30 yrs out
Nearby sold comps map
Loading sold comps map…
Walkable amenities ~0.75 mi
Loading nearby amenities…
Taxation est. · year 1
- Rental income
- $21,142
- − Mortgage interest
- −$4,481
- − Property taxes
- −$1,200
- − Insurance
- −$400
- − Repairs & maintenance
- −$1,691
- − Management
- −$1,691
- − Depreciation
- −$2,327
- Taxable income
- $9,351
- Est. tax owed @ 24.0%
- −$2,244
- After-tax cash flow
- $7,823/yr
For passive investors: Depreciation is non-cash, so a rental often shows a tax loss while cash-flowing — sheltering income. Rental losses are passive: they offset passive income freely, and up to $25,000/yr can offset ordinary (W-2) income if you actively participate and your MAGI is under $100k (phasing out to $0 by $150k); unused losses carry forward. On sale, claimed depreciation is recaptured at up to 25%, and gains may owe capital-gains tax (a 1031 exchange can defer both). Figures are a year-1 estimate at your 24.0% rate — not tax advice; consult a CPA.
Condition & rehab AI · 12 photos
This charming mobile home in a 55+ community is in fair condition with some cosmetic updates needed. Painting the exterior and trimming the landscaping would significantly enhance its curb appeal and value.
Repairs flagged
- Minor Paint — Light discoloration on exterior
- Minor Landscaping — Overgrown shrubs need trimming
Value-add opportunities
- Resale Paint exterior — Enhances curb appeal
- Rental Landscaping — Improves curb appeal for tenants
Renovation cost estimate screening
| Repair item | Severity | Est. cost |
|---|---|---|
| Paint · Light discoloration on exterior | Minor | $500–3,000 |
| Landscaping · Overgrown shrubs need trimming | Minor | $500–3,000 |
| Total estimated repair cost · 2 items | $1,000–6,000 |
Value-add ROI direction
- Resale Paint exterior — Enhances curb appeal ↑
- Rental Landscaping — Improves curb appeal for tenants ↑
ⓘ Cost ranges are severity-bucket heuristics (US national rule-of-thumb). Get contractor quotes + a written scope before underwriting a rehab budget.
Schools (NCES district)
- District
- Yuba City Unified
- NCES district ID
- 0643470
- Math proficiency
- 20% ▼ -10.00%
- Reading proficiency
- 53% ▲ 5.00%
- Median HH income
- $50,923
- Composite
- 31.55/100
- National rank
- #5956
- State rank
- #263 of 517 in CA
Livability — Yuba City
- Score
- 75/100
- State rank
- #111
- US rank
- #3863
Category grades
Schools grade is shown separately in the Schools card above.
Census & demographics
- Census place
- Yuba City, CA
- County
- Sutter County · 81,625 people
- City population
- 81,625
- Metro
- Yuba City, CA
- Population (ZIP)
- 39,046
- Household income
- $93,763
- Rent vs Own
- Severe rent burden
- 738.0
Population outlook (Sutter County) Hauer SSP2
- Today (2025)
- 97,244 people
- By 2030
- 97,170 · -0.1%
- By 2040
- 96,137 · -1.1%
- By 2050
- 93,604 · -3.7%
- By 2075
- 85,008 · -12.6%
- By 2100
- 71,584 · -26.4%
Race, ethnicity, and origin ACS 2023
- Neighborhood character
- Diverse neighborhood (Simpson 0.68)
- Race & ethnicity
- White 45% Asian 25% Hispanic / Latino 23% Two or more races 12% Black 1%
- Hispanic origin (detail)
- Mexican 21%
- Common ancestry
- Slovak 2% Italian 1% Russian 1%
- Foreign-born
- 23% · Canada, Vietnam
- Languages at home
- 65% English-only · Other Indo-European 20% Spanish 12% Other Asian/Pacific 1%
Political lean MEDSL · Sutter
- 2024 margin
- Solid R (+31.4) · D 33.1% · R 64.5% · Other 2.4%
- 2008→2024 swing
- -14.7pp toward R · 2008: -16.7pp · 2024: -31.4pp
- All cycles
- 2024: R+31.4 2020: R+16.4 2016: R+16.3 2012: R+21.8 2008: R+16.7
Not yet ingested
- Civics
- —
Market trends
- HPI YoY
- ▼ -280.05%
- Current HPI
- 210.9131
- Rent YoY
- —
- Metro
- Yuba City, CA
- State GDP YoY
- ▲ 3.21%
- F500 in state
- 116
Industry mix (Fortune 500 HQ in CA)
| Industry | F500 HQs | Revenue |
|---|---|---|
| Technology | 27 | $1,492B |
|
||
| Financial Services | 3 | $174B |
|
||
| Retail | 3 | $44B |
|
||
| Insurance | 3 | $26B |
|
||
| Media / Entertainment | 2 | $115B |
|
||
| Pharmaceuticals / Biotech | 2 | $62B |
|
||
Cash-flow waterfall
monthlySold comps — $/sqft
last 12 mo · ≤1 miLoading sold comps…