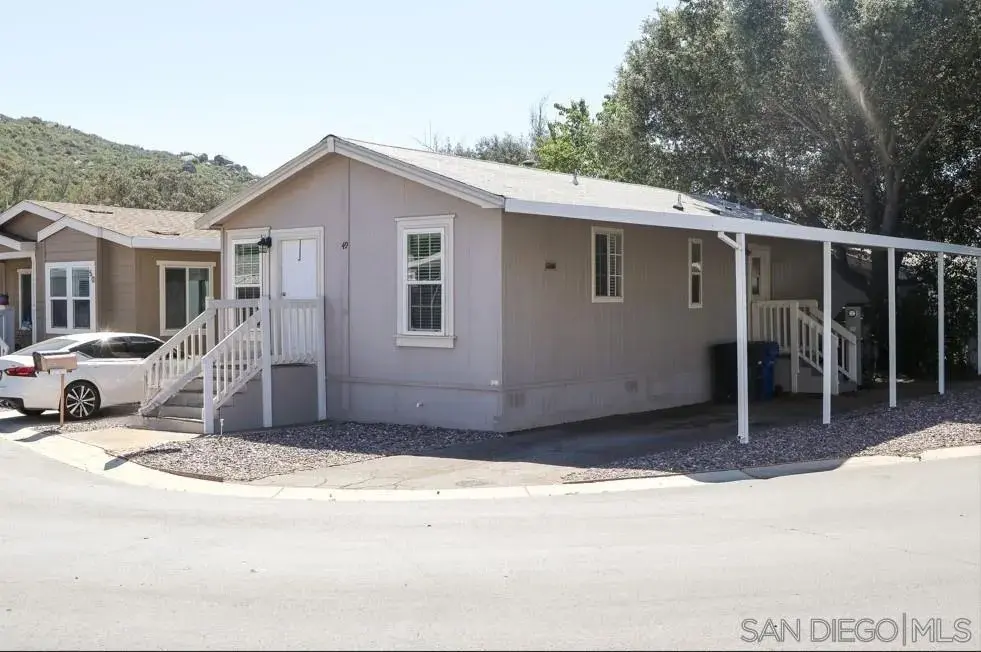
3505 Alpine Blvd #49 · Alpine, CA
Flood risk 1/10 · Minimal
- FEMA flood zone
- X (unshaded)
- Chance of flooding over 30 yrs
- 0.0%
- Est. flood insurance / yr
- $507 – $1,088
Fire risk 10/10 · Severe
- Est. fire insurance / yr
- $659 – $1,223
Heat risk 4/10 · Minor
- Hot days now (above 96°F)
- 7 days/yr
- Hot days in 30 yrs
- 21 days/yr
Wind risk 1/10 · Minimal
- Chance of severe wind over 30 yrs
- —
Air-quality risk 6/10 · Moderate
- Unhealthy air days now
- 10 days/yr
- Unhealthy air days in 30 yrs
- 12 days/yr
Risk factors via First Street. Map © Google.
Why this score? — see what drove the B- grade
The composite is a weighted blend of 9 inputs, each scored 0–100. Each bar is that input's sub-score; the figure is the points it added to the 100-point composite (weight × sub-score).
- Cash flow +30.0/30.0
- 1% rule +10.0/10.0
- DSCR +10.0/10.0
- ARV discount +7.5/15.0
- Schools +4.0/10.0
- Livability +2.9/5.0
- Rent growth +2.5/5.0
- Condition / age +2.5/5.0
- Appreciation +0.0/10.0
$120,900
🖨 Deal sheet 📄 Offer letter ✓ Due diligence
Listing remarks
MAJOR PRICE REDUCTION! Welcome to this 2BS/2BA home located on a desirable corner lot in Alpine Oaks Estates (All-Age Park)—offering opportunity to live in the San Diego area. This home is current vacant, ready to be moved in, with hard surface flooring throughout, making it both stylish and easy to maintain. The open kitchen with island flows directly into the living space, creating a functional layout for everyday living or entertaining. Great features include Full HVAC system for year-round comfort, Indoor laundry room for added convenience, Driveway parking with partial covered carport, Bright, open living space with natural light. The community offers Fenced-in pool and community
Key facts
- Full hvac system
- Indoor laundry room
- Fenced-in pool
Tags
Property features AI
Finance
- Other: Breed restrictions for pets; Zoning: R-1
- HOA & community: Homeowners association with monthly fee; Community amenities include a pool; Property is in the Alpine Oaks Estate community
Exterior
- Parking: 2 parking spaces
- Utilities: Sewer connected
- Home design: Manufactured home; Single-story
- Construction: Shingle roof
- Exterior features: Partial fencing; Community pool; Located in a park setting (common interest lot)
Interior
- Bedrooms: Space for 2 possible bedrooms
- Bathrooms: 2 full bathrooms
- Heating & cooling: Central air; Forced air heating (propane)
- Interior features: Washer and Dryer included; Central air conditioning; Forced air heating with propane
- Laundry & utility: Washer and Dryer
Neighborhood map
What this means for you Summary
Snapshot
- This is a 2-bed/2.0-bath manufactured listed at $121k.
Deal economics
- At list price, monthly cash flow is $954 ($11k/yr) — positive.
- The deal already cash-flows at list — no discount required.
- Meets the 1% rule at list price ($2k rent vs $121k).
- Recommended offer: $119k (1.5% below list) — sets the bar for market timing.
- Cap rate 15.8% vs local median 1.4% in Alpine — top-decile yield for the area; either an underpriced asset or a hidden risk that comps aren't pricing in. Stress-test before assuming the spread holds.
Location & tenants
- Location reads 58/100 on livability (#711 in CA) — a working-class tenant base; expect higher turnover. Strengths: employment A+, commute A-, crime B; Watch: amenities F, cost of living F, health & safety F.
- Grossmont Union High (suburban): math 31% / reading 60% proficiency, ranked #173 of 517 in CA (top 34%) — families likely to look elsewhere, expect single-tenant / working-renter base with shorter leases; only 17% free/reduced lunch — higher-income household profile.
- Market conditions: Rents flat; 85 active listings in the ZIP; 1 comparable units currently listed for rent nearby; high-income renter base; 11,759 units permitted in San Diego County in 2024 (7,244 in 5+ unit buildings).
Forward outlook
- Local home prices are declining (-3.0%/yr); year-one equity from $836 of loan paydown is wiped out by about $4k of value loss. Plan a longer hold.
- San Diego County population projected at +20% by 2050 — long-run rental-demand tailwind backs the buy-and-hold thesis.
- At projected returns (-3.0% appreciation + 0.1% rent growth), your $34k cash investment doubles in ~4 years — after that, you're playing with house money.
Negotiation context
- It's been on market 17 days — a 2% lower offer ($119k) is reasonable based on typical stale-listing flexibility.
- 8 sale attempts; this cycle's ask has dropped $8k (6%) from the opening price — seller is motivated, your offer sets the floor, not the list.
Risks & watch-outs
- Climate carrying-cost: severe wildfire risk — expect insurance premiums to compound above CPI over the hold.
Questions for the listing agent
- Is there a deadline driving the sale (1031 exchange, divorce, estate, relocation)? That informs how much negotiation room exists.
- What's the average days-on-market for RENTAL listings here right now (not sales)? A rising rental-DOM trend means longer vacancies and softer asking-rent achievability than the comps imply.
- What's the recent tenant-quality profile in this submarket — average credit score on applications, eviction rate, late-payment / NSF rate, and stable-employment percentage? A property-management company in the area should have these aggregated.
- How much new for-sale + rental construction is in the pipeline within 1–3 miles? Heavy new supply typically softens prices + rents 12–24 months out; constrained supply supports both.
Investment metrics
- 1% rule
- 1.87% ✓
- Cap rate
- 15.76%
- Cash-on-cash
- 33.82%
- DSCR
- 2.50
- GRM
- 4.4
CMA / ARV
No comps found within radius.
Projected returns pro-forma
-3.0% appreciation · 0.1% rent growth · sell at horizon
- IRR
- 25.8%
- Equity multiple
- 2.03×
- Total profit
- $34,788
- Equity at exit
- $18,027
- IRR
- 31.7%
- Equity multiple
- 3.48×
- Total profit
- $83,806
- Equity at exit
- $10,453
Cash invested: $33,852 (down + closing). Projections, not guarantees.
Landlord ↔ Tenant lean methodology
- Overall (STATE)
- 18 Strongly Tenant-Friendly
- State California
- 18 Strongly Tenant-Friendly · D+13
- County
- — inherits STATE
- City
- — inherits STATE
ZIP-level market 91901
- Rents YoY
- 0.1%
- Active inventory
- 85
- Price-to-rent
- 4.4×
Monthly cashflow live
- Estimated rent
- $2,265 medium interval (Pro) →
- Mortgage (P&I)
- −$634
- Tax est. 1.5%
- −$151 /mo · $1,814/yr
- Insurance
- −$50
- HOA
- −$0
- Vacancy / Maint / Mgmt
- −$476
- Net cashflow
- $954
Break-even live
UW: 25.0% down · 7.5% · 30yr · 1.5% tax · 5.0% vac · 8.0% maint · 8.0% mgmt
Financing live
Cash to close
- Down payment
- $30,225
- Closing costs
- $3,627
- Reserves months
- —
- Total cash needed
- —
Loan-product check · same deal, 3 products live
Conventional
25% down · 7.5% · 30yr
- Down + closing
- —
- Monthly P&I
- —
- Monthly cashflow
- —
- DSCR
- —
- Eligible?
- —
Personal DTI + credit; lowest rate.
DSCR
20% down · 8.5% · 30yr
- Down + closing
- —
- Monthly P&I
- —
- Monthly cashflow
- —
- DSCR
- —
- Eligible?
- —
No personal income docs; deal must DSCR.
Hard money
10% down · 12.0% · 12mo
- Down + closing
- —
- Monthly P&I
- —
- Monthly cashflow
- —
- DSCR
- —
- Eligible?
- —
Short-term bridge; refi at stabilization.
Rent comps 1 comps
| Address | Beds | Baths | Sqft | Rent | $/sqft | DOM | Units | Dist |
|---|---|---|---|---|---|---|---|---|
| 2660 Alpine Blvd Alpine, CA | 1.0–2.0 | 1.0–2.0 | 750 | $2,549 | $3.40 | 1d | 10 | 0.98mi |
Listing history 40 events
-
2026-06-18days on market $120,900 Active 17 DOM
-
2026-06-17price $120,900 Active 16 DOM
-
2026-06-17days on market $122,900 Active 16 DOM
-
2026-06-16days on market $122,900 Active 15 DOM
-
2026-06-15days on market $122,900 Active 14 DOM
-
2026-06-13days on market $122,900 Active 12 DOM
-
2026-06-09days on market $122,900 Active 8 DOM
-
2026-06-08days on market $122,900 Active 7 DOM
-
2026-06-07days on market $122,900 Active 6 DOM
-
2026-06-04days on market $122,900 Active 3 DOM
-
2026-06-03days on market $122,900 Active 2 DOM
-
2026-06-02days on market $122,900 Active 1 DOM
-
2026-05-31days on market $122,900 Active 45 DOM
-
2026-05-14price $124,900
-
2026-05-05price $127,900
-
2026-04-30status Active
-
2026-04-14status Pending
-
2026-03-31$128,900 Active
-
2026-03-31historical
-
2026-03-18price $135,000
-
2026-03-07price $141,900
-
2026-02-27price $142,900
-
2026-02-09price $143,900
-
2026-01-08price $146,900
-
2025-12-31$149,900 Active
-
2025-12-01price $149,900
-
2025-11-04price $154,900
-
2025-08-20price $157,900
-
2025-08-20status Active
-
2025-08-20price $154,900
-
2025-08-18status Pending
-
2025-08-18historical
-
2025-07-01$159,900 Active
-
2025-06-30historical
-
2025-06-30status Active
-
2025-06-29historical
-
2025-05-30price $163,900
-
2025-05-07status Active
-
2025-05-05status Pending
-
2025-04-01$164,900 Active
ⓘ Source: listings_history table (triggers on properties + properties_extension) + one-shot
backfill from property_details.listing_events for pre-trigger history.
Climate risk First Street
- Flood 1/10 Low FEMA zone X (unshaded) · 0% chance over 30 yrs
- Wildfire 10/10 Extreme
- Heat 4/10 Moderate 7 d/yr ≥96°F today · 21 d/yr by 30 yrs out
- Wind 1/10 Low
- Air quality 6/10 Major 10 unhealthy d/yr today · 12 by 30 yrs out
Nearby sold comps map
Loading sold comps map…
Walkable amenities ~0.75 mi
Loading nearby amenities…
Taxation est. · year 1
- Rental income
- $27,184
- − Mortgage interest
- −$6,772
- − Property taxes
- −$1,814
- − Insurance
- −$604
- − Repairs & maintenance
- −$2,175
- − Management
- −$2,175
- − Depreciation
- −$3,517
- Taxable income
- $10,127
- Est. tax owed @ 24.0%
- −$2,431
- After-tax cash flow
- $9,019/yr
For passive investors: Depreciation is non-cash, so a rental often shows a tax loss while cash-flowing — sheltering income. Rental losses are passive: they offset passive income freely, and up to $25,000/yr can offset ordinary (W-2) income if you actively participate and your MAGI is under $100k (phasing out to $0 by $150k); unused losses carry forward. On sale, claimed depreciation is recaptured at up to 25%, and gains may owe capital-gains tax (a 1031 exchange can defer both). Figures are a year-1 estimate at your 24.0% rate — not tax advice; consult a CPA.
Schools (NCES district)
- District
- Grossmont Union High
- NCES district ID
- 0616230
- Math proficiency
- 31% ▼ -1.00%
- Reading proficiency
- 60% ▲ 5.00%
- Median HH income
- $61,801
- Composite
- 40.07/100
- National rank
- #3810
- State rank
- #173 of 517 in CA
Livability — Alpine
- Score
- 58/100
- State rank
- #711
- US rank
- #21327
Category grades
Schools grade is shown separately in the Schools card above.
Census & demographics
- Census place
- Alpine, CA
- County
- San Diego County · 3,178,799 people
- City population
- 18,197
- Metro
- San Diego-Chula Vista-Carlsbad, CA
- Population (ZIP)
- 18,197
- Household income
- $114,167
- Rent vs Own
- Severe rent burden
- 417.0
Population outlook (San Diego County) Hauer SSP2
- Today (2025)
- 3,678,185 people
- By 2030
- 3,856,546 · +4.8%
- By 2040
- 4,171,407 · +13.4%
- By 2050
- 4,421,607 · +20.2%
- By 2075
- 4,831,599 · +31.4%
- By 2100
- 4,832,502 · +31.4%
Race, ethnicity, and origin ACS 2023
- Neighborhood character
- Predominantly White (73%)
- Race & ethnicity
- White 73% Hispanic / Latino 19% Two or more races 10% Asian 3% Black 2%
- Hispanic origin (detail)
- Mexican 15%
- Common ancestry
- Italian 5% Slovak 4% Lithuanian 3%
- Foreign-born
- 9% · Canada, China, South Korea
- Languages at home
- 84% English-only · Spanish 11% German/W. Germanic 2% Chinese 1%
Political lean MEDSL · San Diego
- 2024 margin
- D (+16.8) · D 56.9% · R 40.1% · Other 2.9%
- 2008→2024 swing
- +6.6pp toward D · 2008: 10.2pp · 2024: 16.8pp
- All cycles
- 2024: D+16.8 2020: D+22.8 2016: D+17.8 2012: D+5.1 2008: D+10.2
Not yet ingested
- Civics
- —
Market trends
- HPI YoY
- ▼ -453.14%
- Current HPI
- 320.0778
- Rent YoY
- ▲ 0.10%
- Metro
- San Diego-Chula Vista-Carlsbad, CA
- State GDP YoY
- ▲ 3.21%
- F500 in state
- 116
Industry mix (Fortune 500 HQ in CA)
| Industry | F500 HQs | Revenue |
|---|---|---|
| Technology | 27 | $1,492B |
|
||
| Financial Services | 3 | $174B |
|
||
| Retail | 3 | $44B |
|
||
| Insurance | 3 | $26B |
|
||
| Media / Entertainment | 2 | $115B |
|
||
| Pharmaceuticals / Biotech | 2 | $62B |
|
||
Price history
-24.3% since first listed27 events — show timeline
- 2026-05-14 Price Changed $124,900 SDMLS
- 2026-05-05 Price Changed $127,900 SDMLS
- 2026-04-30 Relisted — SDMLS
- 2026-04-14 Pending — SDMLS
- 2026-03-31 Listing Removed — SDMLS
- 2026-03-31 Listed $128,900 SDMLS
- 2026-03-18 Price Changed $135,000 SDMLS
- 2026-03-07 Price Changed $141,900 SDMLS
- 2026-02-27 Price Changed $142,900 SDMLS
- 2026-02-09 Price Changed $143,900 SDMLS
- 2026-01-08 Price Changed $146,900 SDMLS
- 2025-12-31 Listed $149,900 SDMLS
- 2025-12-01 Price Changed $149,900 SDMLS
- 2025-11-04 Price Changed $154,900 SDMLS
- 2025-08-20 Price Changed $157,900 SDMLS
- 2025-08-20 Relisted — SDMLS
- 2025-08-20 Price Changed $154,900 SDMLS
- 2025-08-18 Pending — SDMLS
- 2025-08-18 Listing Removed — SDMLS
- 2025-07-01 Listed $159,900 SDMLS
- 2025-06-30 Listing Removed — SDMLS
- 2025-06-30 Relisted — SDMLS
- 2025-06-29 Listing Removed — SDMLS
- 2025-05-30 Price Changed $163,900 SDMLS
- 2025-05-07 Relisted — SDMLS
- 2025-05-05 Pending — SDMLS
- 2025-04-01 Listed $164,900 SDMLS
Property tax history
+3.7%/yrLatest (2013): $107 · +5.1% YoY. Source: county tax records.
Cash-flow waterfall
monthlySold comps — $/sqft
last 12 mo · ≤1 miLoading sold comps…