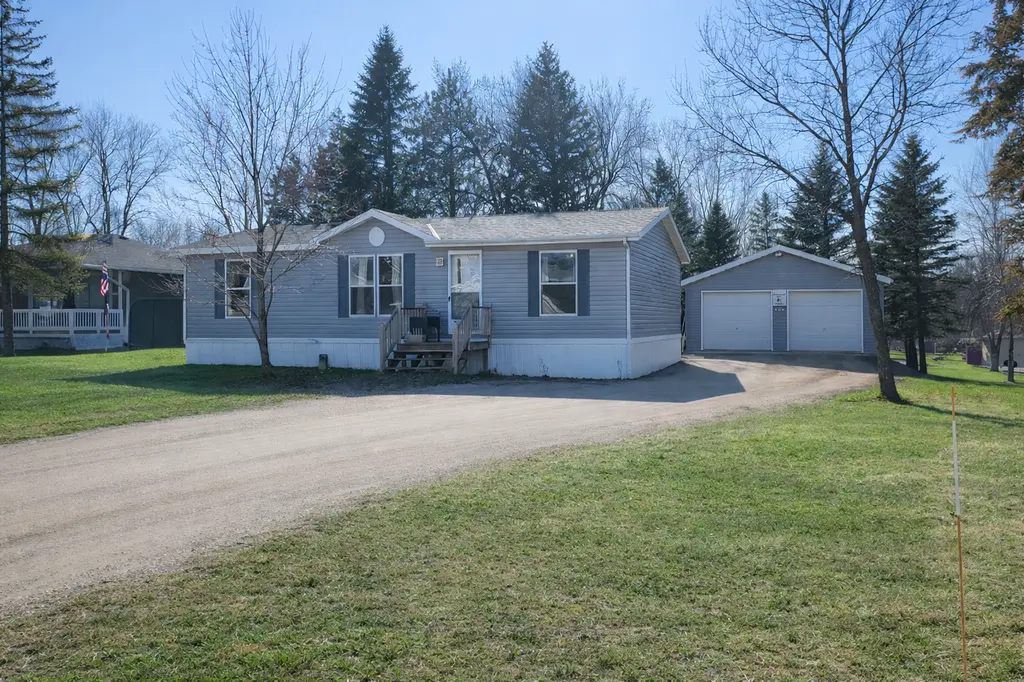
114 Pine St NW · New London, MN
Flood risk 1/10 · Minimal
- FEMA flood zone
- X (unshaded)
- Chance of flooding over 30 yrs
- 0.0%
- Est. flood insurance / yr
- $507 – $1,088
Fire risk 3/10 · Minor
- Est. fire insurance / yr
- $888 – $1,650
Heat risk 2/10 · Minimal
- Hot days now (above 99°F)
- 7 days/yr
- Hot days in 30 yrs
- 13 days/yr
Wind risk 2/10 · Minimal
- Chance of severe wind over 30 yrs
- —
Air-quality risk 2/10 · Minimal
- Unhealthy air days now
- 2 days/yr
- Unhealthy air days in 30 yrs
- 2 days/yr
Risk factors via First Street. Map © Google.
Why this score? — see what drove the D grade
The composite is a weighted blend of 9 inputs, each scored 0–100. Each bar is that input's sub-score; the figure is the points it added to the 100-point composite (weight × sub-score).
- Cash flow +13.1/30.0
- ARV discount +7.5/15.0
- Schools +4.9/10.0
- DSCR +3.9/10.0
- Livability +3.6/5.0
- 1% rule +3.1/10.0
- Rent growth +2.5/5.0
- Condition / age +2.5/5.0
- Appreciation +0.0/10.0
$190,000
🖨 Deal sheet (PDF) 📄 Offer letter ✓ Due diligence
Listing remarks MLS
This is a home that you can afford! It is a must see! Not much needed with this diamond in the rough! Come see your next home!
Key facts
- Trails
- Easy access to lakes
- Large storage shed
Tags
Property features AI
Finance
- Financial info: Conventional financing available
Exterior
- Parking: Gravel parking; 2-car garage (24 x 30)
- Utilities: City water connected; City sewer connected; Natural gas; Electric with circuit breakers (Xcel Energy)
- Home design: Residential property; Manufactured home; One level; Pillar/post/pier foundation; Facing direction not specified
- Construction: Frame construction; Roof age over 8 years
- Exterior features: Vinyl exterior; Patio; Storage shed; Light tree coverage
Interior
- Kitchen: Kitchen with window; Range; Microwave; Refrigerator; Eat-in kitchen layout
- Bedrooms: 3 bedrooms (all on main level)
- Bathrooms: 2 full baths; Primary full bath with walk-in shower; Main floor full bath
- Heating & cooling: Central air; Heating with fireplace(s)
- Interior features: Fireplace(s); Eat-in kitchen; Primary bedroom with walk-in closet; 3 bedrooms on one level; Main floor primary bedroom; Main floor bedroom; Main floor laundry
- Laundry & utility: Washer and dryer included; Washer/Dryer hookup; Laundry located on main level / in hall; Electric water heater; Dryer
Neighborhood map
What this means for you Summary
Snapshot
- This is a 3-bed/2.0-bath single-family listed at $190k.
Deal economics
- At list price, monthly cash flow is $-5 ($-64/yr) — negative.
- To cash-flow at today's rent, offer at most $189k (0.5% below list).
- To meet the 1% rule (rent ≥ 1% of price), the offer needs to be $154k (18.7% below list).
- Recommended offer: $154k (18.7% below list) — sets the bar for 1% rule.
- Cap rate 6.3% vs local median 1.7% in New London — top-decile yield for the area; either an underpriced asset or a hidden risk that comps aren't pricing in. Stress-test before assuming the spread holds.
Location & tenants
- Location reads 71/100 on livability (#309 in MN) — a middle-class / working-renter tenant base. Strengths: crime A+, cost of living A+, housing A+; Watch: health & safety D+, amenities F, commute F.
- New London-Spicer School District (town): math 55% / reading 58% proficiency, ranked #59 of 301 in MN (top 20%) — acceptable for families but not a draw, mixed tenant base, ~2y average lease; only 20% free/reduced lunch — higher-income household profile.
- Zoned schools: Prairie Woods Elementary (math 64% / reading 53%, grade B-, #251 of 857 statewide, top 30%, 567 students, 33% FRL); New London-Spicer Middle (math 53% / reading 60%, grade B, #38 of 258 statewide, top 15%, 476 students, 28% FRL); New London-Spicer Sr. (math 42% / reading 62%, grade D+, #111 of 471 statewide, top 26%, 465 students, 26% FRL).
- Market conditions: 40 active listings in the ZIP; 196 units permitted in Kandiyohi County in 2024 (118 in 5+ unit buildings).
Forward outlook
- Local home prices are declining (-3.0%/yr); year-one equity from $1k of loan paydown is wiped out by about $6k of value loss. Plan a longer hold.
Negotiation context
- Only 11 days on market — expect competitive offers; lowballing is unlikely to land.
- 4 sale attempts since 20y ago with the ask held roughly flat each time — persistent listings suggest the price (not the market) is what's stuck; bring a comps-based counter.
- Current owner paid $54k; list at $190k implies a 252% gain — meaningful room to come down on a strong offer.
Questions for the listing agent
- What do current leases actually rent for vs. the listed asking? Can we see a recent rent roll and the last 12 months of T-12 income?
- Is there a deadline driving the sale (1031 exchange, divorce, estate, relocation)? That informs how much negotiation room exists.
- Schools are A-rated — typically a magnet for longer-tenancy family renters. What's the average tenant stay here, and is there a school-zone premium baked into asking?
- The area grade is low — what's the realistic commute time and amenity access for the typical tenant pool here? Any planned neighborhood developments (good or bad) we should know about?
- What's the average days-on-market for RENTAL listings here right now (not sales)? A rising rental-DOM trend means longer vacancies and softer asking-rent achievability than the comps imply.
- What's the recent tenant-quality profile in this submarket — average credit score on applications, eviction rate, late-payment / NSF rate, and stable-employment percentage? A property-management company in the area should have these aggregated.
- How much new for-sale + rental construction is in the pipeline within 1–3 miles? Heavy new supply typically softens prices + rents 12–24 months out; constrained supply supports both.
Investment metrics
- 1% rule
- 0.81% ✗
- Cap rate
- 6.26%
- Cash-on-cash
- -0.12%
- DSCR
- 0.99
- GRM
- 10.3
CMA / ARV
No comps found within radius.
Projected returns pro-forma
-3.0% appreciation · 3.0% rent growth · sell at horizon
- IRR
- -16.5%
- Equity multiple
- 0.41×
- Total profit
- $-31,158
- Equity at exit
- $28,330
- IRR
- -8.3%
- Equity multiple
- 0.48×
- Total profit
- $-27,692
- Equity at exit
- $16,428
Cash invested: $53,200 (down + closing). Projections, not guarantees.
Landlord ↔ Tenant lean methodology
- Overall (STATE)
- 46 Balanced
- State Minnesota
- 46 Balanced · D+2
- County
- — inherits STATE
- City
- — inherits STATE
ZIP-level market 56273
- Active inventory
- 40
- Price-to-rent
- 10.3×
Monthly cashflow live
- Estimated rent
- $1,545 medium interval (Pro) →
- Mortgage (P&I)
- −$996
- Tax from tax record
- −$150 /mo · $1,800/yr
- Insurance
- −$79
- HOA
- −$0
- Vacancy / Maint / Mgmt
- −$324
- Net cashflow
- $-5
Break-even live
Sensitivity live
| Price | -10% $102 | -5% $48 | +0% $-5 | +5% $-59 | +10% $-113 |
|---|---|---|---|---|---|
| Rent | -10% $-127 | -5% $-66 | +0% $-5 | +5% $56 | +10% $117 |
| Rate | -1.0pp $90 | -0.5pp $43 | base $-5 | +0.5pp $-55 | +1.0pp $-105 |
UW: 25.0% down · 7.5% · 30yr · 1.5% tax · 5.0% vac · 8.0% maint · 8.0% mgmt
Financing live
Cash to close
- Down payment
- $47,500
- Closing costs
- $5,700
- Reserves months
- —
- Total cash needed
- —
Loan-product check · same deal, 3 products live
Conventional
25% down · 7.5% · 30yr
- Down + closing
- —
- Monthly P&I
- —
- Monthly cashflow
- —
- DSCR
- —
- Eligible?
- —
Personal DTI + credit; lowest rate.
DSCR
20% down · 8.5% · 30yr
- Down + closing
- —
- Monthly P&I
- —
- Monthly cashflow
- —
- DSCR
- —
- Eligible?
- —
No personal income docs; deal must DSCR.
Hard money
10% down · 12.0% · 12mo
- Down + closing
- —
- Monthly P&I
- —
- Monthly cashflow
- —
- DSCR
- —
- Eligible?
- —
Short-term bridge; refi at stabilization.
Listing history 9 events
-
2026-05-01status Pending
-
2026-04-28historical Contingent - Other
-
2026-04-20$190,000 Active
-
2006-07-21soldstatus $54,000 129-char remark
Show marketing remark (129 chars)
This is a home that you can afford! It is a must see! Not much needed with this diamond in the rough! Come see your next home!
-
2006-07-10$54,900 129-char remark
Show marketing remark (129 chars)
This is a home that you can afford! It is a must see! Not much needed with this diamond in the rough! Come see your next home!
-
2006-07-07historical
-
2006-06-07$59,900
-
2006-05-28historical
-
2006-01-24$64,900
ⓘ Source: listings_history table (triggers on properties + properties_extension) + one-shot
backfill from property_details.listing_events for pre-trigger history.
Tax reassessment forecast MN · Partial reset (capped growth)
- Current annual tax
- $1,800 · $150/mo
- Projected year-2 tax
- $1,964 · $164/mo
- Expected delta
- +$164/yr (+$14/mo · 9.1%)
ⓘ Screening estimate from a state-policy table — verify with the county assessor before closing.
Climate risk First Street
- Flood 1/10 Low FEMA zone X (unshaded) · 0% chance over 30 yrs
- Wildfire 3/10 Moderate
- Heat 2/10 Low 7 d/yr ≥99°F today · 13 d/yr by 30 yrs out
- Wind 2/10 Low
- Air quality 2/10 Low 2 unhealthy d/yr today · 2 by 30 yrs out
Nearby sold comps map
Loading sold comps map…
Walkable amenities ~0.75 mi
Loading nearby amenities…
Taxation est. · year 1
- Rental income
- $18,535
- − Mortgage interest
- −$10,643
- − Property taxes
- −$1,800
- − Insurance
- −$950
- − Repairs & maintenance
- −$1,483
- − Management
- −$1,483
- − Depreciation
- −$5,527
- Taxable loss
- −$3,351
- Est. tax savings @ 24.0%
- +$804
- After-tax cash flow
- $740/yr
For passive investors: Depreciation is non-cash, so a rental often shows a tax loss while cash-flowing — sheltering income. Rental losses are passive: they offset passive income freely, and up to $25,000/yr can offset ordinary (W-2) income if you actively participate and your MAGI is under $100k (phasing out to $0 by $150k); unused losses carry forward. On sale, claimed depreciation is recaptured at up to 25%, and gains may owe capital-gains tax (a 1031 exchange can defer both). Figures are a year-1 estimate at your 24.0% rate — not tax advice; consult a CPA.
Schools (NCES district)
- District
- New London-Spicer School District
- NCES district ID
- 2723400
- Math proficiency
- 55% ▼ -9.00%
- Reading proficiency
- 58% ▼ -11.00%
- Median HH income
- $62,142
- Composite
- 49.33/100
- National rank
- #2020
- State rank
- #59 of 301 in MN
Livability — New London
- Score
- 71/100
- State rank
- #309
- US rank
- #6805
Category grades
Schools grade is shown separately in the Schools card above.
Census & demographics
- Census place
- New London, MN
- Population (ZIP)
- 5,050
Population outlook (Kandiyohi County) Hauer SSP2
- Today (2025)
- 42,956 people
- By 2030
- 42,825 · -0.3%
- By 2040
- 42,343 · -1.4%
- By 2050
- 42,124 · -1.9%
- By 2075
- 43,726 · +1.8%
- By 2100
- 45,974 · +7.0%
Race, ethnicity, and origin ACS 2023
- Neighborhood character
- Predominantly White (96%)
- Race & ethnicity
- White 96% Two or more races 3% Hispanic / Latino 2%
- Common ancestry
- Portuguese 29% Iranian 3% Scottish 2%
- Foreign-born
- 2% · Canada, South Korea
- Languages at home
- 98% English-only · Spanish 2%
Political lean MEDSL · Kandiyohi
- 2024 margin
- Solid R (+31.0) · D 33.7% · R 64.7% · Other 1.7%
- 2008→2024 swing
- -25.6pp toward R · 2008: -5.5pp · 2024: -31.0pp
- All cycles
- 2024: R+31.0 2020: R+25.7 2016: R+25.5 2012: R+6.7 2008: R+5.5
Not yet ingested
- Civics
- —
Market trends
- HPI YoY
- ▼ -117.66%
- Current HPI
- 176.245
- Rent YoY
- —
- Metro
- —
- State GDP YoY
- ▲ 2.41%
- F500 in state
- 34
Industry mix (Fortune 500 HQ in MN)
| Industry | F500 HQs | Revenue |
|---|---|---|
| Healthcare | 2 | $407B |
|
||
| Retail | 2 | $150B |
|
||
| Consumer Goods | 2 | $32B |
|
||
| Industrial Machinery | 2 | $6B |
|
||
| Agriculture | 1 | $40B |
|
||
| Healthcare / Medical Devices | 1 | $32B |
|
||
Price history
+192.8% since first listed9 events — show timeline
- 2026-05-01 Pending — NORTHSTARMLS as Distributed by MLS Grid
- 2026-04-28 Contingent — NORTHSTARMLS as Distributed by MLS Grid
- 2026-04-20 Listed $190,000 NORTHSTARMLS as Distributed by MLS Grid
- 2006-07-21 Sold (MLS) $54,000 NORTHSTARMLS as Distributed by MLS Grid
- 2006-07-10 Listed $54,900 NORTHSTARMLS as Distributed by MLS Grid
- 2006-07-07 Listing Removed — NORTHSTARMLS as Distributed by MLS Grid
- 2006-06-07 Listed $59,900 NORTHSTARMLS as Distributed by MLS Grid
- 2006-05-28 Listing Removed — NORTHSTARMLS as Distributed by MLS Grid
- 2006-01-24 Listed $64,900 NORTHSTARMLS as Distributed by MLS Grid
Property tax history
+5.8%/yrLatest (2025): $1,800 · +5.0% YoY. Source: county tax records.
Cash-flow waterfall
monthlySold comps — $/sqft
last 12 mo · ≤1 miLoading sold comps…