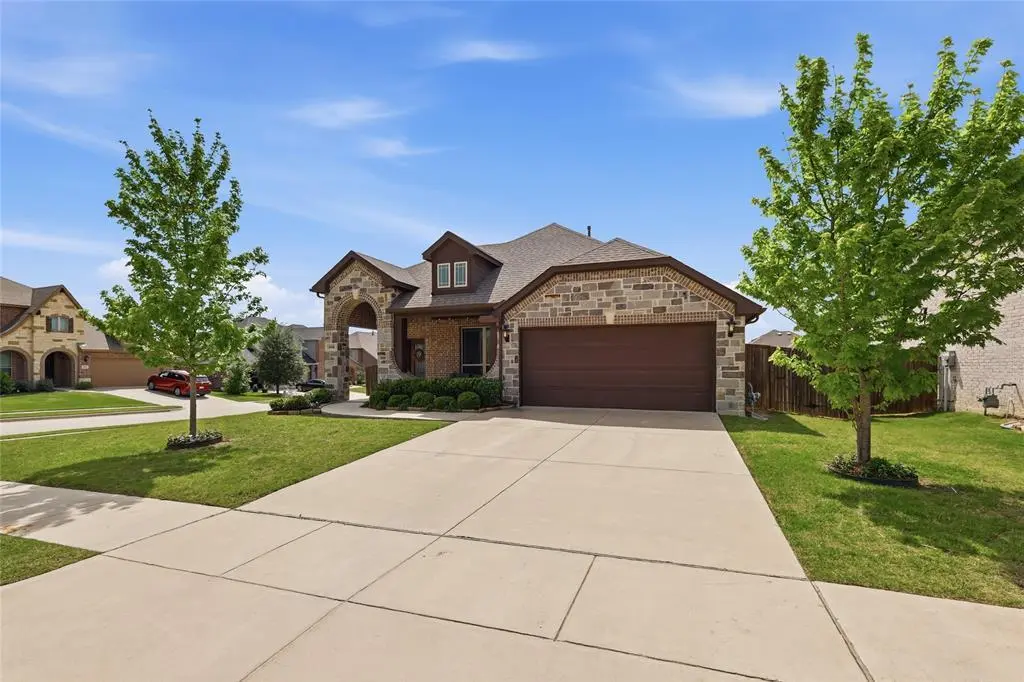
1068 English Oak Dr · Burleson, TX
Flood risk 1/10 · Minimal
- FEMA flood zone
- X (unshaded)
- Chance of flooding over 30 yrs
- 0.0%
- Est. flood insurance / yr
- $507 – $1,088
Fire risk 4/10 · Minor
- Est. fire insurance / yr
- $1,222 – $2,270
Heat risk 7/10 · Major
- Hot days now (above 109°F)
- 7 days/yr
- Hot days in 30 yrs
- 25 days/yr
Wind risk 6/10 · Moderate
- Chance of severe wind over 30 yrs
- 27.0%
Air-quality risk 2/10 · Minimal
- Unhealthy air days now
- 2 days/yr
- Unhealthy air days in 30 yrs
- 2 days/yr
Risk factors via First Street. Map © Google.
Why this score? — see what drove the D- grade
The composite is a weighted blend of 9 inputs, each scored 0–100. Each bar is that input's sub-score; the figure is the points it added to the 100-point composite (weight × sub-score).
- ARV discount +13.4/15.0
- Cash flow +7.8/30.0
- Schools +4.0/10.0
- Livability +4.0/5.0
- Rent growth +2.9/5.0
- Condition / age +2.5/5.0
- 1% rule +2.0/10.0
- DSCR +1.9/10.0
- Appreciation +0.0/10.0
$355,000
🖨 Deal sheet 📄 Offer letter ✓ Due diligence
Listing remarks
Stunning move-in ready home walking distance to top-rated Burleson ISD schools. This beautifully maintained 3 bedroom home with a dedicated office blends modern upgrades, thoughtful details, and unbeatable convenience. With fresh finishes, premium window treatments, and a brand-new roof to be installed prior to closing (buyer’s choice of comparable 30-year laminate shingle), this home is EXACTLY what you've been looking for! Features include. .. Laminate flooring in the hallway and living room for a clean, modern look, Upgraded 5 inch baseboards add a refined, custom feel, Fresh paint throughout most of the house, Plantation shutters for timeless style and privacy, Remote-control sola
Key facts
- 8,625 sq ft lot
- 2 garage spots
- Built 2019
Tags
Property features AI
Finance
- Other: Deed restrictions; Multiple parcel IDs (multi-parcel); Subdivision: Oak Valley Estates
- Financial info: Listing accepts Cash, Conventional, FHA, and VA financing
- HOA & community: Mandatory HOA (Oak Valley Estates HOA); HOA management and contact available; Annual association fee (approximately $100) covering management fees
Exterior
- Parking: Driveway; Attached garage; Covered parking for 2 vehicles; 2-car garage (approx. 20' x 20')
- Utilities: City water; City sewer; Electricity connected; Underground utilities; Sidewalks
- Home design: Single-family residence; One-story; Preowned (built 2019); Smart home features available
- Construction: Brick and rock/stone exterior; Composition roof; Slab foundation; Year built 2019
- Exterior features: Covered patio/porch; Wood fencing; Corner lot; Easements for utilities
Interior
- Kitchen: Dishwasher; Disposal; Microwave; Eat-in kitchen with granite counters
- Bedrooms: 3 bedrooms (all on one level); Primary bedroom on main level
- Flooring: Carpet
- Bathrooms: 2 full bathrooms
- Heating & cooling: Central heating; Central air conditioning
- Interior features: Open floorplan; Decorative lighting; Double vanity in bath; Eat-in kitchen; Granite counters; Cable TV available; High-speed internet available; Electric shades; Plantation shutters; Window coverings
- Laundry & utility: Utility room; Full-size washer/dryer area; Washer hookup
Neighborhood map
What this means for you Summary
Snapshot
- This is a 3-bed/2.0-bath single-family listed at $355k.
Deal economics
- At list price, monthly cash flow is $-400 ($-5k/yr) — negative.
- To cash-flow at today's rent, offer at most $284k (19.9% below list).
- To meet the 1% rule (rent ≥ 1% of price), the offer needs to be $250k (29.7% below list).
- Recommended offer: $250k (29.7% below list) — sets the bar for 1% rule.
- Cap rate 4.9% vs local median 3.5% in Burleson — top-decile yield for the area; either an underpriced asset or a hidden risk that comps aren't pricing in. Stress-test before assuming the spread holds.
Location & tenants
- Location reads 79/100 on livability (#53 in TX, #2,133 nationally) — a middle-class / working-renter tenant base. Strengths: employment A+, cost of living A+, housing A+; Watch: amenities F, commute F.
- Burleson ISD (suburban): math 41% / reading 48% proficiency, ranked #236 of 826 in TX (top 29%) — families likely to look elsewhere, expect single-tenant / working-renter base with shorter leases.
- Zoned schools: Richard Bransom El (math 53% / reading 49%, grade C-, #818 of 4,322 statewide, top 19%, 580 students, 35% FRL) — zoned schools at 35% FRL track the district average.
- Market conditions: Rents rising (+1.8%/yr); 679 active listings in the ZIP; 7 comparable units currently listed for rent nearby; rentals leasing fast (median 12d on market — plan ~1-2 weeks tenant-placement turnaround); solid renter incomes; 2,152 units permitted in Johnson County in 2024 (76 in 5+ unit buildings).
Forward outlook
- Local home prices are declining (-3.0%/yr); year-one equity from $2k of loan paydown is wiped out by about $11k of value loss. Plan a longer hold.
- Johnson County population projected at +24% by 2050 — long-run rental-demand tailwind backs the buy-and-hold thesis.
Negotiation context
- It's been on market 38 days — a 3% lower offer ($344k) is reasonable based on typical stale-listing flexibility.
Risks & watch-outs
- Climate carrying-cost: major wind risk, 27% chance of damaging wind over 30y; extreme-heat days projected 7→25/yr by 2055 (HVAC capex compounding) — expect insurance premiums to compound above CPI over the hold.
Questions for the listing agent
- What do current leases actually rent for vs. the listed asking? Can we see a recent rent roll and the last 12 months of T-12 income?
- It's been on market 38 days. Have you received any prior offers? Is the seller open to a 30% concession, seller financing, or rate buy-down credit?
- What does the HOA fee cover, when was the last increase, and are there any pending special assessments or reserve-fund shortfalls?
- Is there a deadline driving the sale (1031 exchange, divorce, estate, relocation)? That informs how much negotiation room exists.
- The area grade is low — what's the realistic commute time and amenity access for the typical tenant pool here? Any planned neighborhood developments (good or bad) we should know about?
- What's the average days-on-market for RENTAL listings here right now (not sales)? A rising rental-DOM trend means longer vacancies and softer asking-rent achievability than the comps imply.
- What's the recent tenant-quality profile in this submarket — average credit score on applications, eviction rate, late-payment / NSF rate, and stable-employment percentage? A property-management company in the area should have these aggregated.
- How much new for-sale + rental construction is in the pipeline within 1–3 miles? Heavy new supply typically softens prices + rents 12–24 months out; constrained supply supports both.
Investment metrics
- 1% rule
- 0.70% ✗
- Cap rate
- 4.94%
- Cash-on-cash
- -4.83%
- DSCR
- 0.79
- GRM
- 11.9
CMA / ARV
- ARV (median comp)
- $408,122
- List price
- $355,000
- Delta
- -13.02%
- Verdict
- UNDERPRICED
- Comps
- 20 within 1.0 mi
Show comp detail 12 sales within ~0.75 mi
| Address | Dist | Beds/Ba | Sqft | Sold | Price | $/sf | Match |
|---|---|---|---|---|---|---|---|
| 920 Monticello Dr | 0.42mi | 3/2.0 | 1,846 (-1%) | 12mo | $365,000 | $198 | 69 |
| 3700 County Road 530b | 0.37mi | 3/2.0 | 1,848 (-1%) | 20mo | $890,000 | $482 | 65 |
| 851 Valley Ridge Rd | 0.33mi | 4/2.0 (+1) | 2,032 (+9%) | 1mo | $365,000 | $180 | 64 |
| 1138 Destrehan Dr | 0.23mi | 3/2.0 | 2,041 (+10%) | 16mo | $375,000 | $184 | 60 |
| 759 Little Ridge Ct | 0.40mi | 3/2.0 | 1,773 (-5%) | 21mo | $369,900 | $209 | 56 |
| 1304 Monticello Dr | 0.51mi | 3/2.0 | 2,041 (+10%) | 7mo | $379,000 | $186 | 55 |
| 849 Royal Oak Ln | 0.74mi | 3/2.0 | 1,849 (-0%) | 12mo | $349,000 | $189 | 54 |
| 834 Greenwood Dr | 0.53mi | 3/2.0 | 2,117 (+14%) | 6mo | $355,000 | $168 | 47 |
| 940 Tara Dr | 0.39mi | 4/2.0 (+1) | 2,045 (+10%) | 22mo | $382,500 | $187 | 42 |
| 1000 Tarragon Dr | 0.58mi | 3/2.0 | 2,038 (+10%) | 19mo | $375,000 | $184 | 41 |
| 716 Yaupon Ct | 0.65mi | 4/2.0 (+1) | 2,073 (+12%) | 6mo | $369,900 | $178 | 40 |
| 1237 Barberry Dr | 0.50mi | 4/2.0 (+1) | 2,124 (+14%) | 13mo | $385,000 | $181 | 37 |
Match score weights: distance 35% · size 25% · config 20% · recency 20%. Top-matched comps best support the ARV.
Projected returns pro-forma
-3.0% appreciation · 1.78% rent growth · sell at horizon
- IRR
- -25.8%
- Equity multiple
- 0.13×
- Total profit
- $-86,028
- Equity at exit
- $52,932
- IRR
- -26.6%
- Equity multiple
- -0.21×
- Total profit
- $-119,870
- Equity at exit
- $30,694
Cash invested: $99,400 (down + closing). Projections, not guarantees.
Landlord ↔ Tenant lean methodology
- Overall (STATE)
- 87 Strongly Landlord-Friendly
- State Texas
- 87 Strongly Landlord-Friendly · R+5
- County
- — inherits STATE
- City
- — inherits STATE
ZIP-level market 76028
- Home prices YoY
- -33.4%
- Rents YoY
- 1.8%
- Active inventory
- 679
- Price-to-rent
- 11.9×
Monthly cashflow live
- Estimated rent
- $2,495 high interval (Pro) →
- Mortgage (P&I)
- −$1,862
- Tax from tax record
- −$354 /mo · $4,242/yr
- Insurance
- −$148
- HOA
- −$8
- Vacancy / Maint / Mgmt
- −$524
- Net cashflow
- $-400
Break-even live
UW: 25.0% down · 7.5% · 30yr · 1.5% tax · 5.0% vac · 8.0% maint · 8.0% mgmt
Financing live
Cash to close
- Down payment
- $88,750
- Closing costs
- $10,650
- Reserves months
- —
- Total cash needed
- —
Loan-product check · same deal, 3 products live
Conventional
25% down · 7.5% · 30yr
- Down + closing
- —
- Monthly P&I
- —
- Monthly cashflow
- —
- DSCR
- —
- Eligible?
- —
Personal DTI + credit; lowest rate.
DSCR
20% down · 8.5% · 30yr
- Down + closing
- —
- Monthly P&I
- —
- Monthly cashflow
- —
- DSCR
- —
- Eligible?
- —
No personal income docs; deal must DSCR.
Hard money
10% down · 12.0% · 12mo
- Down + closing
- —
- Monthly P&I
- —
- Monthly cashflow
- —
- DSCR
- —
- Eligible?
- —
Short-term bridge; refi at stabilization.
Rent comps 7 comps
| Address | Beds | Baths | Sqft | Rent | $/sqft | DOM | Units | Dist |
|---|---|---|---|---|---|---|---|---|
| 3301 County Road 530B Burleson, TX | 3.0 | 2.0 | 2207 | $3,100 | $1.40 | 1d | 1 | 0.54mi |
| 1125 Marigold Dr Burleson, TX | 3.0 | 2.0 | 2243 | $2,811 | $1.25 | 24d | 1 | 0.62mi |
| 845 Royal Oak Ln Burleson, TX | 3.0 | 2.0 | 1919 | $2,375 | $1.24 | 10d | 1 | 0.74mi |
| 845 Royal Oak Ln Burleson, TX | 3.0 | 2.0 | 1919 | $2,375 | $1.24 | 12d | 1 | 0.74mi |
| 836 Hollow Creek Rd Burleson, TX | 3.0 | 2.0 | 1346 | $1,895 | $1.41 | 20d | 1 | 0.89mi |
| 411 Hidden Ridge Dr Burleson, TX | 3.0 | 2.0 | 2385 | $2,195 | $0.92 | 43d | 1 | 1.00mi |
| 1449 Bennett Dr Burleson, TX | 4.0 | 2.0 | 2617 | $2,850 | $1.09 | 1d | 1 | 1.45mi |
HOA detail
- Monthly dues
- $8 · $96/yr
Listing history 8 events
-
2026-06-08status $355,000 Pending 38 DOM
-
2026-06-07days on market $355,000 Active 38 DOM
-
2026-06-04days on market $355,000 Active 35 DOM
-
2026-06-03days on market $355,000 Active 34 DOM
-
2026-06-02days on market $355,000 Active 33 DOM
-
2026-06-01days on market $355,000 Active 32 DOM
-
2026-05-31days on market $355,000 Active 31 DOM
-
2026-04-30$365,000 Active 1247-char remark
ⓘ Source: listings_history table (triggers on properties + properties_extension) + one-shot
backfill from property_details.listing_events for pre-trigger history.
Tax reassessment forecast TX · Resets to sale price
- Current annual tax
- $4,242 · $354/mo
- Projected year-2 tax
- $6,496 · $541/mo
- Expected delta
- +$2,254/yr (+$188/mo · 53.1%)
ⓘ Screening estimate from a state-policy table — verify with the county assessor before closing.
Climate risk First Street
- Flood 1/10 Low FEMA zone X (unshaded) · 0% chance over 30 yrs
- Wildfire 4/10 Moderate
- Heat 7/10 Severe 7 d/yr ≥109°F today · 25 d/yr by 30 yrs out
- Wind 6/10 Major 27% chance of damaging wind over 30 yrs
- Air quality 2/10 Low 2 unhealthy d/yr today · 2 by 30 yrs out
Nearby sold comps map
Loading sold comps map…
Walkable amenities ~0.75 mi
Loading nearby amenities…
Taxation est. · year 1
- Rental income
- $29,944
- − Mortgage interest
- −$19,886
- − Property taxes
- −$4,242
- − Insurance
- −$1,775
- − Repairs & maintenance
- −$2,396
- − Management
- −$2,396
- − HOA
- −$96
- − Depreciation
- −$10,327
- Taxable loss
- −$11,173
- Est. tax savings @ 24.0%
- +$2,682
- After-tax cash flow
- $-2,116/yr
For passive investors: Depreciation is non-cash, so a rental often shows a tax loss while cash-flowing — sheltering income. Rental losses are passive: they offset passive income freely, and up to $25,000/yr can offset ordinary (W-2) income if you actively participate and your MAGI is under $100k (phasing out to $0 by $150k); unused losses carry forward. On sale, claimed depreciation is recaptured at up to 25%, and gains may owe capital-gains tax (a 1031 exchange can defer both). Figures are a year-1 estimate at your 24.0% rate — not tax advice; consult a CPA.
Schools (NCES district)
- District
- Burleson ISD
- NCES district ID
- 4812180
- Math proficiency
- 41% ▼ -8.00%
- Reading proficiency
- 48% ▼ -3.00%
- Median HH income
- $69,349
- Composite
- 40.05/100
- National rank
- #3818
- State rank
- #236 of 826 in TX
Livability — Burleson
- Score
- 79/100
- State rank
- #53
- US rank
- #2133
Category grades
Schools grade is shown separately in the Schools card above.
Census & demographics
- Census place
- Burleson, TX
- County
- Johnson County · 147,987 people
- City population
- 81,549
- Metro
- Dallas-Fort Worth-Arlington, TX
- Population (ZIP)
- 81,549
- Household income
- $101,138
- Rent vs Own
- Severe rent burden
- 1117.0
Population outlook (Johnson County) Hauer SSP2
- Today (2025)
- 179,678 people
- By 2030
- 189,208 · +5.3%
- By 2040
- 207,261 · +15.4%
- By 2050
- 223,064 · +24.1%
- By 2075
- 259,979 · +44.7%
- By 2100
- 275,395 · +53.3%
Race, ethnicity, and origin ACS 2023
- Neighborhood character
- Predominantly White (69%)
- Race & ethnicity
- White 69% Hispanic / Latino 19% Two or more races 11% Black 6% Asian 1%
- Hispanic origin (detail)
- Mexican 17%
- Common ancestry
- Lithuanian 2% Italian 2% Slovak 2%
- Foreign-born
- 5% · Canada
- Languages at home
- 88% English-only · Spanish 10% Other Indo-European 1%
Political lean MEDSL · Johnson
- 2024 margin
- Solid R (+51.4) · D 23.9% · R 75.3%
- 2008→2024 swing
- -3.9pp toward R · 2008: -47.5pp · 2024: -51.4pp
- All cycles
- 2024: R+51.4 2020: R+53.0 2016: R+58.3 2012: R+55.6 2008: R+47.5
Not yet ingested
- Civics
- —
Market trends
- HPI YoY
- ▼ -141.44%
- Current HPI
- 282.466
- Rent YoY
- ▲ 1.78%
- Metro
- Dallas-Fort Worth-Arlington, TX
- State GDP YoY
- ▲ 3.95%
- F500 in state
- 110
Industry mix (Fortune 500 HQ in TX)
| Industry | F500 HQs | Revenue |
|---|---|---|
| Energy | 16 | $1,198B |
|
||
| Technology | 5 | $198B |
|
||
| Engineering / Construction | 4 | $72B |
|
||
| Energy Services | 3 | $60B |
|
||
| Utilities | 3 | $41B |
|
||
| Healthcare | 2 | $330B |
|
||
Price history
-2.7% since first listed3 events — show timeline
- 2026-06-07 Pending — NTREIS
- 2026-05-23 Price Changed $355,000 NTREIS
- 2026-04-30 Listed $365,000 NTREIS
Property tax history
+27.7%/yrLatest (2025): $4,242 · +5.6% YoY. Source: county tax records.
Cash-flow waterfall
monthlySold comps — $/sqft
last 12 mo · ≤1 miLoading sold comps…