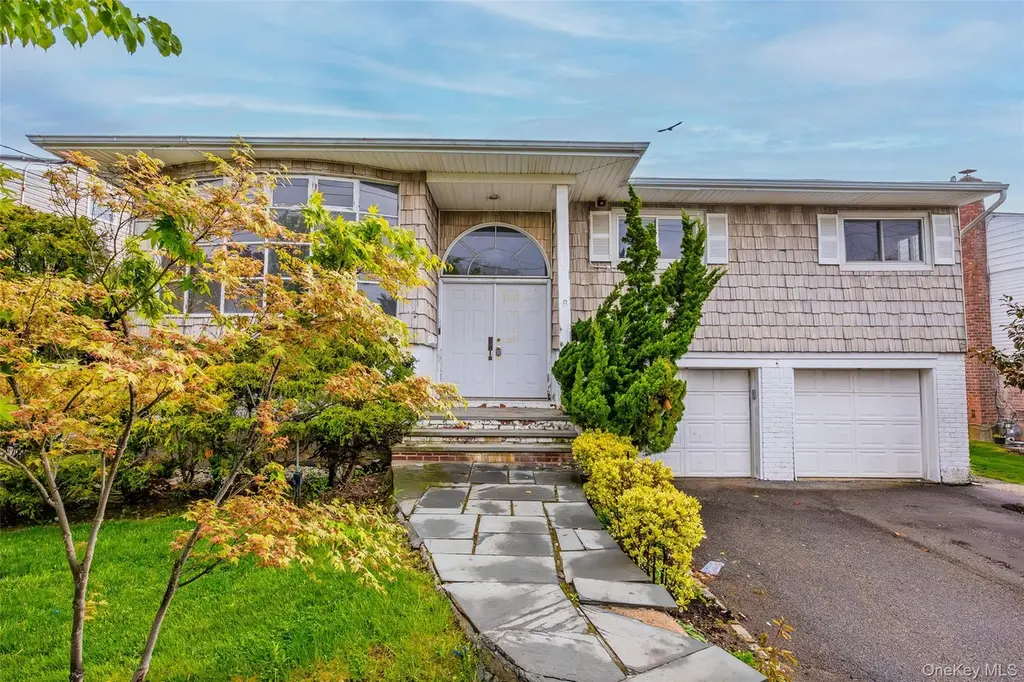
3386 Bertha Dr · Baldwin, NY
Flood risk 7/10 · Major
- FEMA flood zone
- AE
- Chance of flooding over 30 yrs
- 0.95%
- Est. flood insurance / yr
- $2,026 – $9,024
Fire risk 1/10 · Minimal
- Est. fire insurance / yr
- $691 – $1,283
Heat risk 6/10 · Moderate
- Hot days now (above 94°F)
- 7 days/yr
- Hot days in 30 yrs
- 17 days/yr
Wind risk 6/10 · Moderate
- Chance of severe wind over 30 yrs
- 72.0%
Air-quality risk 4/10 · Minor
- Unhealthy air days now
- 4 days/yr
- Unhealthy air days in 30 yrs
- 6 days/yr
Risk factors via First Street. Map © Google.
Why this score? — see what drove the D grade
The composite is a weighted blend of 9 inputs, each scored 0–100. Each bar is that input's sub-score; the figure is the points it added to the 100-point composite (weight × sub-score).
- ARV discount +15.0/15.0
- Cash flow +7.6/30.0
- Schools +6.5/10.0
- Livability +4.2/5.0
- 1% rule +3.5/10.0
- Rent growth +2.5/5.0
- Condition / age +2.5/5.0
- DSCR +1.7/10.0
- Appreciation +0.0/10.0
$704,900
🖨 Deal sheet 📄 Offer letter ✓ Due diligence
Listing remarks
Experience true South Shore waterfront living in this spacious 4-bedroom, 3-bath canal front home on Bertha Drive. Perfectly positioned on a quiet Baldwin canal, this property offers direct water access and a layout designed for comfort, flexibility, and year-round enjoyment. The main level features bright living spaces, an eat-in kitchen, and well-proportioned bedrooms, including a primary bedroom with its own private bath. The additional bedrooms and baths provide convenience for guests, extended family, or multi-generational living. The walkout lower level expands your living options with a generous living room/den area complete with a fireplace, creating a warm and inviting space for ga
Key facts
- Private bath
- Walkout lower level
- Canal front home
Tags
Property features AI
Exterior
- Parking: Garage; 2-car garage
- Utilities: Public sewer; Electricity connected; Natural gas available
- Home design: Single family residence
- Construction: Frame construction
- Exterior features: Frame construction; Waterfront property
Interior
- Kitchen: Other appliances
- Bedrooms: 9 total rooms (includes bedrooms and living spaces)
- Bathrooms: 3 full bathrooms
- Heating & cooling: Hot air heating; Natural gas heating; Other heating; No central air conditioning
- Interior features: Other interior features; Unfinished attic; No basement
- Laundry & utility: Dedicated laundry room
Neighborhood map
What this means for you Summary
Snapshot
- This is a 5-bed/2.5-bath single-family listed at $705k.
Deal economics
- At list price, monthly cash flow is $-1k ($-16k/yr) — negative.
- To cash-flow at today's rent, offer at most $475k (32.6% below list).
- To meet the 1% rule (rent ≥ 1% of price), the offer needs to be $600k (14.9% below list).
- Recommended offer: $475k (32.6% below list) — sets the bar for cash-flow.
- Cap rate 4.9% vs local median 2.7% in Baldwin — top-decile yield for the area; either an underpriced asset or a hidden risk that comps aren't pricing in. Stress-test before assuming the spread holds.
Location & tenants
- Location reads 85/100 on livability (#38 in NY, #580 nationally) — a professional / high-income tenant draw. Strengths: amenities A+, commute A+, employment A+; Watch: cost of living F.
- Baldwin Union Free School District (suburban): math 69% / reading 73% proficiency, ranked #93 of 590 in NY (top 16%) — strong family-tenant draw, lease renewals of 3-5y typical; only 14% free/reduced lunch — higher-income household profile.
- Zoned schools: Meadow Elementary School (math 62% / reading 72%, grade B+, #525 of 2,108 statewide, top 27%, 588 students, 40% FRL); Baldwin Middle School (math 44% / reading 66%, grade B-, #212 of 729 statewide, top 29%, 1,027 students, 45% FRL); Baldwin Senior High School (math 95% / reading 92%, grade A+, #131 of 1,100 statewide, top 13%, 1,484 students, 37% FRL) — zoned schools average 41% FRL vs 14% district-wide (27 pts higher); higher-poverty schools than district average — tighter screening recommended.
- Market conditions: 161 active listings in the ZIP; 1 comparable units currently listed for rent nearby; 824 units permitted in Nassau County in 2024 (153 in 5+ unit buildings).
Forward outlook
- Local home prices are declining (-3.0%/yr); year-one equity from $5k of loan paydown is wiped out by about $21k of value loss. Plan a longer hold.
- Nassau County population projected at +7% by 2050 — modest demand growth; plan on rents tracking national, not racing it.
Negotiation context
- It's been on market 38 days — a 3% lower offer ($684k) is reasonable based on typical stale-listing flexibility.
- Current owner paid $315k; list at $705k implies a 124% gain — meaningful room to come down on a strong offer.
Risks & watch-outs
- Watch-outs: property tax is 2.7% of price; flood insurance adds $460/mo.
- Climate carrying-cost: in FEMA flood zone AE (mandatory federal flood insurance); major wind risk, 72% chance of damaging wind over 30y; extreme-heat days projected 7→17/yr by 2055 (HVAC capex compounding) — expect insurance premiums to compound above CPI over the hold.
Questions for the listing agent
- What do current leases actually rent for vs. the listed asking? Can we see a recent rent roll and the last 12 months of T-12 income?
- It's been on market 38 days. Have you received any prior offers? Is the seller open to a 33% concession, seller financing, or rate buy-down credit?
- Built in 1962 — when were the roof, HVAC, electrical panel, plumbing, and water heater last replaced?
- Property tax is high relative to price — has the assessment been appealed recently, and will the sale trigger a re-assessment?
- What's the actual annual flood-insurance premium (NFIP or private), and is the property in a SFHA with mandatory coverage?
- Is there a deadline driving the sale (1031 exchange, divorce, estate, relocation)? That informs how much negotiation room exists.
- Schools are A-rated — typically a magnet for longer-tenancy family renters. What's the average tenant stay here, and is there a school-zone premium baked into asking?
- The area grade is low — what's the realistic commute time and amenity access for the typical tenant pool here? Any planned neighborhood developments (good or bad) we should know about?
- What's the average days-on-market for RENTAL listings here right now (not sales)? A rising rental-DOM trend means longer vacancies and softer asking-rent achievability than the comps imply.
- What's the recent tenant-quality profile in this submarket — average credit score on applications, eviction rate, late-payment / NSF rate, and stable-employment percentage? A property-management company in the area should have these aggregated.
- How much new for-sale + rental construction is in the pipeline within 1–3 miles? Heavy new supply typically softens prices + rents 12–24 months out; constrained supply supports both.
Investment metrics
- 1% rule
- 0.85% ✗
- Cap rate
- 4.86%
- Cash-on-cash
- -5.11%
- DSCR
- 0.77
- GRM
- 9.8
CMA / ARV
- ARV (median comp)
- $935,438
- List price
- $704,900
- Delta
- -24.64%
- Verdict
- UNDERPRICED
- Comps
- 20 within 1.0 mi
Show comp detail 10 sales within ~0.75 mi
| Address | Dist | Beds/Ba | Sqft | Sold | Price | $/sf | Match |
|---|---|---|---|---|---|---|---|
| 3379 Bertha Dr | 0.03mi | 6/2.5 (+1) | 2,800 (-5%) | 10mo | $810,000 | $289 | 77 |
| 3394 Bertha Dr | 0.01mi | 5/2.0 | 3,092 (+5%) | 24mo | $600,000 | $194 | 70 |
| 1001 Green Pl | 0.16mi | 5/3.0 | 2,668 (-9%) | 10mo | $800,000 | $300 | 66 |
| 3362 Colony Dr | 0.32mi | 4/2.5 (-1) | 2,800 (-5%) | 7mo | $910,000 | $325 | 66 |
| 3526 Daniel Cres | 0.33mi | 4/2.5 (-1) | 2,584 (-12%) | 1mo | $858,500 | $332 | 58 |
| 3208 Grand Blvd | 0.35mi | 4/2.5 (-1) | 2,673 (-9%) | 10mo | $780,000 | $292 | 55 |
| 859 Jefferson St | 0.62mi | 4/4.0 (-1) | 3,000 (+2%) | 10mo | $825,000 | $275 | 48 |
| 1116 Washington Pl | 0.66mi | 4/2.5 (-1) | 2,640 (-10%) | 4mo | $875,000 | $331 | 44 |
| 3161 Grand Ave | 0.64mi | 4/2.5 (-1) | 2,546 (-14%) | 7mo | $900,000 | $353 | 36 |
| 673 Jackie Ln | 0.75mi | 4/2.5 (-1) | 2,751 (-7%) | 17mo | $850,000 | $309 | 35 |
Match score weights: distance 35% · size 25% · config 20% · recency 20%. Top-matched comps best support the ARV.
Projected returns pro-forma
-3.0% appreciation · 3.0% rent growth · sell at horizon
- IRR
- -30.0%
- Equity multiple
- 0.01×
- Total profit
- $-196,311
- Equity at exit
- $105,103
- IRR
- -30.6%
- Equity multiple
- -0.39×
- Total profit
- $-274,398
- Equity at exit
- $60,947
Cash invested: $197,372 (down + closing). Projections, not guarantees.
Landlord ↔ Tenant lean methodology
- Overall (STATE)
- 15 Strongly Tenant-Friendly
- State New York
- 15 Strongly Tenant-Friendly · D+10
- County
- — inherits STATE
- City
- — inherits STATE
ZIP-level market 11510
- Active inventory
- 161
- Price-to-rent
- 9.8×
Monthly cashflow live
- Estimated rent
- $6,000 medium interval (Pro) →
- Mortgage (P&I)
- −$3,697
- Tax from tax record
- −$1,591 /mo · $19,090/yr
- Insurance
- −$294
- Flood insurance flood zone
- −$460 /mo · $5,525/yr
- HOA
- −$0
- Vacancy / Maint / Mgmt
- −$1,260
- Net cashflow
- $-1,302
Break-even live
UW: 25.0% down · 7.5% · 30yr · 1.5% tax · 5.0% vac · 8.0% maint · 8.0% mgmt
Financing live
Cash to close
- Down payment
- $176,225
- Closing costs
- $21,147
- Reserves months
- —
- Total cash needed
- —
Loan-product check · same deal, 3 products live
Conventional
25% down · 7.5% · 30yr
- Down + closing
- —
- Monthly P&I
- —
- Monthly cashflow
- —
- DSCR
- —
- Eligible?
- —
Personal DTI + credit; lowest rate.
DSCR
20% down · 8.5% · 30yr
- Down + closing
- —
- Monthly P&I
- —
- Monthly cashflow
- —
- DSCR
- —
- Eligible?
- —
No personal income docs; deal must DSCR.
Hard money
10% down · 12.0% · 12mo
- Down + closing
- —
- Monthly P&I
- —
- Monthly cashflow
- —
- DSCR
- —
- Eligible?
- —
Short-term bridge; refi at stabilization.
Rent comps 1 comps
| Address | Beds | Baths | Sqft | Rent | $/sqft | DOM | Units | Dist |
|---|---|---|---|---|---|---|---|---|
| 3544 Woodward St Oceanside, NY | 5.0 | 3.0 | 2750 | $6,000 | $2.18 | 19d | 1 | 0.88mi |
Listing history 18 events
-
2026-06-18status $704,900 Pending 38 DOM
-
2026-06-18days on market $704,900 Active 38 DOM
-
2026-06-17days on market $704,900 Active 37 DOM
-
2026-06-16days on market $704,900 Active 36 DOM
-
2026-06-15days on market $704,900 Active 35 DOM
-
2026-06-13days on market $704,900 Active 33 DOM
-
2026-06-13days on market $704,900 Active 32 DOM
-
2026-06-09days on market $704,900 Active 29 DOM
-
2026-06-08days on market $704,900 Active 28 DOM
-
2026-06-07days on market $704,900 Active 27 DOM
-
2026-06-04days on market $704,900 Active 24 DOM
-
2026-06-03days on market $704,900 Active 23 DOM
-
2026-06-02days on market $704,900 Active 22 DOM
-
2026-06-01days on market $704,900 Active 21 DOM
-
2026-05-31days on market $704,900 Active 20 DOM
-
2026-05-11$704,900 Active 1245-char remark
-
1998-09-29soldstatus $315,000
-
1983-09-01soldstatus $152,500
ⓘ Source: listings_history table (triggers on properties + properties_extension) + one-shot
backfill from property_details.listing_events for pre-trigger history.
Tax reassessment forecast NY · Partial reset (capped growth)
- Current annual tax
- $19,090 · $1,591/mo
- Projected year-2 tax
- $19,090 · $1,591/mo
- Expected delta
- $0/yr ($0/mo · 0.0%)
ⓘ Screening estimate from a state-policy table — verify with the county assessor before closing.
Climate risk First Street
- Flood 7/10 Severe FEMA zone AE · 95% chance over 30 yrs
- Wildfire 1/10 Low
- Heat 6/10 Major 7 d/yr ≥94°F today · 17 d/yr by 30 yrs out
- Wind 6/10 Major 72% chance of damaging wind over 30 yrs
- Air quality 4/10 Moderate 4 unhealthy d/yr today · 6 by 30 yrs out
Nearby sold comps map
Loading sold comps map…
Walkable amenities ~0.75 mi
Loading nearby amenities…
Taxation est. · year 1
- Rental income
- $72,000
- − Mortgage interest
- −$39,485
- − Property taxes
- −$19,090
- − Insurance
- −$9,050
- − Repairs & maintenance
- −$5,760
- − Management
- −$5,760
- − Depreciation
- −$20,506
- Taxable loss
- −$27,651
- Est. tax savings @ 24.0%
- +$6,636
- After-tax cash flow
- $-8,982/yr
For passive investors: Depreciation is non-cash, so a rental often shows a tax loss while cash-flowing — sheltering income. Rental losses are passive: they offset passive income freely, and up to $25,000/yr can offset ordinary (W-2) income if you actively participate and your MAGI is under $100k (phasing out to $0 by $150k); unused losses carry forward. On sale, claimed depreciation is recaptured at up to 25%, and gains may owe capital-gains tax (a 1031 exchange can defer both). Figures are a year-1 estimate at your 24.0% rate — not tax advice; consult a CPA.
Schools (NCES district)
- District
- Baldwin Union Free School District
- NCES district ID
- 3603840
- Math proficiency
- 69% ▲ 7.00%
- Reading proficiency
- 73% ▲ 12.00%
- Median HH income
- $99,594
- Composite
- 64.93/100
- National rank
- #509
- State rank
- #93 of 590 in NY
Livability — Baldwin
- Score
- 85/100
- State rank
- #38
- US rank
- #580
Category grades
Schools grade is shown separately in the Schools card above.
Census & demographics
- Census place
- Baldwin, NY
- City population
- 34,814
- Population (ZIP)
- 34,814
Population outlook (Nassau County) Hauer SSP2
- Today (2025)
- 1,409,302 people
- By 2030
- 1,431,482 · +1.6%
- By 2040
- 1,471,607 · +4.4%
- By 2050
- 1,502,845 · +6.6%
- By 2075
- 1,575,403 · +11.8%
- By 2100
- 1,554,356 · +10.3%
Race, ethnicity, and origin ACS 2023
- Neighborhood character
- Highly diverse neighborhood (Simpson 0.71)
- Race & ethnicity
- Black 41% White 28% Hispanic / Latino 22% Two or more races 13% Asian 4%
- Hispanic origin (detail)
- Puerto Rican 4% Dominican 4%
- Common ancestry
- Hispanic 8% Romanian 1% Scotch-Irish 1%
- Foreign-born
- 25% · Canada, Dominican Republic, Jamaica
- Languages at home
- 72% English-only · Spanish 15% French/Haitian/Cajun 7% Other Indo-European 1%
Political lean MEDSL · Nassau
- 2024 margin
- Toss-up / Even · D 47.9% · R 52.1%
- 2008→2024 swing
- -12.6pp toward R · 2008: 8.4pp · 2024: -4.2pp
- All cycles
- 2024: R+4.2 2020: D+9.5 2016: D+5.3 2012: D+6.7 2008: D+8.4
Not yet ingested
- Civics
- —
Market trends
- HPI YoY
- ▼ -578.11%
- Current HPI
- 314.4598
- Rent YoY
- —
- Metro
- —
- State GDP YoY
- ▲ 2.60%
- F500 in state
- 92
Industry mix (Fortune 500 HQ in NY)
| Industry | F500 HQs | Revenue |
|---|---|---|
| Financial Services | 10 | $950B |
|
||
| Consumer Goods | 9 | $162B |
|
||
| Insurance | 4 | $225B |
|
||
| Telecommunications | 2 | $144B |
|
||
| Pharmaceuticals | 2 | $112B |
|
||
| Media / Entertainment | 2 | $69B |
|
||
Price history
+362.2% since first listed3 events — show timeline
- 2026-05-11 Listed $704,900 OneKey® MLS as Distributed by MLS Grid
- 1998-09-29 Sold (Public Records) $315,000 Public Records
- 1983-09-01 Sold (Public Records) $152,500 Public Records
Property tax history
+1.3%/yrLatest (2024): $19,090 · -2.8% YoY. Source: county tax records.
Cash-flow waterfall
monthlySold comps — $/sqft
last 12 mo · ≤1 miLoading sold comps…