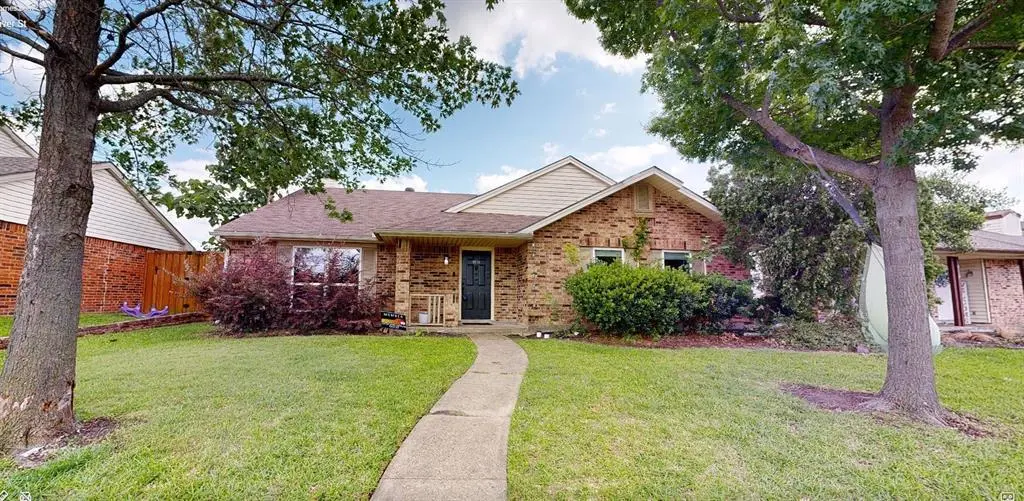
9114 Denver St · Rowlett, TX
Flood risk 1/10 · Minimal
- FEMA flood zone
- X (unshaded)
- Chance of flooding over 30 yrs
- 0.0%
- Est. flood insurance / yr
- $507 – $1,088
Fire risk 1/10 · Minimal
- Est. fire insurance / yr
- $1,222 – $2,270
Heat risk 7/10 · Major
- Hot days now (above 109°F)
- 7 days/yr
- Hot days in 30 yrs
- 24 days/yr
Wind risk 6/10 · Moderate
- Chance of severe wind over 30 yrs
- 27.0%
Air-quality risk 2/10 · Minimal
- Unhealthy air days now
- 2 days/yr
- Unhealthy air days in 30 yrs
- 2 days/yr
Risk factors via First Street. Map © Google.
Why this score? — see what drove the D grade
The composite is a weighted blend of 9 inputs, each scored 0–100. Each bar is that input's sub-score; the figure is the points it added to the 100-point composite (weight × sub-score).
- ARV discount +14.1/15.0
- Cash flow +8.0/30.0
- Schools +5.0/10.0
- 1% rule +3.8/10.0
- Livability +3.8/5.0
- Condition / age +2.5/5.0
- Rent growth +2.2/5.0
- DSCR +2.1/10.0
- Appreciation +1.6/10.0
$254,900
🖨 Deal sheet (PDF) 📄 Offer letter ✓ Due diligence
Listing remarks
Looking for a home where you can live comfortably while adding your own updates and building instant equity? This 3-bedroom, 2-bath, 2-car garage home offers that opportunity. Tucked away at the end of a quiet cul-de-sac, the property is located in highly sought-after Rockwall ISD and benefits from lower Rockwall County taxes, with no HOA restrictions. Whether you are an investor or a buyer wanting to create your dream home over time, this property has tremendous potential. Schedule your showing today and do not miss this opportunity. Please note: This property is being sold AS IS The sale will require approval from both the lender and the court, therfore closing must be at least 60 days af
Key facts
- No hoa restrictions
- Cul-de-sac
- Rockwall isd
Tags
Property features AI
Finance
- Financial info: Listing available for cash or conventional financing; Short sale listed with standard listing agreement
- HOA & community: No homeowner association
Exterior
- Parking: Attached 2-car garage; Covered parking for 2 vehicles; Driveway; Alley access; Garage faces rear; Garage door opener
- Security: Smoke detectors
- Utilities: City water; City sewer; Not in a municipal utility district
- Home design: Single-family home; One story; Not attached
- Construction: Brick exterior; Asphalt roof; Slab foundation; Built in 1983
- Exterior features: Patio; Gutters; Wood fencing; Large backyard with grass; Few trees; Interior lot in a subdivision
Interior
- Kitchen: Dishwasher; Garbage disposal; Electric range; Microwave; Breakfast bar; Built-in cabinets; Granite / natural stone counters; Pantry
- Bedrooms: 3 bedrooms (all on the main level)
- Flooring: Carpet; Ceramic tile
- Bathrooms: 2 full bathrooms
- Heating & cooling: Central heating; Central air; Electric cooling; Ceiling fans
- Interior features: Wet bar; Granite counters; High-speed internet available; Cable TV available; Window coverings
- Laundry & utility: Full-size washer/dryer area; Utility room; Electric dryer hookup
Neighborhood map
What this means for you Summary
Snapshot
- This is a 3-bed/2.0-bath single-family listed at $255k.
Deal economics
- At list price, monthly cash flow is $-260 ($-3k/yr) — negative.
- To cash-flow at today's rent, offer at most $209k (18.1% below list).
- To meet the 1% rule (rent ≥ 1% of price), the offer needs to be $224k (12.2% below list).
- Recommended offer: $209k (18.1% below list) — sets the bar for cash-flow.
- Cap rate 5.1% vs local median 3.1% in Rowlett — top-decile yield for the area; either an underpriced asset or a hidden risk that comps aren't pricing in. Stress-test before assuming the spread holds.
Location & tenants
- Location reads 75/100 on livability (#147 in TX, #4,150 nationally) — a middle-class / working-renter tenant base. Strengths: employment A+, housing A+, crime A-; Watch: amenities F, commute F, health & safety D-.
- Rockwall ISD (suburban): math 54% / reading 54% proficiency, ranked #83 of 826 in TX (top 10%) — acceptable for families but not a draw, mixed tenant base, ~2y average lease.
- Zoned schools: Doris Cullins-Lake Pointe El (math 39% / reading 40%, grade F, #1,545 of 4,322 statewide, top 38%, 548 students, 55% FRL); J W Williams Middle (math 51% / reading 55%, grade C+, #281 of 1,662 statewide, top 18%, 828 students, 21% FRL); Rockwall-Heath H S (math 50% / reading 61%, grade C, #364 of 1,632 statewide, top 23%, 2,912 students, 28% FRL).
- Market conditions: Rents soft (-1.2%/yr); 301 active listings in the ZIP; 40 comparable units currently listed for rent nearby; rentals at typical pace (median 27d on market — plan ~3-4 weeks tenant-placement turnaround); 40% of comp listings sitting > 30 days — soft ceiling on asking rent; solid renter incomes; 1,810 units permitted in Rockwall County in 2024 (0 in 5+ unit buildings).
Forward outlook
- Local home prices are declining (-3.0%/yr); year-one equity from $2k of loan paydown is wiped out by about $8k of value loss. Plan a longer hold.
- Rockwall County population projected at +56% by 2050 — long-run rental-demand tailwind backs the buy-and-hold thesis.
Negotiation context
- It's been on market 38 days — a 3% lower offer ($247k) is reasonable based on typical stale-listing flexibility.
- 4 sale attempts since 7y ago with the ask held roughly flat each time — persistent listings suggest the price (not the market) is what's stuck; bring a comps-based counter.
Risks & watch-outs
- Watch-outs: property tax is 2.8% of price.
- Climate carrying-cost: major wind risk, 27% chance of damaging wind over 30y; extreme-heat days projected 7→24/yr by 2055 (HVAC capex compounding) — expect insurance premiums to compound above CPI over the hold.
Questions for the listing agent
- What do current leases actually rent for vs. the listed asking? Can we see a recent rent roll and the last 12 months of T-12 income?
- It's been on market 38 days. Have you received any prior offers? Is the seller open to a 18% concession, seller financing, or rate buy-down credit?
- Property tax is high relative to price — has the assessment been appealed recently, and will the sale trigger a re-assessment?
- Is there a deadline driving the sale (1031 exchange, divorce, estate, relocation)? That informs how much negotiation room exists.
- The area grade is low — what's the realistic commute time and amenity access for the typical tenant pool here? Any planned neighborhood developments (good or bad) we should know about?
- What's the average days-on-market for RENTAL listings here right now (not sales)? A rising rental-DOM trend means longer vacancies and softer asking-rent achievability than the comps imply.
- What's the recent tenant-quality profile in this submarket — average credit score on applications, eviction rate, late-payment / NSF rate, and stable-employment percentage? A property-management company in the area should have these aggregated.
- How much new for-sale + rental construction is in the pipeline within 1–3 miles? Heavy new supply typically softens prices + rents 12–24 months out; constrained supply supports both.
Investment metrics
- 1% rule
- 0.88% ✗
- Cap rate
- 5.07%
- Cash-on-cash
- -4.38%
- DSCR
- 0.81
- GRM
- 9.5
CMA / ARV
- ARV (median comp)
- $298,732
- List price
- $254,900
- Delta
- -14.67%
- Verdict
- UNDERPRICED
- Comps
- 20 within 1.0 mi
Show comp detail 12 sales within ~0.75 mi
| Address | Dist | Beds/Ba | Sqft | Sold | Price | $/sf | Match |
|---|---|---|---|---|---|---|---|
| 9101 Denver St | 0.04mi | 3/2.0 | 1,916 (0%) | 2mo | $275,000 | $144 | 97 |
| 6101 Greenlawn St | 0.12mi | 3/2.0 | 1,908 (-0%) | 4mo | $209,900 | $110 | 90 |
| 9421 Shipman St | 0.35mi | 3/2.0 | 1,894 (-1%) | 2mo | $309,900 | $164 | 81 |
| 9017 Linda Vista Dr | 0.10mi | 3/2.0 | 1,748 (-9%) | 2mo | $297,999 | $170 | 79 |
| 9210 Linda Vista Dr | 0.13mi | 3/2.0 | 1,748 (-9%) | 1mo | $305,000 | $174 | 78 |
| 6109 Denver St | 0.26mi | 4/2.0 (+1) | 1,895 (-1%) | 3mo | $299,000 | $158 | 78 |
| 9101 Willowbrook Dr | 0.19mi | 3/2.0 | 1,791 (-6%) | 4mo | $280,000 | $156 | 77 |
| 5618 Allen Ln | 0.52mi | 3/2.0 | 1,893 (-1%) | 1mo | $395,000 | $209 | 73 |
| 5502 Vagas Dr | 0.31mi | 3/2.0 | 1,700 (-11%) | 2mo | $318,244 | $187 | 64 |
| 9201 Vagas Dr | 0.24mi | 3/2.0 | 1,651 (-14%) | 2mo | $265,000 | $161 | 64 |
| 4914 Clay Dr | 0.63mi | 3/2.0 | 1,877 (-2%) | 4mo | $328,000 | $175 | 64 |
| 8209 Kensington Dr | 0.63mi | 3/2.0 | 1,755 (-8%) | 2mo | $289,999 | $165 | 54 |
Match score weights: distance 35% · size 25% · config 20% · recency 20%. Top-matched comps best support the ARV.
Projected returns pro-forma
-3.0% appreciation · 0.0% rent growth · sell at horizon
- IRR
- -27.6%
- Equity multiple
- 0.10×
- Total profit
- $-64,254
- Equity at exit
- $38,006
- IRR
- -46.1%
- Equity multiple
- -0.43×
- Total profit
- $-101,848
- Equity at exit
- $22,039
Cash invested: $71,372 (down + closing). Projections, not guarantees.
Landlord ↔ Tenant lean methodology
- Overall (STATE)
- 87 Strongly Landlord-Friendly
- State Texas
- 87 Strongly Landlord-Friendly · R+5
- County
- — inherits STATE
- City
- — inherits STATE
ZIP-level market 75088
- Home prices YoY
- -2.0%
- Rents YoY
- -1.2%
- Active inventory
- 301
- Price-to-rent
- 9.5×
Monthly cashflow live
- Estimated rent
- $2,237 high interval (Pro) →
- Mortgage (P&I)
- −$1,337
- Tax from tax record
- −$585 /mo · $7,017/yr
- Insurance
- −$106
- HOA
- −$0
- Lot rent
- −$0
- Vacancy / Maint / Mgmt
- −$470
- Net cashflow
- $-260
Break-even live
Sensitivity live
| Price | -10% $-116 | -5% $-188 | +0% $-260 | +5% $-333 | +10% $-405 |
|---|---|---|---|---|---|
| Rent | -10% $-437 | -5% $-349 | +0% $-260 | +5% $-172 | +10% $-84 |
| Rate | -1.0pp $-132 | -0.5pp $-196 | base $-260 | +0.5pp $-327 | +1.0pp $-394 |
UW: 25.0% down · 7.5% · 30yr · 1.5% tax · 5.0% vac · 8.0% maint · 8.0% mgmt
Financing live
Cash to close
- Down payment
- $63,725
- Closing costs
- $7,647
- Reserves months
- —
- Total cash needed
- —
Loan-product check · same deal, 3 products live
Conventional
25% down · 7.5% · 30yr
- Down + closing
- —
- Monthly P&I
- —
- Monthly cashflow
- —
- DSCR
- —
- Eligible?
- —
Personal DTI + credit; lowest rate.
DSCR
20% down · 8.5% · 30yr
- Down + closing
- —
- Monthly P&I
- —
- Monthly cashflow
- —
- DSCR
- —
- Eligible?
- —
No personal income docs; deal must DSCR.
Hard money
10% down · 12.0% · 12mo
- Down + closing
- —
- Monthly P&I
- —
- Monthly cashflow
- —
- DSCR
- —
- Eligible?
- —
Short-term bridge; refi at stabilization.
Rent comps 40 comps
| Address | Beds | Baths | Sqft | Rent | $/sqft | DOM | Units | Dist |
|---|---|---|---|---|---|---|---|---|
| 9009 Davis St Rowlett, TX | 3.0 | 2.0 | 1916 | $1,945 | $1.02 | 46d | 1 | 0.14mi |
| 9114 Westfield Dr Rowlett, TX | 3.0 | 2.0 | 1458 | $1,995 | $1.37 | 1d | 1 | 0.18mi |
| 6205 Scenic Dr Rowlett, TX | 3.0 | 2.0 | 1916 | $1,995 | $1.04 | 22d | 1 | 0.22mi |
| 8813 Westfield Dr Rowlett, TX | 4.0 | 2.0 | 1781 | $2,500 | $1.40 | 46d | 1 | 0.24mi |
| 9314 Shipman St Rowlett, TX | 3.0 | 2.0 | 1894 | $2,150 | $1.14 | 15d | 1 | 0.24mi |
| 8825 Miami Dr Rowlett, TX | 3.0 | 2.0 | 1633 | $1,855 | $1.14 | 5d | 1 | 0.30mi |
| 8917 Vernon Dr Rowlett, TX | 3.0 | 2.0 | 1568 | $2,095 | $1.34 | 26d | 1 | 0.34mi |
| 8913 Vernon Dr Rowlett, TX | 3.0 | 2.0 | 1791 | $2,150 | $1.20 | 1d | 1 | 0.34mi |
| 8902 Deerwood Dr Rowlett, TX | 3.0 | 2.0 | 1746 | $1,936 | $1.11 | 24d | 1 | 0.43mi |
| 8609 Kensington Dr Rowlett, TX | 3.0 | 2.0 | 2282 | $2,175 | $0.95 | 23d | 1 | 0.47mi |
| 8406 Willowbrook Dr Rowlett, TX | 3.0 | 2.0 | 1865 | $2,400 | $1.29 | 46d | 1 | 0.49mi |
| 8513 Kensington Dr Rowlett, TX | 3.0 | 2.0 | 1830 | $1,800 | $0.98 | 13d | 1 | 0.50mi |
| 5606 Allen Ln Rowlett, TX | 3.0 | 2.0 | 1558 | $2,050 | $1.32 | 46d | 1 | 0.53mi |
| 9306 Chimneywood Dr Rowlett, TX | 3.0 | 2.0 | 1759 | $2,505 | $1.42 | 1d | 1 | 0.55mi |
| 9406 Chimneywood Dr Rowlett, TX | 4.0 | 2.5 | 1731 | $2,475 | $1.43 | 46d | 1 | 0.56mi |
| 8505 Woodside Rd Rowlett, TX | 3.0 | 2.0 | 1709 | $2,200 | $1.29 | 46d | 1 | 0.60mi |
| 8802 Briarwood Dr Rowlett, TX | 4.0 | 2.0 | 1750 | $2,875 | $1.64 | 46d | 1 | 0.61mi |
| 8101 Teal Dr Rowlett, TX | 3.0 | 2.0 | 1769 | $2,500 | $1.41 | 46d | 1 | 0.65mi |
| 8409 Lake Bend Dr Rowlett, TX | 3.0 | 2.0 | 2268 | $2,700 | $1.19 | 21d | 1 | 0.65mi |
| 9701 Terra Lago Ct Rowlett, TX | 3.0 | 1.0–2.0 | 1172 | $2,479 | $2.12 | 0d | 57 | 0.68mi |
| 7913 Salzburg Dr Rowlett, TX | 4.0 | 2.0 | 2201 | $2,500 | $1.14 | 46d | 1 | 0.70mi |
| 8113 Chesham Dr Rowlett, TX | 3.0 | 2.0 | 1664 | $2,195 | $1.32 | 1d | 1 | 0.71mi |
| 6609 Amesbury Ln Rowlett, TX | 4.0 | 3.0 | 2582 | $2,900 | $1.12 | 10d | 1 | 0.74mi |
| 9117 Lakepointe Ave Rowlett, TX | 3.0 | 2.5 | 2152 | $2,999 | $1.39 | 46d | 1 | 0.77mi |
| 8102 Lake Bend Dr Rowlett, TX | 3.0 | 2.0 | 1579 | $2,145 | $1.36 | 46d | 1 | 0.82mi |
| 8014 Amesbury Ln Rowlett, TX | 4.0 | 2.5 | 2279 | $2,650 | $1.16 | 26d | 1 | 0.84mi |
| 8014 Amesbury Ln Rowlett, TX | 4.0 | 2.5 | 2279 | $2,650 | $1.16 | 46d | 1 | 0.84mi |
| 8006 Amesbury Ln Rowlett, TX | 3.0 | 2.0 | 1823 | $2,350 | $1.29 | 46d | 1 | 0.86mi |
| 8805 Bayshore Ln Rowlett, TX | 3.0 | 2.5 | 2148 | $1,600 | $0.74 | 7d | 1 | 0.88mi |
| 4321 Duck Pond Ln Rowlett, TX | 3.0 | 2.5 | 1956 | $2,500 | $1.28 | 46d | 1 | 0.89mi |
| 4322 Duck Pond Ln Rowlett, TX | 4.0 | 3.0 | 2089 | $2,795 | $1.34 | 5d | 1 | 0.89mi |
| 4322 Duck Pond Ln Rowlett, TX | 4.0 | 3.0 | 2100 | $2,950 | $1.40 | 26d | 1 | 0.89mi |
| 8902 Bayshore Ln Rowlett, TX | 4.0 | 2.5 | 1953 | $2,525 | $1.29 | 1d | 1 | 0.90mi |
| 8902 Bayshore Ln Rowlett, TX | 4.0 | 2.5 | 1953 | $2,525 | $1.29 | 26d | 1 | 0.90mi |
| 8405 Greenspoint Dr Rowlett, TX | 3.0 | 2.0 | 2283 | $2,995 | $1.31 | 7d | 1 | 0.92mi |
| 7513 Beverly Dr Rowlett, TX | 3.0 | 2.0 | 1813 | $2,100 | $1.16 | 24d | 1 | 1.01mi |
| 8801 Creekside Dr Rowlett, TX | 3.0 | 2.0 | 2165 | $2,000 | $0.92 | 24d | 1 | 1.03mi |
| 4702 Mariner Dr Rowlett, TX | 4.0 | 2.0 | 2094 | $2,500 | $1.19 | 46d | 1 | 1.07mi |
| 9035 Minnow Mews Rowlett, TX | 1.0–4.0 | 1.0–2.5 | 1232 | $2,453 | $1.99 | 1d | 15 | 1.07mi |
| 7310 Ridgeview Dr Rowlett, TX | 4.0 | 2.0 | 1505 | $2,290 | $1.52 | 46d | 1 | 1.10mi |
Listing history 31 events
-
2026-06-22days on market $254,900 Active 38 DOM
-
2026-06-21days on market $254,900 Active 37 DOM
-
2026-06-18days on market $254,900 Active 34 DOM
-
2026-06-17days on market $254,900 Active 33 DOM
-
2026-06-16days on market $254,900 Active 32 DOM
-
2026-06-15days on market $254,900 Active 31 DOM
-
2026-06-13days on market $254,900 Active 29 DOM
-
2026-06-13days on market $254,900 Active 28 DOM
-
2026-06-09days on market $254,900 Active 25 DOM
-
2026-06-08days on market $254,900 Active 24 DOM
-
2026-06-07days on market $254,900 Active 23 DOM
-
2026-06-04days on market $254,900 Active 20 DOM
-
2026-06-03days on market $254,900 Active 19 DOM
-
2026-06-02days on market $254,900 Active 18 DOM
-
2026-06-01days on market $254,900 Active 17 DOM
-
2026-05-31days on market $254,900 Active 16 DOM
-
2026-05-15$254,900 Active 738-char remark
-
2026-04-23historical
-
2026-03-23price $299,000
-
2026-01-23$319,000 Active
-
2024-10-07$309,000 Active
-
2019-10-21historical
-
2019-10-18soldstatus
-
2019-10-17soldstatus Sold
-
2019-10-15status Pending
-
2019-09-23historical Active Option Contract
-
2019-08-30price $229,900
-
2019-07-29price $235,000
-
2019-07-02$239,999 Active
-
2007-10-04soldstatus
-
2001-03-08soldstatus
ⓘ Source: listings_history table (triggers on properties + properties_extension) + one-shot
backfill from property_details.listing_events for pre-trigger history.
Tax reassessment forecast TX · Resets to sale price
- Current annual tax
- $7,017 · $585/mo
- Projected year-2 tax
- $7,017 · $585/mo
- Expected delta
- $0/yr ($0/mo · 0.0%)
ⓘ Screening estimate from a state-policy table — verify with the county assessor before closing.
Climate risk First Street
- Flood 1/10 Low FEMA zone X (unshaded) · 0% chance over 30 yrs
- Wildfire 1/10 Low
- Heat 7/10 Severe 7 d/yr ≥109°F today · 24 d/yr by 30 yrs out
- Wind 6/10 Major 27% chance of damaging wind over 30 yrs
- Air quality 2/10 Low 2 unhealthy d/yr today · 2 by 30 yrs out
Nearby sold comps map
Loading sold comps map…
Walkable amenities ~0.75 mi
Loading nearby amenities…
Taxation est. · year 1
- Rental income
- $26,844
- − Mortgage interest
- −$14,278
- − Property taxes
- −$7,017
- − Insurance
- −$1,274
- − Repairs & maintenance
- −$2,148
- − Management
- −$2,148
- − Depreciation
- −$7,415
- Taxable loss
- −$7,437
- Est. tax savings @ 24.0%
- +$1,785
- After-tax cash flow
- $-1,341/yr
For passive investors: Depreciation is non-cash, so a rental often shows a tax loss while cash-flowing — sheltering income. Rental losses are passive: they offset passive income freely, and up to $25,000/yr can offset ordinary (W-2) income if you actively participate and your MAGI is under $100k (phasing out to $0 by $150k); unused losses carry forward. On sale, claimed depreciation is recaptured at up to 25%, and gains may owe capital-gains tax (a 1031 exchange can defer both). Figures are a year-1 estimate at your 24.0% rate — not tax advice; consult a CPA.
Schools (NCES district)
- District
- Rockwall ISD
- NCES district ID
- 4837650
- Math proficiency
- 54% ▼ -13.00%
- Reading proficiency
- 54% ▼ -8.00%
- Median HH income
- $88,800
- Composite
- 49.82/100
- National rank
- #1952
- State rank
- #83 of 826 in TX
Livability — Rowlett
- Score
- 75/100
- State rank
- #147
- US rank
- #4150
Category grades
Schools grade is shown separately in the Schools card above.
Census & demographics
- Census place
- Rowlett, TX
- County
- Dallas County · 2,612,404 people
- City population
- 35,619
- Metro
- Dallas-Fort Worth-Arlington, TX
- Population (ZIP)
- 28,075
- Household income
- $105,313
- Rent vs Own
- Severe rent burden
- 626.0
Population outlook (Rockwall County) Hauer SSP2
- Today (2025)
- 118,396 people
- By 2030
- 132,209 · +11.7%
- By 2040
- 159,538 · +34.7%
- By 2050
- 185,299 · +56.5%
- By 2075
- 243,489 · +105.7%
- By 2100
- 277,814 · +134.6%
Race, ethnicity, and origin ACS 2023
- Neighborhood character
- Diverse neighborhood (Simpson 0.62)
- Race & ethnicity
- White 56% Hispanic / Latino 19% Black 18% Two or more races 10% Asian 4%
- Hispanic origin (detail)
- Mexican 15%
- Common ancestry
- Slovak 3% Italian 2% Romanian 2%
- Foreign-born
- 10% · Canada, Vietnam
- Languages at home
- 84% English-only · Spanish 11% Other Indo-European 1% Other Asian/Pacific 1%
Political lean MEDSL · Rockwall
- 2024 margin
- Solid R (+40.9) · D 29.1% · R 70.0%
- 2008→2024 swing
- +5.3pp toward D · 2008: -46.2pp · 2024: -40.9pp
- All cycles
- 2024: R+40.9 2020: R+37.7 2016: R+47.5 2012: R+53.3 2008: R+46.2
Not yet ingested
- Civics
- —
Market trends
- HPI YoY
- ▼ -6.72%
- Current HPI
- 328.27
- Rent YoY
- ▼ -1.22%
- Metro
- Dallas-Fort Worth-Arlington, TX
- State GDP YoY
- ▲ 3.95%
- F500 in state
- 110
Industry mix (Fortune 500 HQ in TX)
| Industry | F500 HQs | Revenue |
|---|---|---|
| Energy | 16 | $1,198B |
|
||
| Technology | 5 | $198B |
|
||
| Engineering / Construction | 4 | $72B |
|
||
| Energy Services | 3 | $60B |
|
||
| Utilities | 3 | $41B |
|
||
| Healthcare | 2 | $330B |
|
||
Price history
+6.2% since first listed15 events — show timeline
- 2026-05-15 Listed $254,900 NTREIS
- 2026-04-23 Listing Removed — NTREIS
- 2026-03-23 Price Changed $299,000 NTREIS
- 2026-01-23 Listed $319,000 NTREIS
- 2024-10-07 Listed $309,000 NTREIS
- 2019-10-21 Listing Removed — NTREIS
- 2019-10-18 Sold (Public Records) — Public Records
- 2019-10-17 Sold (MLS) — NTREIS
- 2019-10-15 Pending — NTREIS
- 2019-09-23 Contingent — NTREIS
- 2019-08-30 Price Changed $229,900 NTREIS
- 2019-07-29 Price Changed $235,000 NTREIS
- 2019-07-02 Listed $239,999 NTREIS
- 2007-10-04 Sold (Public Records) — Public Records
- 2001-03-08 Sold (Public Records) — Public Records
Property tax history
+5.3%/yrLatest (2025): $7,017 · +13.8% YoY. Source: county tax records.
Cash-flow waterfall
monthlySold comps — $/sqft
last 12 mo · ≤1 miLoading sold comps…