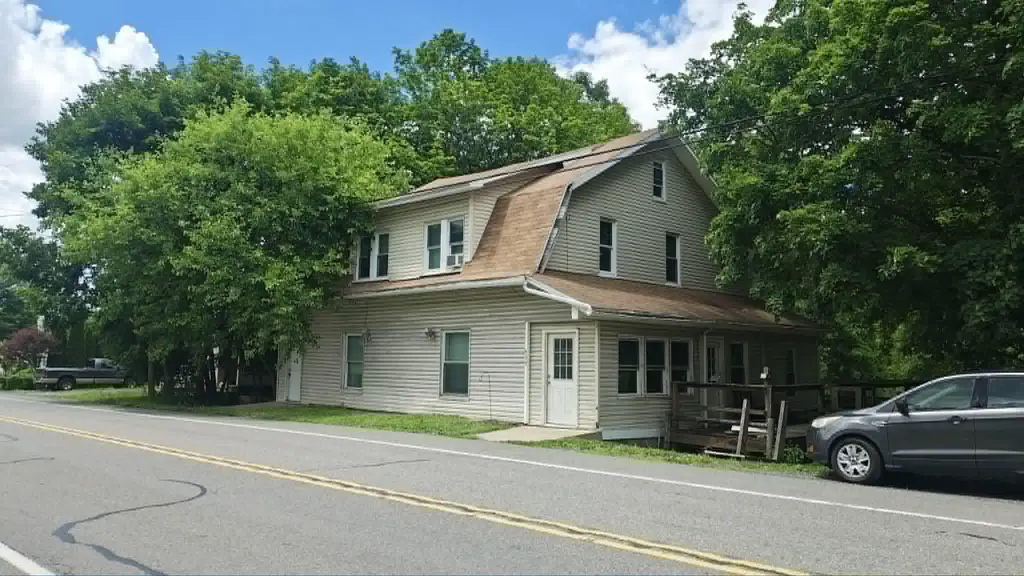
439 Trevorton Rd · Zerbe, PA
Flood risk 1/10 · Minimal
- FEMA flood zone
- X (unshaded)
- Chance of flooding over 30 yrs
- 0.0%
- Est. flood insurance / yr
- $473 – $860
Fire risk 3/10 · Minor
- Est. fire insurance / yr
- $511 – $949
Heat risk 4/10 · Minor
- Hot days now (above 94°F)
- 7 days/yr
- Hot days in 30 yrs
- 16 days/yr
Wind risk 2/10 · Minimal
- Chance of severe wind over 30 yrs
- 3.0%
Air-quality risk 2/10 · Minimal
- Unhealthy air days now
- 1 days/yr
- Unhealthy air days in 30 yrs
- 2 days/yr
Risk factors via First Street. Map © Google.
Why this score? — see what drove the D grade
The composite is a weighted blend of 9 inputs, each scored 0–100. Each bar is that input's sub-score; the figure is the points it added to the 100-point composite (weight × sub-score).
- Cash flow +11.7/30.0
- ARV discount +7.5/15.0
- Appreciation +6.0/10.0
- Schools +3.9/10.0
- DSCR +3.4/10.0
- 1% rule +2.9/10.0
- Rent growth +2.5/5.0
- Livability +2.5/5.0
- Condition / age +2.5/5.0
$179,000
🖨 Deal sheet (PDF) 📄 Offer letter ✓ Due diligence
Listing remarks MLS
Great Home for the price! Check out this unique opportunity – completely remodeled inside, this home will be perfect for the right family! Featuring a charming gambrel roof and two mud rooms, this 3-bedroom, 2-bathroom colonial both is both noteworthy and welcoming. The exterior of the home will need a little extra TLC along the way but has a ton of potential. There is a spacious backyard, which could easily be transformed into a beautiful outdoor sanctuary. Once inside, you’ll be impressed by all the fantastic upgrades this home has to offer. As you meander through, you’ll notice new carpeting, fresh gray paint, and crisp white trim. The roomy kitchen boasts tile flooring, spacious cabinets, white appliances, and sliding glass doors with deck access. Also, one of the home’s bathrooms features a walk-in shower, while another has a tub/shower combo. Could this home be the perfect homeownership opportunity for your family? Don’t wait – reach out to me today to schedule your private tour!
Key facts
- Large back deck
- Convenient access
- 0.25 acre lot
Tags
Property features AI
Finance
- Other: Fee simple ownership; Property condition: good; Pets allowed with no pet restrictions
Exterior
- Parking: Off-street parking for 2 vehicles; Total of 2 garage/parking spaces
- Utilities: Well water; Public sewer; Electric service available; Cable TV available; Phone service available; Municipal trash service
- Home design: Detached property; Estimated year built; Shingle roof; Above-grade finished area approximately 2,500 (estimated); Ground rent paid annually
- Construction: Vinyl siding and block construction; Asphalt (roof material noted under construction); Block and stone foundation; Building not winterized
- Exterior features: Partly wooded lot; Sloping lot; Road frontage; Shed on the property; Not in a federal flood zone
Interior
- Kitchen: Stove; Refrigerator
- Bedrooms: Three bedrooms on the upper level
- Flooring: Carpet; Laminate
- Bathrooms: Two full bathrooms (one on main level, one on upper level)
- Heating & cooling: Electric baseboard heating; Electric hot water
- Interior features: Additional stairway; Attic; Dining area; Traditional floor plan; Eat-in kitchen; Unfinished basement
- Laundry & utility: Laundry on the main floor; Not furnished
Neighborhood map
What this means for you Summary
Snapshot
- This is a 3-bed/2.0-bath other listed at $179k.
Deal economics
- At list price, monthly cash flow is $-53 ($-641/yr) — negative.
- To cash-flow at today's rent, offer at most $170k (5.3% below list).
- To meet the 1% rule (rent ≥ 1% of price), the offer needs to be $142k (20.8% below list).
- Recommended offer: $142k (20.8% below list) — sets the bar for 1% rule.
Location & tenants
- Location reads: area grade D — affects rentability + tenant quality, not the cash-flow math above.
- Line Mountain SD (rural): math 31% / reading 60% proficiency, ranked #266 of 539 in PA (top 49%) — families likely to look elsewhere, expect single-tenant / working-renter base with shorter leases.
- Zoned schools: Line Mountain El Sch (math 37% / reading 57%, grade D-, #737 of 1,518 statewide, top 52%, 368 students, 48% FRL); Line Mountain Ms (math 20% / reading 62%, grade F, #243 of 512 statewide, top 48%, 307 students, 48% FRL); Line Mountain Hs (math 84%, 331 students, 34% FRL).
- Market conditions: 78 active listings in the ZIP; 81 units permitted in Northumberland County in 2024 (0 in 5+ unit buildings).
Forward outlook
- In year one you build about $5k of equity ($1k loan paydown + $3k appreciation (1.9% local appreciation)).
- Northumberland County population projected at -11% by 2050 — secular population decline; favor cash flow + early exit over multi-decade hold.
- At projected returns (1.9% appreciation + 3.0% rent growth), your $50k cash investment doubles in ~9 years — after that, you're playing with house money.
- By year 8, paydown + projected appreciation supports a ~$35k cash-out refi (75% LTV) — recoverable capital for the next deal without selling this one.
Negotiation context
- Only 1 days on market — expect competitive offers; lowballing is unlikely to land.
- 3 sale attempts since 4y ago with the ask held roughly flat each time — persistent listings suggest the price (not the market) is what's stuck; bring a comps-based counter.
- Current owner paid $135k; 33% above their basis — modest negotiation headroom, anchor on the comps not their cost.
Questions for the listing agent
- What do current leases actually rent for vs. the listed asking? Can we see a recent rent roll and the last 12 months of T-12 income?
- Built in 1964 — when were the roof, HVAC, electrical panel, plumbing, and water heater last replaced?
- Is there a deadline driving the sale (1031 exchange, divorce, estate, relocation)? That informs how much negotiation room exists.
- The area grade is low — what's the realistic commute time and amenity access for the typical tenant pool here? Any planned neighborhood developments (good or bad) we should know about?
- What's the average days-on-market for RENTAL listings here right now (not sales)? A rising rental-DOM trend means longer vacancies and softer asking-rent achievability than the comps imply.
- What's the recent tenant-quality profile in this submarket — average credit score on applications, eviction rate, late-payment / NSF rate, and stable-employment percentage? A property-management company in the area should have these aggregated.
- How much new for-sale + rental construction is in the pipeline within 1–3 miles? Heavy new supply typically softens prices + rents 12–24 months out; constrained supply supports both.
Investment metrics
- 1% rule
- 0.79% ✗
- Cap rate
- 5.93%
- Cash-on-cash
- -1.28%
- DSCR
- 0.94
- GRM
- 10.5
CMA / ARV
No comps found within radius.
Projected returns pro-forma
1.9% appreciation · 3.0% rent growth · sell at horizon
- IRR
- 3.0%
- Equity multiple
- 1.16×
- Total profit
- $7,977
- Equity at exit
- $69,672
- IRR
- 6.9%
- Equity multiple
- 1.93×
- Total profit
- $46,402
- Equity at exit
- $99,620
Cash invested: $50,120 (down + closing). Projections, not guarantees.
Landlord ↔ Tenant lean methodology
- Overall (STATE)
- 62 Landlord-Friendly
- State Pennsylvania
- 62 Landlord-Friendly · EVEN
- County
- — inherits STATE
- City
- — inherits STATE
ZIP-level market 17872
- Home prices YoY
- 1.6%
- Active inventory
- 78
- Price-to-rent
- 10.5×
Monthly cashflow live
- Estimated rent
- $1,417 medium interval (Pro) →
- Mortgage (P&I)
- −$939
- Tax from tax record
- −$160 /mo · $1,917/yr
- Insurance
- −$75
- HOA
- −$0
- Vacancy / Maint / Mgmt
- −$298
- Net cashflow
- $-53
Break-even live
Sensitivity live
| Price | -10% $48 | -5% $-3 | +0% $-53 | +5% $-104 | +10% $-155 |
|---|---|---|---|---|---|
| Rent | -10% $-165 | -5% $-109 | +0% $-53 | +5% $3 | +10% $59 |
| Rate | -1.0pp $37 | -0.5pp $-8 | base $-53 | +0.5pp $-100 | +1.0pp $-147 |
UW: 25.0% down · 7.5% · 30yr · 1.5% tax · 5.0% vac · 8.0% maint · 8.0% mgmt
Financing live
Cash to close
- Down payment
- $44,750
- Closing costs
- $5,370
- Reserves months
- —
- Total cash needed
- —
Loan-product check · same deal, 3 products live
Conventional
25% down · 7.5% · 30yr
- Down + closing
- —
- Monthly P&I
- —
- Monthly cashflow
- —
- DSCR
- —
- Eligible?
- —
Personal DTI + credit; lowest rate.
DSCR
20% down · 8.5% · 30yr
- Down + closing
- —
- Monthly P&I
- —
- Monthly cashflow
- —
- DSCR
- —
- Eligible?
- —
No personal income docs; deal must DSCR.
Hard money
10% down · 12.0% · 12mo
- Down + closing
- —
- Monthly P&I
- —
- Monthly cashflow
- —
- DSCR
- —
- Eligible?
- —
Short-term bridge; refi at stabilization.
Listing history 2 events
-
2026-06-21remarks 699-char remark
-
2026-06-21$179,000 Active 1 DOM
ⓘ Source: listings_history table (triggers on properties + properties_extension) + one-shot
backfill from property_details.listing_events for pre-trigger history.
Tax reassessment forecast PA · Partial reset (capped growth)
- Current annual tax
- $1,917 · $160/mo
- Projected year-2 tax
- $2,373 · $198/mo
- Expected delta
- +$455/yr (+$38/mo · 23.8%)
ⓘ Screening estimate from a state-policy table — verify with the county assessor before closing.
Climate risk First Street
- Flood 1/10 Low FEMA zone X (unshaded) · 0% chance over 30 yrs
- Wildfire 3/10 Moderate
- Heat 4/10 Moderate 7 d/yr ≥94°F today · 16 d/yr by 30 yrs out
- Wind 2/10 Low 3% chance of damaging wind over 30 yrs
- Air quality 2/10 Low 1 unhealthy d/yr today · 2 by 30 yrs out
Nearby sold comps map
Loading sold comps map…
Walkable amenities ~0.75 mi
Loading nearby amenities…
Taxation est. · year 1
- Rental income
- $17,007
- − Mortgage interest
- −$10,027
- − Property taxes
- −$1,917
- − Insurance
- −$895
- − Repairs & maintenance
- −$1,361
- − Management
- −$1,361
- − Depreciation
- −$5,207
- Taxable loss
- −$3,761
- Est. tax savings @ 24.0%
- +$903
- After-tax cash flow
- $261/yr
For passive investors: Depreciation is non-cash, so a rental often shows a tax loss while cash-flowing — sheltering income. Rental losses are passive: they offset passive income freely, and up to $25,000/yr can offset ordinary (W-2) income if you actively participate and your MAGI is under $100k (phasing out to $0 by $150k); unused losses carry forward. On sale, claimed depreciation is recaptured at up to 25%, and gains may owe capital-gains tax (a 1031 exchange can defer both). Figures are a year-1 estimate at your 24.0% rate — not tax advice; consult a CPA.
Schools (NCES district)
- District
- Line Mountain SD
- NCES district ID
- 4214460
- Math proficiency
- 31% ▼ -13.00%
- Reading proficiency
- 60% ▼ -8.00%
- Median HH income
- $48,234
- Composite
- 38.77/100
- National rank
- #4122
- State rank
- #266 of 539 in PA
Livability — Zerbe
No livability data for this city. (Only ~50 U.S. cities are tracked.)
Census & demographics
- Census place
- Trevorton, PA
- Population (ZIP)
- 8,950
Population outlook (Northumberland County) Hauer SSP2
- Today (2025)
- 90,896 people
- By 2030
- 89,084 · -2.0%
- By 2040
- 84,822 · -6.7%
- By 2050
- 80,521 · -11.4%
- By 2075
- 72,152 · -20.6%
- By 2100
- 62,257 · -31.5%
Race, ethnicity, and origin ACS 2023
- Neighborhood character
- Predominantly White (84%)
- Race & ethnicity
- White 84% Two or more races 10% Hispanic / Latino 8% Black 1%
- Hispanic origin (detail)
- Puerto Rican 4%
- Common ancestry
- Romanian 14% Iranian 6% Subsaharan African 1%
- Foreign-born
- 1%
- Languages at home
- 96% English-only · Spanish 3%
Political lean MEDSL · Northumberland
- 2024 margin
- Solid R (+39.9) · D 29.6% · R 69.5%
- 2008→2024 swing
- -26.1pp toward R · 2008: -13.8pp · 2024: -39.9pp
- All cycles
- 2024: R+39.9 2020: R+38.5 2016: R+43.6 2012: R+19.4 2008: R+13.8
Not yet ingested
- Civics
- —
Market trends
- HPI YoY
- ▲ 1.90%
- Current HPI
- 124.6288
- Rent YoY
- —
- Metro
- —
- State GDP YoY
- ▲ 1.68%
- F500 in state
- 34
Industry mix (Fortune 500 HQ in PA)
| Industry | F500 HQs | Revenue |
|---|---|---|
| Healthcare | 2 | $309B |
|
||
| Insurance | 2 | $27B |
|
||
| Telecommunications / Media | 1 | $124B |
|
||
| Industrial Distribution | 1 | $22B |
|
||
| Financial Services | 1 | $20B |
|
||
| Chemicals / Materials | 1 | $18B |
|
||
Price history
+191.6% since first listed8 events — show timeline
- 2026-06-20 Listed $179,000 BRIGHT MLS
- 2022-11-14 Sold (Public Records) $134,900 Public Records
- 2022-11-14 Sold (MLS) $134,900 BRIGHT MLS
- 2022-10-03 Pending — BRIGHT MLS
- 2022-10-02 Relisted — BRIGHT MLS
- 2022-09-30 Listing Removed — BRIGHT MLS
- 2022-06-06 Listed $134,900 BRIGHT MLS
- 2014-07-23 Sold (Public Records) $61,380 Public Records
Property tax history
+0.2%/yrLatest (2026): $1,917 · +1.5% YoY. Source: county tax records.
Cash-flow waterfall
monthlySold comps — $/sqft
last 12 mo · ≤1 miLoading sold comps…