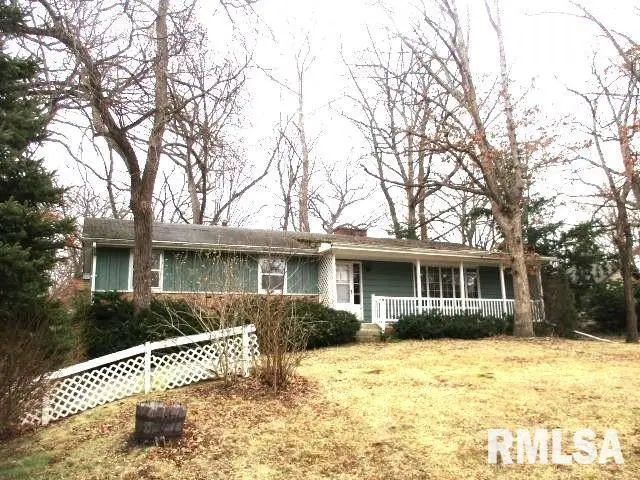
531 E Shady Oaks Dr · Germantown Hills, IL
Flood risk 1/10 · Minimal
- FEMA flood zone
- X (unshaded)
- Chance of flooding over 30 yrs
- 0.0%
- Est. flood insurance / yr
- $507 – $1,088
Fire risk 1/10 · Minimal
- Est. fire insurance / yr
- $804 – $1,492
Heat risk 3/10 · Minor
- Hot days now (above 103°F)
- 7 days/yr
- Hot days in 30 yrs
- 18 days/yr
Wind risk 2/10 · Minimal
- Chance of severe wind over 30 yrs
- 1.0%
Air-quality risk 2/10 · Minimal
- Unhealthy air days now
- 1 days/yr
- Unhealthy air days in 30 yrs
- 1 days/yr
Risk factors via First Street. Map © Google.
Why this score? — see what drove the B grade
The composite is a weighted blend of 9 inputs, each scored 0–100. Each bar is that input's sub-score; the figure is the points it added to the 100-point composite (weight × sub-score).
- Cash flow +28.8/30.0
- DSCR +10.0/10.0
- Appreciation +7.6/10.0
- ARV discount +7.5/15.0
- 1% rule +7.2/10.0
- Schools +4.1/10.0
- Livability +3.9/5.0
- Rent growth +2.5/5.0
- Condition / age +2.5/5.0
$158,000
🖨 Deal sheet 📄 Offer letter ✓ Due diligence
Listing remarks
Eat in kitchen with fireplace and sliding glass doors, 1/2 bath off of kitchen, Large living room with lots of natural light, 3 bedrooms, full bath shared with master bath, full finished basement with fireplace in rec room, 2 stall garage under house. large slopping yard, shed in back yard. Metamora high school and Germantown grade school. Sold As Is.
Key facts
- Eat in kitchen
- Sliding glass doors
- Rec room
Tags
Neighborhood map
What this means for you Summary
Snapshot
- This is a 3-bed/2.5-bath other listed at $158k.
Deal economics
- At list price, monthly cash flow is $533 ($6k/yr) — positive.
- The deal already cash-flows at list — no discount required.
- Meets the 1% rule at list price ($2k rent vs $158k).
- Recommended offer: $156k (1.5% below list) — sets the bar for market timing.
Location & tenants
- Location reads 77/100 on livability (#158 in IL, #2,935 nationally) — a middle-class / working-renter tenant base. Strengths: crime A+, employment A+, housing A+; Watch: amenities F, commute F, health & safety F.
- County Of Woodford School (town): math 47% / reading 44% proficiency, ranked #75 of 620 in IL (top 12%) — families likely to look elsewhere, expect single-tenant / working-renter base with shorter leases.
- Zoned schools: Metamora High School (math 47% / reading 44%, grade D-, #58 of 693 statewide, top 8%, 915 students, 0% FRL).
- Market conditions: 98 active listings in the ZIP; 35 units permitted in Woodford County in 2024 (0 in 5+ unit buildings).
Forward outlook
- In year one you build about $9k of equity ($1k loan paydown + $8k appreciation (5.2% local appreciation)).
- Woodford County population projected to shrink 3% by 2050 — rents likely to lag national; underwrite the cash flow, not the appreciation.
- At projected returns (5.2% appreciation + 3.0% rent growth), your $44k cash investment doubles in ~3 years — after that, you're playing with house money.
- By year 4, paydown + projected appreciation supports a ~$31k cash-out refi (75% LTV) — recoverable capital for the next deal without selling this one.
Negotiation context
- It's been on market 28 days — a 2% lower offer ($156k) is reasonable based on typical stale-listing flexibility.
Questions for the listing agent
- Built in 1967 — when were the roof, HVAC, electrical panel, plumbing, and water heater last replaced?
- Is there a deadline driving the sale (1031 exchange, divorce, estate, relocation)? That informs how much negotiation room exists.
- Schools are A-rated — typically a magnet for longer-tenancy family renters. What's the average tenant stay here, and is there a school-zone premium baked into asking?
- What's the average days-on-market for RENTAL listings here right now (not sales)? A rising rental-DOM trend means longer vacancies and softer asking-rent achievability than the comps imply.
- What's the recent tenant-quality profile in this submarket — average credit score on applications, eviction rate, late-payment / NSF rate, and stable-employment percentage? A property-management company in the area should have these aggregated.
- How much new for-sale + rental construction is in the pipeline within 1–3 miles? Heavy new supply typically softens prices + rents 12–24 months out; constrained supply supports both.
Investment metrics
- 1% rule
- 1.22% ✓
- Cap rate
- 10.34%
- Cash-on-cash
- 14.46%
- DSCR
- 1.64
- GRM
- 6.8
CMA / ARV
No comps found within radius.
Projected returns pro-forma
5.15% appreciation · 3.0% rent growth · sell at horizon
- IRR
- 25.7%
- Equity multiple
- 2.62×
- Total profit
- $71,692
- Equity at exit
- $90,975
- IRR
- 24.7%
- Equity multiple
- 5.22×
- Total profit
- $186,708
- Equity at exit
- $158,214
Cash invested: $44,240 (down + closing). Projections, not guarantees.
Landlord ↔ Tenant lean methodology
- Overall (STATE)
- 43 Moderately Tenant-Leaning
- State Illinois
- 43 Moderately Tenant-Leaning · D+7
- County
- — inherits STATE
- City
- — inherits STATE
ZIP-level market 61548
- Home prices YoY
- 1.5%
- Active inventory
- 98
- Price-to-rent
- 6.8×
Monthly cashflow live
- Estimated rent
- $1,924 medium interval (Pro) →
- Mortgage (P&I)
- −$829
- Tax from tax record
- −$92 /mo · $1,110/yr
- Insurance
- −$66
- HOA
- −$0
- Vacancy / Maint / Mgmt
- −$404
- Net cashflow
- $533
Break-even live
UW: 25.0% down · 7.5% · 30yr · 1.5% tax · 5.0% vac · 8.0% maint · 8.0% mgmt
Financing live
Cash to close
- Down payment
- $39,500
- Closing costs
- $4,740
- Reserves months
- —
- Total cash needed
- —
Loan-product check · same deal, 3 products live
Conventional
25% down · 7.5% · 30yr
- Down + closing
- —
- Monthly P&I
- —
- Monthly cashflow
- —
- DSCR
- —
- Eligible?
- —
Personal DTI + credit; lowest rate.
DSCR
20% down · 8.5% · 30yr
- Down + closing
- —
- Monthly P&I
- —
- Monthly cashflow
- —
- DSCR
- —
- Eligible?
- —
No personal income docs; deal must DSCR.
Hard money
10% down · 12.0% · 12mo
- Down + closing
- —
- Monthly P&I
- —
- Monthly cashflow
- —
- DSCR
- —
- Eligible?
- —
Short-term bridge; refi at stabilization.
Listing history 2 events
-
2026-03-26status Pending
-
2026-02-26$158,000 Active
ⓘ Source: listings_history table (triggers on properties + properties_extension) + one-shot
backfill from property_details.listing_events for pre-trigger history.
Tax reassessment forecast IL · Partial reset (capped growth)
- Current annual tax
- $1,110 · $92/mo
- Projected year-2 tax
- $2,348 · $196/mo
- Expected delta
- +$1,239/yr (+$103/mo · 111.6%)
ⓘ Screening estimate from a state-policy table — verify with the county assessor before closing.
Climate risk First Street
- Flood 1/10 Low FEMA zone X (unshaded) · 0% chance over 30 yrs
- Wildfire 1/10 Low
- Heat 3/10 Moderate 7 d/yr ≥103°F today · 18 d/yr by 30 yrs out
- Wind 2/10 Low 100% chance of damaging wind over 30 yrs
- Air quality 2/10 Low 1 unhealthy d/yr today · 1 by 30 yrs out
Nearby sold comps map
Loading sold comps map…
Walkable amenities ~0.75 mi
Loading nearby amenities…
Taxation est. · year 1
- Rental income
- $23,089
- − Mortgage interest
- −$8,850
- − Property taxes
- −$1,110
- − Insurance
- −$790
- − Repairs & maintenance
- −$1,847
- − Management
- −$1,847
- − Depreciation
- −$4,596
- Taxable income
- $4,049
- Est. tax owed @ 24.0%
- −$972
- After-tax cash flow
- $5,427/yr
For passive investors: Depreciation is non-cash, so a rental often shows a tax loss while cash-flowing — sheltering income. Rental losses are passive: they offset passive income freely, and up to $25,000/yr can offset ordinary (W-2) income if you actively participate and your MAGI is under $100k (phasing out to $0 by $150k); unused losses carry forward. On sale, claimed depreciation is recaptured at up to 25%, and gains may owe capital-gains tax (a 1031 exchange can defer both). Figures are a year-1 estimate at your 24.0% rate — not tax advice; consult a CPA.
Schools (NCES district)
- District
- County Of Woodford School
- NCES district ID
- 1725770
- Math proficiency
- 47% ▼ -5.00%
- Reading proficiency
- 44% ▼ -6.00%
- Median HH income
- $72,248
- Composite
- 41.2/100
- National rank
- #3540
- State rank
- #75 of 620 in IL
Livability — Germantown Hills
- Score
- 77/100
- State rank
- #158
- US rank
- #2935
Category grades
Schools grade is shown separately in the Schools card above.
Census & demographics
- Population (ZIP)
- 12,165
Population outlook (Woodford County) Hauer SSP2
- Today (2025)
- 39,897 people
- By 2030
- 40,038 · +0.4%
- By 2040
- 39,745 · -0.4%
- By 2050
- 38,585 · -3.3%
- By 2075
- 34,769 · -12.9%
- By 2100
- 27,616 · -30.8%
Race, ethnicity, and origin ACS 2023
- Neighborhood character
- Predominantly White (96%)
- Race & ethnicity
- White 96% Two or more races 3% Hispanic / Latino 2%
- Common ancestry
- Romanian 4% Slovak 3% Portuguese 2%
- Foreign-born
- 2% · Canada, South Korea
- Languages at home
- 98% English-only · Spanish 1%
Political lean MEDSL · Woodford
- 2024 margin
- Solid R (+42.0) · D 28.2% · R 70.3% · Other 1.5%
- 2008→2024 swing
- -15.4pp toward R · 2008: -26.6pp · 2024: -42.0pp
- All cycles
- 2024: R+42.0 2020: R+40.2 2016: R+41.8 2012: R+39.2 2008: R+26.6
Not yet ingested
- Civics
- —
Market trends
- HPI YoY
- ▲ 5.15%
- Current HPI
- 345.14
- Rent YoY
- —
- Metro
- —
- State GDP YoY
- ▲ 1.59%
- F500 in state
- 60
Industry mix (Fortune 500 HQ in IL)
| Industry | F500 HQs | Revenue |
|---|---|---|
| Insurance | 4 | $201B |
|
||
| Consumer Goods | 4 | $87B |
|
||
| Industrial Machinery | 3 | $64B |
|
||
| Healthcare | 2 | $55B |
|
||
| Retail / Pharmacy | 1 | $148B |
|
||
| Agriculture / Food | 1 | $86B |
|
||
Price history
2 events — show timeline
- 2026-03-26 Pending — RMLSA as Distributed by MLS Grid
- 2026-02-26 Listed $158,000 RMLSA as Distributed by MLS Grid
Property tax history
+0.5%/yrLatest (2024): $1,110 · +2.1% YoY. Source: county tax records.
Cash-flow waterfall
monthlySold comps — $/sqft
last 12 mo · ≤1 miLoading sold comps…