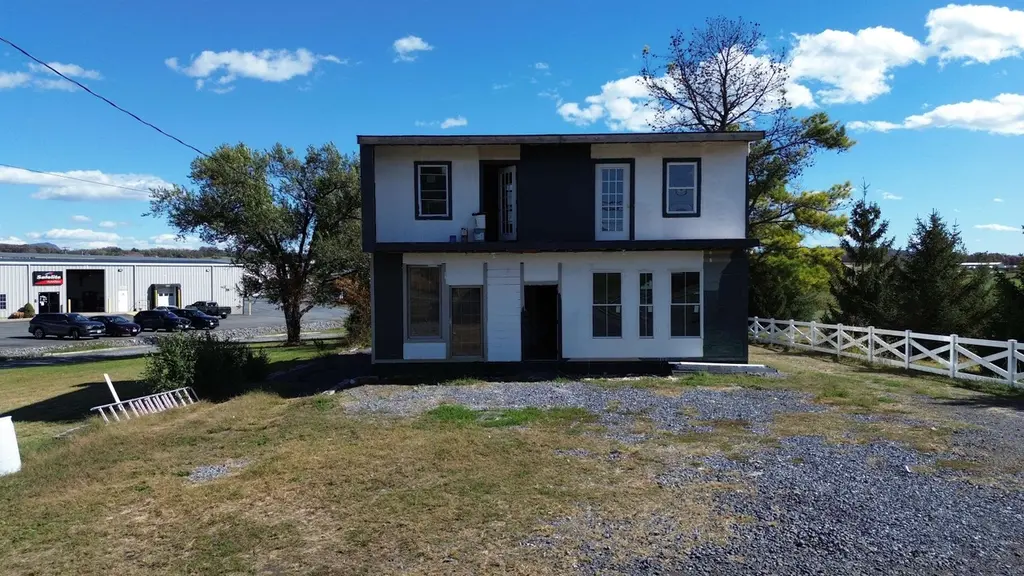
4861 South Valley Pike · Harrisonburg, VA
Flood risk 1/10 · Minimal
- FEMA flood zone
- X (unshaded)
- Chance of flooding over 30 yrs
- 0.0%
- Est. flood insurance / yr
- $473 – $860
Fire risk 1/10 · Minimal
- Est. fire insurance / yr
- $666 – $1,236
Heat risk 5/10 · Moderate
- Hot days now (above 101°F)
- 7 days/yr
- Hot days in 30 yrs
- 18 days/yr
Wind risk 2/10 · Minimal
- Chance of severe wind over 30 yrs
- 1.0%
Air-quality risk 1/10 · Minimal
- Unhealthy air days now
- 0 days/yr
- Unhealthy air days in 30 yrs
- 0 days/yr
Risk factors via First Street. Map © Google.
Why this score? — see what drove the C grade
The composite is a weighted blend of 9 inputs, each scored 0–100. Each bar is that input's sub-score; the figure is the points it added to the 100-point composite (weight × sub-score).
- Cash flow +17.9/30.0
- ARV discount +15.0/15.0
- DSCR +5.6/10.0
- 1% rule +4.8/10.0
- Schools +4.8/10.0
- Livability +4.2/5.0
- Rent growth +4.1/5.0
- Condition / age +2.5/5.0
- Appreciation +0.0/10.0
$250,000
🖨 Deal sheet 📄 Offer letter ✓ Due diligence
Listing remarks
Opportunity knocks on South Valley Pike! This property is a rare find for the savvy investor or dedicated owner-occupant looking to capitalize on an unbeatable commercial location. Zoned B-1 (General Business), this property is ideally situated directly across the street from the Rockingham County Fairgrounds, offering unparalleled visibility and high traffic flow, especially during major events. The existing structure will need a partial overhaul after some fire damage in back of building — consider this a blank slate for your next venture. The B-1 zoning allows for a wide range of retail, service, and professional uses, and potentially a mixed-use scenario (buyer to verify all speci
Key facts
- 0.24 acre lot
- Built 1947
- Listed 44 days
Property features AI
Exterior
- Security: Surveillance system
- Utilities: Cable available; Public water; Public sewer
- Home design: Detached single-family home; Two stories; Above-grade finished and unfinished space plus below-grade unfinished area
- Construction: Stick-built construction; Block foundation
- Exterior features: Cable available; Public water; Public sewer
Interior
- Bathrooms: 1 full bathroom; 1 half bathroom (2 bathrooms total)
- Heating & cooling: Oil heating
- Interior features: Walk-out basement; Surveillance system
Neighborhood map
What this means for you Summary
Snapshot
- This is a 4-bed/1.5-bath other listed at $250k.
Deal economics
- At list price, monthly cash flow is $210 ($3k/yr) — positive.
- The deal already cash-flows at list — no discount required.
- To meet the 1% rule (rent ≥ 1% of price), the offer needs to be $245k (1.9% below list).
- Recommended offer: $242k (3.0% below list) — sets the bar for market timing.
- Cap rate 7.3% vs local median 3.8% in Harrisonburg — top-decile yield for the area; either an underpriced asset or a hidden risk that comps aren't pricing in. Stress-test before assuming the spread holds.
Location & tenants
- Location reads 84/100 on livability (#24 in VA, #666 nationally) — a professional / high-income tenant draw. Strengths: amenities A+, commute A+, health & safety A+; Watch: employment C-.
- Rockingham County Public School District (rural): math 47% / reading 64% proficiency, ranked #77 of 131 in VA (top 59%) — acceptable for families but not a draw, mixed tenant base, ~2y average lease.
- Zoned schools: Pleasant Valley Elementary (math 42% / reading 57%, grade D, #742 of 1,108 statewide, top 70%, 229 students, 66% FRL); Wilbur S. Pence Middle (math 46% / reading 64%, grade B-, #189 of 342 statewide, top 56%, 668 students, 39% FRL); Turner Ashby High (math 78% / reading 82%, grade A, #60 of 319 statewide, top 19%, 994 students, 35% FRL) — zoned schools average 47% FRL vs 32% district-wide (15 pts higher); higher-poverty schools than district average — tighter screening recommended.
- Market conditions: Rents rising fast (+6.5%/yr); 194 active listings in the ZIP; 2 comparable units currently listed for rent nearby; 683 units permitted in Rockingham County in 2024 (0 in 5+ unit buildings).
- This rent runs 41% of the median local income ($72k/yr) — at the standard rent-burdened threshold; future hikes will face affordability resistance.
Forward outlook
- Local home prices are declining (-3.0%/yr); year-one equity from $2k of loan paydown is wiped out by about $8k of value loss. Plan a longer hold.
- Rockingham County population projected at +6% by 2050 — modest demand growth; plan on rents tracking national, not racing it.
Negotiation context
- It's been on market 45 days — a 3% lower offer ($242k) is reasonable based on typical stale-listing flexibility.
- 2 sale attempts with the ask held roughly flat each time — persistent listings suggest the price (not the market) is what's stuck; bring a comps-based counter.
- Current owner paid $55k; list at $250k implies a 355% gain — meaningful room to come down on a strong offer.
Risks & watch-outs
- Watch-outs: built in 1947 — expect roof / HVAC / electrical / plumbing capex.
- Climate carrying-cost: extreme-heat days projected 7→18/yr by 2055 (HVAC capex compounding) — expect insurance premiums to compound above CPI over the hold.
Questions for the listing agent
- It's been on market 45 days. Have you received any prior offers? Is the seller open to a 3% concession, seller financing, or rate buy-down credit?
- Built in 1947 — when were the roof, HVAC, electrical panel, plumbing, and water heater last replaced?
- Is there a deadline driving the sale (1031 exchange, divorce, estate, relocation)? That informs how much negotiation room exists.
- What's the average days-on-market for RENTAL listings here right now (not sales)? A rising rental-DOM trend means longer vacancies and softer asking-rent achievability than the comps imply.
- What's the recent tenant-quality profile in this submarket — average credit score on applications, eviction rate, late-payment / NSF rate, and stable-employment percentage? A property-management company in the area should have these aggregated.
- How much new for-sale + rental construction is in the pipeline within 1–3 miles? Heavy new supply typically softens prices + rents 12–24 months out; constrained supply supports both.
Investment metrics
- 1% rule
- 0.98% ✗
- Cap rate
- 7.30%
- Cash-on-cash
- 3.59%
- DSCR
- 1.16
- GRM
- 8.5
CMA / ARV
- ARV (median comp)
- $367,271
- List price
- $250,000
- Delta
- -31.93%
- Verdict
- UNDERPRICED
- Comps
- 2 within 1.0 mi
Projected returns pro-forma
-3.0% appreciation · 6.48% rent growth · sell at horizon
- IRR
- -6.8%
- Equity multiple
- 0.74×
- Total profit
- $-18,236
- Equity at exit
- $37,276
- IRR
- 6.7%
- Equity multiple
- 1.58×
- Total profit
- $40,637
- Equity at exit
- $21,615
Cash invested: $70,000 (down + closing). Projections, not guarantees.
Landlord ↔ Tenant lean methodology
- Overall (STATE)
- 55 Moderately Landlord-Leaning
- State Virginia
- 55 Moderately Landlord-Leaning · D+2
- County
- — inherits STATE
- City
- — inherits STATE
ZIP-level market 22801
- Rents YoY
- 6.5%
- Active inventory
- 194
- Price-to-rent
- 8.5×
Monthly cashflow live
- Estimated rent
- $2,452 medium interval (Pro) →
- Mortgage (P&I)
- −$1,311
- Tax est. 1.5%
- −$312 /mo · $3,750/yr
- Insurance
- −$104
- HOA
- −$0
- Vacancy / Maint / Mgmt
- −$515
- Net cashflow
- $210
Break-even live
UW: 25.0% down · 7.5% · 30yr · 1.5% tax · 5.0% vac · 8.0% maint · 8.0% mgmt
Financing live
Cash to close
- Down payment
- $62,500
- Closing costs
- $7,500
- Reserves months
- —
- Total cash needed
- —
Loan-product check · same deal, 3 products live
Conventional
25% down · 7.5% · 30yr
- Down + closing
- —
- Monthly P&I
- —
- Monthly cashflow
- —
- DSCR
- —
- Eligible?
- —
Personal DTI + credit; lowest rate.
DSCR
20% down · 8.5% · 30yr
- Down + closing
- —
- Monthly P&I
- —
- Monthly cashflow
- —
- DSCR
- —
- Eligible?
- —
No personal income docs; deal must DSCR.
Hard money
10% down · 12.0% · 12mo
- Down + closing
- —
- Monthly P&I
- —
- Monthly cashflow
- —
- DSCR
- —
- Eligible?
- —
Short-term bridge; refi at stabilization.
Rent comps 2 comps
| Address | Beds | Baths | Sqft | Rent | $/sqft | DOM | Units | Dist |
|---|---|---|---|---|---|---|---|---|
| 3407 Granite Rd , VA | 3.0 | 2.5 | 1220 | $2,250 | $1.84 | 43d | 1 | 1.29mi |
| 3368 Marble LOOP Harrisonburg, VA | 3.0 | 2.5 | 1710 | $1,795 | $1.05 | 43d | 1 | 1.35mi |
Listing history 24 events
-
2026-06-19days on market $250,000 Active 45 DOM
-
2026-06-18days on market $250,000 Active 44 DOM
-
2026-06-17days on market $250,000 Active 43 DOM
-
2026-06-16days on market $250,000 Active 42 DOM
-
2026-06-15days on market $250,000 Active 41 DOM
-
2026-06-14days on market $250,000 Active 39 DOM
-
2026-06-13days on market $250,000 Active 38 DOM
-
2026-06-10days on market $250,000 Active 36 DOM
-
2026-06-09days on market $250,000 Active 35 DOM
-
2026-06-08days on market $250,000 Active 34 DOM
-
2026-06-07days on market $250,000 Active 33 DOM
-
2026-06-05days on market $250,000 Active 30 DOM
-
2026-06-03days on market $250,000 Active 29 DOM
-
2026-06-02days on market $250,000 Active 28 DOM
-
2026-06-01days on market $250,000 Active 27 DOM
-
2026-05-31days on market $250,000 Active 26 DOM
-
2026-05-30days on market $250,000 Active 25 DOM
-
2026-05-04$250,000 Active 1176-char remark
-
2026-05-02historical
-
2026-03-21status Pending
-
2026-03-18price $250,000
-
2026-02-02price $275,000
-
2025-10-23$290,000 Active
-
2021-06-09soldstatus $55,000
ⓘ Source: listings_history table (triggers on properties + properties_extension) + one-shot
backfill from property_details.listing_events for pre-trigger history.
Climate risk First Street
- Flood 1/10 Low FEMA zone X (unshaded) · 0% chance over 30 yrs
- Wildfire 1/10 Low
- Heat 5/10 Major 7 d/yr ≥101°F today · 18 d/yr by 30 yrs out
- Wind 2/10 Low 100% chance of damaging wind over 30 yrs
- Air quality 1/10 Low 0 unhealthy d/yr today · 0 by 30 yrs out
Nearby sold comps map
Loading sold comps map…
Walkable amenities ~0.75 mi
Loading nearby amenities…
Taxation est. · year 1
- Rental income
- $29,428
- − Mortgage interest
- −$14,004
- − Property taxes
- −$3,750
- − Insurance
- −$1,250
- − Repairs & maintenance
- −$2,354
- − Management
- −$2,354
- − Depreciation
- −$7,273
- Taxable loss
- −$1,557
- Est. tax savings @ 24.0%
- +$374
- After-tax cash flow
- $2,889/yr
For passive investors: Depreciation is non-cash, so a rental often shows a tax loss while cash-flowing — sheltering income. Rental losses are passive: they offset passive income freely, and up to $25,000/yr can offset ordinary (W-2) income if you actively participate and your MAGI is under $100k (phasing out to $0 by $150k); unused losses carry forward. On sale, claimed depreciation is recaptured at up to 25%, and gains may owe capital-gains tax (a 1031 exchange can defer both). Figures are a year-1 estimate at your 24.0% rate — not tax advice; consult a CPA.
Schools (NCES district)
- District
- Rockingham County Public School District
- NCES district ID
- 5103390
- Math proficiency
- 47% ▼ -36.00%
- Reading proficiency
- 64% ▼ -12.00%
- Median HH income
- $53,178
- Composite
- 47.58/100
- National rank
- #2264
- State rank
- #77 of 131 in VA
Livability — Harrisonburg
- Score
- 84/100
- State rank
- #24
- US rank
- #666
Category grades
Schools grade is shown separately in the Schools card above.
Census & demographics
- County
- Harrisonburg City · 70,357 people
- City population
- 70,357
- Metro
- Harrisonburg, VA
- Population (ZIP)
- 39,983
- Household income
- $72,067
- Rent vs Own
- Severe rent burden
- 2712.0
Population outlook (Rockingham County) Hauer SSP2
- Today (2025)
- 83,435 people
- By 2030
- 85,223 · +2.1%
- By 2040
- 87,667 · +5.1%
- By 2050
- 88,550 · +6.1%
- By 2075
- 90,331 · +8.3%
- By 2100
- 85,122 · +2.0%
Race, ethnicity, and origin ACS 2023
- Neighborhood character
- Predominantly White (68%)
- Race & ethnicity
- White 68% Hispanic / Latino 18% Two or more races 12% Black 6% Asian 3%
- Hispanic origin (detail)
- Mexican 3% Puerto Rican 4% Dominican 1%
- Common ancestry
- Italian 2% Slovak 2% Romanian 2%
- Foreign-born
- 16% · Canada, South Korea, Vietnam
- Languages at home
- 76% English-only · Spanish 15% Russian/Polish/Slavic 2% Arabic 1%
Political lean MEDSL · Rockingham
- 2024 margin
- Solid R (+37.0) · D 30.9% · R 68.0% · Other 1.1%
- 2008→2024 swing
- -1.0pp toward R · 2008: -36.0pp · 2024: -37.0pp
- All cycles
- 2024: R+37.0 2020: R+40.4 2016: R+43.5 2012: R+40.6 2008: R+36.0
Not yet ingested
- Civics
- —
Market trends
- HPI YoY
- ▼ -222.01%
- Current HPI
- 166.3265
- Rent YoY
- ▲ 6.48%
- Metro
- Harrisonburg, VA
- State GDP YoY
- ▲ 2.40%
- F500 in state
- 50
Industry mix (Fortune 500 HQ in VA)
| Industry | F500 HQs | Revenue |
|---|---|---|
| Aerospace / Defense | 4 | $236B |
|
||
| Technology / Defense | 3 | $32B |
|
||
| Financial Services | 2 | $176B |
|
||
| Utilities | 2 | $27B |
|
||
| Insurance | 2 | $25B |
|
||
| Technology | 2 | $15B |
|
||
Price history
+354.5% since first listed7 events — show timeline
- 2026-05-04 Listed $250,000 HRAR
- 2026-05-02 Delisted — HRAR
- 2026-03-21 Pending — HRAR
- 2026-03-18 Price Changed $250,000 HRAR
- 2026-02-02 Price Changed $275,000 HRAR
- 2025-10-23 Listed $290,000 HRAR
- 2021-06-09 Sold (Public Records) $55,000 Public Records
Property tax history
-10.7%/yrLatest (2025): $322 · -64.9% YoY. Source: county tax records.
Cash-flow waterfall
monthlySold comps — $/sqft
last 12 mo · ≤1 miLoading sold comps…