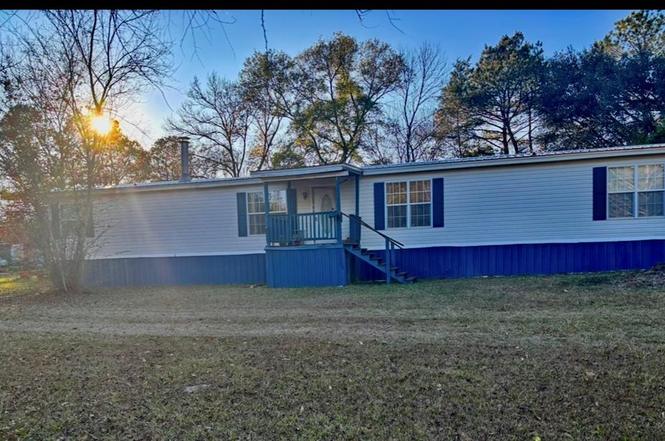
67 Azzie Pitts Rd · Soso, MS
Flood risk 1/10 · Minimal
- FEMA flood zone
- X (unshaded)
- Chance of flooding over 30 yrs
- 0.0%
- Est. flood insurance / yr
- $507 – $1,088
Fire risk 5/10 · Moderate
- Est. fire insurance / yr
- $1,241 – $2,305
Heat risk 7/10 · Major
- Hot days now (above 108°F)
- 7 days/yr
- Hot days in 30 yrs
- 20 days/yr
Wind risk 8/10 · Major
- Chance of severe wind over 30 yrs
- 90.0%
Air-quality risk 1/10 · Minimal
- Unhealthy air days now
- 0 days/yr
- Unhealthy air days in 30 yrs
- 0 days/yr
Risk factors via First Street. Map © Google.
Why this score? — see what drove the D grade
The composite is a weighted blend of 9 inputs, each scored 0–100. Each bar is that input's sub-score; the figure is the points it added to the 100-point composite (weight × sub-score).
- Cash flow +14.8/30.0
- ARV discount +7.5/15.0
- DSCR +4.5/10.0
- 1% rule +4.1/10.0
- Schools +3.3/10.0
- Livability +3.2/5.0
- Rent growth +2.5/5.0
- Condition / age +2.5/5.0
- Appreciation +0.0/10.0
$127,900
🖨 Deal sheet (PDF) 📄 Offer letter ✓ Due diligence
Listing remarks
This mobile home is in excellent condition and has been well taken care of, it has an open for plan and is situated on 3 acres, perfect for entertaining, gardening our other outdoor activities. A short distance from town. . located in a peaceful and quiet area with Rome for farm animals, this has so much more to offer. 3/2 without it ceilings and a large utility room. Please call me for your showing today.
Key facts
- Open floor plan
- 3 acres
- Built 1997
Tags
Neighborhood map
What this means for you Summary
Snapshot
- This is a 3-bed/2.0-bath manufactured listed at $128k.
Deal economics
- At list price, monthly cash flow is $35 ($415/yr) — positive.
- The deal already cash-flows at list — no discount required.
- To meet the 1% rule (rent ≥ 1% of price), the offer needs to be $116k (9.1% below list).
- Recommended offer: $116k (9.1% below list) — sets the bar for 1% rule.
Location & tenants
- Location reads 63/100 on livability (#163 in MS) — a middle-class / working-renter tenant base. Strengths: cost of living A+, housing A+, crime B+; Watch: employment C-, health & safety D, amenities F.
- Jones County School District (rural): math 40% / reading 39% proficiency, ranked #40 of 130 in MS (top 31%) — families likely to look elsewhere, expect single-tenant / working-renter base with shorter leases.
- Zoned schools: West Jones Elementary School (math 32% / reading 45%, grade F, #130 of 375 statewide, top 35%, 1,022 students, 100% FRL); West Jones High School (math 42% / reading 35%, grade F, #56 of 197 statewide, top 29%, 1,516 students, 100% FRL) — zoned schools average 100% FRL vs 59% district-wide (41 pts higher); higher-poverty schools than district average — tighter screening recommended.
- Market conditions: 107 active listings in the ZIP; 23 units permitted in Jones County in 2024 (5 in 5+ unit buildings).
Forward outlook
- Local home prices are declining (-3.0%/yr); year-one equity from $884 of loan paydown is wiped out by about $4k of value loss. Plan a longer hold.
- Jones County population projected to shrink 4% by 2050 — rents likely to lag national; underwrite the cash flow, not the appreciation.
Negotiation context
- It's been on market 105 days — a 9% lower offer ($116k) is reasonable based on typical stale-listing flexibility.
- 4 sale attempts; this cycle's ask has dropped $22k (15%) from the opening price — seller is motivated, your offer sets the floor, not the list.
- Current owner paid $49k; list at $128k implies a 161% gain — meaningful room to come down on a strong offer.
Risks & watch-outs
- Climate carrying-cost: severe wind risk, 90% chance of damaging wind over 30y; moderate wildfire risk; extreme-heat days projected 7→20/yr by 2055 (HVAC capex compounding) — expect insurance premiums to compound above CPI over the hold.
Questions for the listing agent
- It's been on market 105 days. Have you received any prior offers? Is the seller open to a 9% concession, seller financing, or rate buy-down credit?
- Why hasn't it sold? Are there any deal-killer items the seller is aware of (foundation, flood, title, zoning, code violations)?
- Is there a deadline driving the sale (1031 exchange, divorce, estate, relocation)? That informs how much negotiation room exists.
- Schools are F-rated, which usually means shorter tenancies and higher turnover. Who's the typical renter profile here, and what's been the actual vacancy rate?
- The area grade is low — what's the realistic commute time and amenity access for the typical tenant pool here? Any planned neighborhood developments (good or bad) we should know about?
- What's the average days-on-market for RENTAL listings here right now (not sales)? A rising rental-DOM trend means longer vacancies and softer asking-rent achievability than the comps imply.
- What's the recent tenant-quality profile in this submarket — average credit score on applications, eviction rate, late-payment / NSF rate, and stable-employment percentage? A property-management company in the area should have these aggregated.
- How much new for-sale + rental construction is in the pipeline within 1–3 miles? Heavy new supply typically softens prices + rents 12–24 months out; constrained supply supports both.
Investment metrics
- 1% rule
- 0.91% ✗
- Cap rate
- 6.62%
- Cash-on-cash
- 1.16%
- DSCR
- 1.05
- GRM
- 9.2
CMA / ARV
No comps found within radius.
Projected returns pro-forma
-3.0% appreciation · 3.0% rent growth · sell at horizon
- IRR
- -14.4%
- Equity multiple
- 0.48×
- Total profit
- $-18,506
- Equity at exit
- $19,070
- IRR
- -5.7%
- Equity multiple
- 0.63×
- Total profit
- $-13,208
- Equity at exit
- $11,058
Cash invested: $35,812 (down + closing). Projections, not guarantees.
Landlord ↔ Tenant lean methodology
- Overall (STATE)
- 90 Strongly Landlord-Friendly
- State Mississippi
- 90 Strongly Landlord-Friendly · R+11
- County
- — inherits STATE
- City
- — inherits STATE
ZIP-level market 39443
- Active inventory
- 107
- Price-to-rent
- 9.2×
Monthly cashflow live
- Estimated rent
- $1,163 medium interval (Pro) →
- Mortgage (P&I)
- −$671
- Tax est. 1.5%
- −$160 /mo · $1,918/yr
- Insurance
- −$53
- HOA
- −$0
- Vacancy / Maint / Mgmt
- −$244
- Net cashflow
- $35
Break-even live
Sensitivity live
| Price | -10% $123 | -5% $79 | +0% $35 | +5% $-10 | +10% $-54 |
|---|---|---|---|---|---|
| Rent | -10% $-57 | -5% $-11 | +0% $35 | +5% $80 | +10% $126 |
| Rate | -1.0pp $99 | -0.5pp $67 | base $35 | +0.5pp $1 | +1.0pp $-32 |
UW: 25.0% down · 7.5% · 30yr · 1.5% tax · 5.0% vac · 8.0% maint · 8.0% mgmt
Financing live
Cash to close
- Down payment
- $31,975
- Closing costs
- $3,837
- Reserves months
- —
- Total cash needed
- —
Loan-product check · same deal, 3 products live
Conventional
25% down · 7.5% · 30yr
- Down + closing
- —
- Monthly P&I
- —
- Monthly cashflow
- —
- DSCR
- —
- Eligible?
- —
Personal DTI + credit; lowest rate.
DSCR
20% down · 8.5% · 30yr
- Down + closing
- —
- Monthly P&I
- —
- Monthly cashflow
- —
- DSCR
- —
- Eligible?
- —
No personal income docs; deal must DSCR.
Hard money
10% down · 12.0% · 12mo
- Down + closing
- —
- Monthly P&I
- —
- Monthly cashflow
- —
- DSCR
- —
- Eligible?
- —
Short-term bridge; refi at stabilization.
Listing history 14 events
-
2026-04-01status Pending
-
2026-02-24status Active
-
2026-02-08historical Active Under Contract
-
2026-01-22price $127,900
-
2026-01-21price $132,900
-
2026-01-13price $139,900
-
2025-12-17$149,900 Active
-
2025-07-25price $129,800
-
2025-07-01status Active
-
2025-06-09status Pending
-
2025-05-23price $132,400
-
2025-04-30price $137,400
-
2025-03-07$139,900 Active
-
2011-02-08soldstatus $49,000
ⓘ Source: listings_history table (triggers on properties + properties_extension) + one-shot
backfill from property_details.listing_events for pre-trigger history.
Climate risk First Street
- Flood 1/10 Low FEMA zone X (unshaded) · 0% chance over 30 yrs
- Wildfire 5/10 Major
- Heat 7/10 Severe 7 d/yr ≥108°F today · 20 d/yr by 30 yrs out
- Wind 8/10 Severe 90% chance of damaging wind over 30 yrs
- Air quality 1/10 Low 0 unhealthy d/yr today · 0 by 30 yrs out
Nearby sold comps map
Loading sold comps map…
Walkable amenities ~0.75 mi
Loading nearby amenities…
Taxation est. · year 1
- Rental income
- $13,951
- − Mortgage interest
- −$7,164
- − Property taxes
- −$1,918
- − Insurance
- −$640
- − Repairs & maintenance
- −$1,116
- − Management
- −$1,116
- − Depreciation
- −$3,721
- Taxable loss
- −$1,724
- Est. tax savings @ 24.0%
- +$414
- After-tax cash flow
- $829/yr
For passive investors: Depreciation is non-cash, so a rental often shows a tax loss while cash-flowing — sheltering income. Rental losses are passive: they offset passive income freely, and up to $25,000/yr can offset ordinary (W-2) income if you actively participate and your MAGI is under $100k (phasing out to $0 by $150k); unused losses carry forward. On sale, claimed depreciation is recaptured at up to 25%, and gains may owe capital-gains tax (a 1031 exchange can defer both). Figures are a year-1 estimate at your 24.0% rate — not tax advice; consult a CPA.
Schools (NCES district)
- District
- Jones County School District
- NCES district ID
- 2802280
- Math proficiency
- 40% ▼ -11.00%
- Reading proficiency
- 39% ▼ -6.00%
- Median HH income
- $41,051
- Composite
- 33.24/100
- National rank
- #5520
- State rank
- #40 of 130 in MS
Livability — Soso
- Score
- 63/100
- State rank
- #163
- US rank
- #15734
Category grades
Schools grade is shown separately in the Schools card above.
Census & demographics
- Population (ZIP)
- 22,932
Population outlook (Jones County) Hauer SSP2
- Today (2025)
- 68,800 people
- By 2030
- 68,773 · +-0.0%
- By 2040
- 68,087 · -1.0%
- By 2050
- 66,241 · -3.7%
- By 2075
- 58,600 · -14.8%
- By 2100
- 45,744 · -33.5%
Race, ethnicity, and origin ACS 2023
- Neighborhood character
- Predominantly White (82%)
- Race & ethnicity
- White 82% Black 11% Hispanic / Latino 4% Two or more races 4%
- Common ancestry
- Slovak 2% Lithuanian 1% Serbian 1%
- Foreign-born
- 3% · Canada
- Languages at home
- 97% English-only · Spanish 3%
Political lean MEDSL · Jones
- 2024 margin
- Solid R (+46.8) · D 26.2% · R 73.0%
- 2008→2024 swing
- -8.2pp toward R · 2008: -38.6pp · 2024: -46.8pp
- All cycles
- 2024: R+46.8 2020: R+42.2 2016: R+43.6 2012: R+38.2 2008: R+38.6
Not yet ingested
- Civics
- —
Market trends
- HPI YoY
- ▼ -79.24%
- Current HPI
- 131.9011
- Rent YoY
- —
- Metro
- —
- State GDP YoY
- —
- F500 in state
- 0
Price history
+161.0% since first listed14 events — show timeline
- 2026-04-01 Pending — LBOR
- 2026-02-24 Relisted — LBOR
- 2026-02-08 Contingent — LBOR
- 2026-01-22 Price Changed $127,900 LBOR
- 2026-01-21 Price Changed $132,900 LBOR
- 2026-01-13 Price Changed $139,900 LBOR
- 2025-12-17 Listed $149,900 LBOR
- 2025-07-25 Price Changed $129,800 HAAR
- 2025-07-01 Relisted — HAAR
- 2025-06-09 Pending — HAAR
- 2025-05-23 Price Changed $132,400 HAAR
- 2025-04-30 Price Changed $137,400 HAAR
- 2025-03-07 Listed $139,900 HAAR
- 2011-02-08 Sold (Public Records) $49,000 Public Records
Property tax history
-3.2%/yrLatest (2025): $160 · -7.2% YoY. Source: county tax records.
Cash-flow waterfall
monthlySold comps — $/sqft
last 12 mo · ≤1 miLoading sold comps…