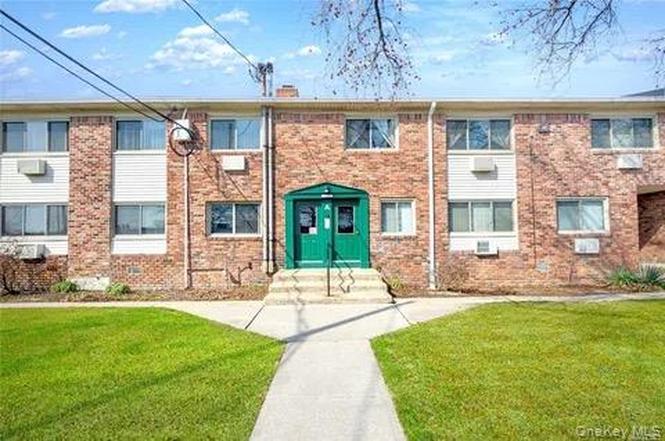
2453 Union Blvd Apt 21B · Islip, NY
Flood risk 4/10 · Minor
- FEMA flood zone
- X (unshaded)
- Chance of flooding over 30 yrs
- 0.23%
- Est. flood insurance / yr
- $507 – $1,088
Fire risk 1/10 · Minimal
- Est. fire insurance / yr
- $691 – $1,283
Heat risk 5/10 · Moderate
- Hot days now (above 93°F)
- 7 days/yr
- Hot days in 30 yrs
- 17 days/yr
Wind risk 6/10 · Moderate
- Chance of severe wind over 30 yrs
- 64.0%
Air-quality risk 4/10 · Minor
- Unhealthy air days now
- 3 days/yr
- Unhealthy air days in 30 yrs
- 5 days/yr
Risk factors via First Street. Map © Google.
Why this score? — see what drove the F grade
The composite is a weighted blend of 9 inputs, each scored 0–100. Each bar is that input's sub-score; the figure is the points it added to the 100-point composite (weight × sub-score).
- ARV discount +7.5/15.0
- 1% rule +5.6/10.0
- Schools +5.5/10.0
- Cash flow +5.1/30.0
- Livability +4.2/5.0
- Rent growth +2.5/5.0
- Condition / age +2.5/5.0
- DSCR +0.0/10.0
- Appreciation +0.0/10.0
$325,000
🖨 Deal sheet 📄 Offer letter ✓ Due diligence
Listing remarks
Make the heart of Islip your home today. Forest Green Community boasts amenities including salt water pool, Clubhouse for private parties, fitness room, and walking paths for your pets. This commuter's dream is a mere minutes to the LIRR (0.8 miles away) for a quick and easy trek to NYC, as well as major highways and parkways. If you are a beach lover, search no more, your weekends can be filled with plenty of sun and fun with quick access to the ferries to Fire Island. Also, the beautiful and family friendly Islip and East Islip Marinas are only a few short miles away. After a day on the Great South Bay, you can enjoy the convenience of Main Street's restaurants, street fairs, shopping, a
Key facts
- Salt water pool
- Fitness room
- Walking paths
Tags
Neighborhood map
What this means for you Summary
Snapshot
- This is a 2-bed/1.0-bath condo listed at $325k.
Deal economics
- At list price, monthly cash flow is $-752 ($-9k/yr) — negative.
- The deal already cash-flows at list — no discount required.
- Meets the 1% rule at list price ($3k rent vs $325k).
- Recommended offer: $315k (3.0% below list) — sets the bar for market timing.
Location & tenants
- Location reads 83/100 on livability (#59 in NY, #878 nationally) — a professional / high-income tenant draw. Strengths: commute A+, employment A+, housing A+; Watch: cost of living F.
- Islip Union Free School District (suburban): math 52% / reading 67% proficiency, ranked #186 of 590 in NY (top 32%) — acceptable for families but not a draw, mixed tenant base, ~2y average lease; only 20% free/reduced lunch — higher-income household profile.
- Zoned schools: Wing Elementary School (379 students, 35% FRL); Islip Middle School (math 32% / reading 52%, grade D-, #379 of 729 statewide, top 54%, 641 students, 37% FRL); Islip High School (math 88% / reading 93%, grade A+, #231 of 1,100 statewide, top 21%, 892 students, 33% FRL) — zoned schools average 35% FRL vs 20% district-wide (15 pts higher); higher-poverty schools than district average — tighter screening recommended.
- Market conditions: 87 active listings in the ZIP; 4 comparable units currently listed for rent nearby; rentals lingering (median 44d on market — plan ~5-8 weeks vacancy on turnover, expect pricing pressure); 75% of comp listings sitting > 30 days — soft ceiling on asking rent; 1,366 units permitted in Suffolk County in 2024 (216 in 5+ unit buildings).
Forward outlook
- Local home prices are declining (-3.0%/yr); year-one equity from $2k of loan paydown is wiped out by about $10k of value loss. Plan a longer hold.
- Suffolk County population projected to shrink 5% by 2050 — rents likely to lag national; underwrite the cash flow, not the appreciation.
Negotiation context
- It's been on market 59 days — a 3% lower offer ($315k) is reasonable based on typical stale-listing flexibility.
- 4 sale attempts since 8y ago with the ask held roughly flat each time — persistent listings suggest the price (not the market) is what's stuck; bring a comps-based counter.
- Current owner paid $160k; list at $325k implies a 103% gain — meaningful room to come down on a strong offer.
Risks & watch-outs
- Watch-outs: HOA is 36% of rent.
- Climate carrying-cost: major wind risk, 64% chance of damaging wind over 30y; extreme-heat days projected 7→17/yr by 2055 (HVAC capex compounding) — expect insurance premiums to compound above CPI over the hold.
Questions for the listing agent
- What do current leases actually rent for vs. the listed asking? Can we see a recent rent roll and the last 12 months of T-12 income?
- It's been on market 59 days. Have you received any prior offers? Is the seller open to a 3% concession, seller financing, or rate buy-down credit?
- Built in 1970 — when were the roof, HVAC, electrical panel, plumbing, and water heater last replaced?
- What does the HOA fee cover, when was the last increase, and are there any pending special assessments or reserve-fund shortfalls?
- Any open or pending special assessments — roof, HVAC, plumbing, elevator, façade? What's the per-unit balance and payoff schedule, and is the seller paying it off at close or rolling it to the buyer?
- Is there a deadline driving the sale (1031 exchange, divorce, estate, relocation)? That informs how much negotiation room exists.
- Schools are B-rated — typically a magnet for longer-tenancy family renters. What's the average tenant stay here, and is there a school-zone premium baked into asking?
- The area grade is low — what's the realistic commute time and amenity access for the typical tenant pool here? Any planned neighborhood developments (good or bad) we should know about?
- What's the average days-on-market for RENTAL listings here right now (not sales)? A rising rental-DOM trend means longer vacancies and softer asking-rent achievability than the comps imply.
- What's the recent tenant-quality profile in this submarket — average credit score on applications, eviction rate, late-payment / NSF rate, and stable-employment percentage? A property-management company in the area should have these aggregated.
- How much new apartment / multifamily construction is in the pipeline within 1–3 miles? Heavy new supply (>2% of stock underway) typically softens rents 12–24 months out; light construction supports rent growth.
Investment metrics
- 1% rule
- 1.06% ✓
- Cap rate
- 3.52%
- Cash-on-cash
- -9.92%
- DSCR
- 0.56
- GRM
- 7.9
CMA / ARV
No comps found within radius.
Projected returns pro-forma
-3.0% appreciation · 3.0% rent growth · sell at horizon
- IRR
- -33.7%
- Equity multiple
- -0.10×
- Total profit
- $-99,775
- Equity at exit
- $48,459
- IRR
- -39.4%
- Equity multiple
- -0.60×
- Total profit
- $-145,313
- Equity at exit
- $28,100
Cash invested: $91,000 (down + closing). Projections, not guarantees.
Landlord ↔ Tenant lean methodology
- Overall (STATE)
- 15 Strongly Tenant-Friendly
- State New York
- 15 Strongly Tenant-Friendly · D+10
- County
- — inherits STATE
- City
- — inherits STATE
ZIP-level market 11751
- Active inventory
- 87
- Price-to-rent
- 7.9×
Monthly cashflow live
- Estimated rent
- $3,441 medium interval (Pro) →
- Mortgage (P&I)
- −$1,704
- Tax est. 1.5%
- −$406 /mo · $4,875/yr
- Insurance
- −$135
- HOA est. from 2 same-building comps
- −$1,225
- Vacancy / Maint / Mgmt
- −$723
- Net cashflow
- $-752
Break-even live
UW: 25.0% down · 7.5% · 30yr · 1.5% tax · 5.0% vac · 8.0% maint · 8.0% mgmt
Financing live
Cash to close
- Down payment
- $81,250
- Closing costs
- $9,750
- Reserves months
- —
- Total cash needed
- —
Loan-product check · same deal, 3 products live
Conventional
25% down · 7.5% · 30yr
- Down + closing
- —
- Monthly P&I
- —
- Monthly cashflow
- —
- DSCR
- —
- Eligible?
- —
Personal DTI + credit; lowest rate.
DSCR
20% down · 8.5% · 30yr
- Down + closing
- —
- Monthly P&I
- —
- Monthly cashflow
- —
- DSCR
- —
- Eligible?
- —
No personal income docs; deal must DSCR.
Hard money
10% down · 12.0% · 12mo
- Down + closing
- —
- Monthly P&I
- —
- Monthly cashflow
- —
- DSCR
- —
- Eligible?
- —
Short-term bridge; refi at stabilization.
Rent comps 4 comps
| Address | Beds | Baths | Sqft | Rent | $/sqft | DOM | Units | Dist |
|---|---|---|---|---|---|---|---|---|
| 584 Main St Unit 5 Islip, NY | 2.0 | 2.0 | 995 | $3,900 | $3.92 | 44d | 1 | 0.49mi |
| 405 E Main St Bay Shore, NY | 2.0 | 1.0–2.0 | 750 | $2,950 | $3.93 | 44d | 1 | 0.74mi |
| 35 Penataquit Ave Bay Shore, NY | 2.0 | 1.0–1.5 | 637 | $3,120 | $4.89 | 1d | 14 | 0.92mi |
| 54 2nd Ave Bay Shore, NY | 2.0 | 1.0 | 1500 | $3,000 | $2.00 | 44d | 1 | 1.45mi |
HOA detail condo
- Monthly dues
- $0 · $0/yr
- Likely covers
- waterpool
- Assessments
- None detected in remarks — confirm with the listing agent.
Listing history 9 events
-
2026-03-23status Pending
-
2026-01-19$325,000 Active
-
2024-10-31historical
-
2024-06-27$290,000 Active
-
2020-09-28historical
-
2020-08-24$190,000 Active
-
2018-05-18soldstatus $160,450 Closed
-
2018-02-06status Under Contract
-
2018-01-10$164,990 New
ⓘ Source: listings_history table (triggers on properties + properties_extension) + one-shot
backfill from property_details.listing_events for pre-trigger history.
Climate risk First Street
- Flood 4/10 Moderate FEMA zone X (unshaded) · 23% chance over 30 yrs
- Wildfire 1/10 Low
- Heat 5/10 Major 7 d/yr ≥93°F today · 17 d/yr by 30 yrs out
- Wind 6/10 Major 64% chance of damaging wind over 30 yrs
- Air quality 4/10 Moderate 3 unhealthy d/yr today · 5 by 30 yrs out
Nearby sold comps map
Loading sold comps map…
Walkable amenities ~0.75 mi
Loading nearby amenities…
Taxation est. · year 1
- Rental income
- $41,296
- − Mortgage interest
- −$18,205
- − Property taxes
- −$4,875
- − Insurance
- −$1,625
- − Repairs & maintenance
- −$3,304
- − Management
- −$3,304
- − HOA
- −$14,700
- − Depreciation
- −$9,455
- Taxable loss
- −$14,171
- Est. tax savings @ 24.0%
- +$3,401
- After-tax cash flow
- $-5,627/yr
For passive investors: Depreciation is non-cash, so a rental often shows a tax loss while cash-flowing — sheltering income. Rental losses are passive: they offset passive income freely, and up to $25,000/yr can offset ordinary (W-2) income if you actively participate and your MAGI is under $100k (phasing out to $0 by $150k); unused losses carry forward. On sale, claimed depreciation is recaptured at up to 25%, and gains may owe capital-gains tax (a 1031 exchange can defer both). Figures are a year-1 estimate at your 24.0% rate — not tax advice; consult a CPA.
Schools (NCES district)
- District
- Islip Union Free School District
- NCES district ID
- 3615540
- Math proficiency
- 52% ▼ -7.00%
- Reading proficiency
- 67% ▲ 10.00%
- Median HH income
- $92,825
- Composite
- 54.7/100
- National rank
- #1325
- State rank
- #186 of 590 in NY
Livability — Islip
- Score
- 83/100
- State rank
- #59
- US rank
- #878
Category grades
Schools grade is shown separately in the Schools card above.
Census & demographics
- Census place
- Islip, NY
- City population
- 13,152
- Population (ZIP)
- 13,152
Population outlook (Suffolk County) Hauer SSP2
- Today (2025)
- 1,505,262 people
- By 2030
- 1,498,318 · -0.5%
- By 2040
- 1,471,101 · -2.3%
- By 2050
- 1,424,848 · -5.3%
- By 2075
- 1,337,157 · -11.2%
- By 2100
- 1,217,720 · -19.1%
Race, ethnicity, and origin ACS 2023
- Neighborhood character
- Predominantly White (75%)
- Race & ethnicity
- White 75% Hispanic / Latino 15% Two or more races 9% Asian 5% Black 3%
- Hispanic origin (detail)
- Puerto Rican 7%
- Common ancestry
- Romanian 2% Lithuanian 1% Italian 1%
- Foreign-born
- 8% · Canada, China, Jamaica
- Languages at home
- 89% English-only · Spanish 6% Other Indo-European 2% Chinese 1%
Political lean MEDSL · Suffolk
- 2024 margin
- Lean R (+10.0) · D 45.0% · R 55.0%
- 2008→2024 swing
- -16.0pp toward R · 2008: 6.0pp · 2024: -10.0pp
- All cycles
- 2024: R+10.0 2020: R+0.0 2016: R+8.2 2012: D+2.9 2008: D+6.0
Not yet ingested
- Civics
- —
Market trends
- HPI YoY
- ▼ -368.19%
- Current HPI
- 288.0267
- Rent YoY
- —
- Metro
- —
- State GDP YoY
- ▲ 2.60%
- F500 in state
- 92
Industry mix (Fortune 500 HQ in NY)
| Industry | F500 HQs | Revenue |
|---|---|---|
| Financial Services | 10 | $950B |
|
||
| Consumer Goods | 9 | $162B |
|
||
| Insurance | 4 | $225B |
|
||
| Telecommunications | 2 | $144B |
|
||
| Pharmaceuticals | 2 | $112B |
|
||
| Media / Entertainment | 2 | $69B |
|
||
Price history
+97.0% since first listed9 events — show timeline
- 2026-03-23 Pending — OneKey® MLS as Distributed by MLS Grid
- 2026-01-19 Listed $325,000 OneKey® MLS as Distributed by MLS Grid
- 2024-10-31 Listing Removed — OneKey® MLS as Distributed by MLS Grid
- 2024-06-27 Listed $290,000 OneKey® MLS as Distributed by MLS Grid
- 2020-09-28 Listing Removed — OneKey® MLS as Distributed by MLS Grid
- 2020-08-24 Listed $190,000 OneKey® MLS as Distributed by MLS Grid
- 2018-05-18 Sold (MLS) $160,450 OneKey® MLS as Distributed by MLS Grid
- 2018-02-06 Pending — OneKey® MLS as Distributed by MLS Grid
- 2018-01-10 Listed $164,990 OneKey® MLS as Distributed by MLS Grid
Cash-flow waterfall
monthlySold comps — $/sqft
last 12 mo · ≤1 miLoading sold comps…