854 E 900 N · Mays, IN
Flood risk 1/10 · Minimal
- FEMA flood zone
- X (unshaded)
- Chance of flooding over 30 yrs
- 0.0%
- Est. flood insurance / yr
- $473 – $860
Fire risk 1/10 · Minimal
- Est. fire insurance / yr
- $717 – $1,331
Heat risk 3/10 · Minor
- Hot days now (above 99°F)
- 7 days/yr
- Hot days in 30 yrs
- 19 days/yr
Wind risk 2/10 · Minimal
- Chance of severe wind over 30 yrs
- 1.0%
Air-quality risk 2/10 · Minimal
- Unhealthy air days now
- 1 days/yr
- Unhealthy air days in 30 yrs
- 2 days/yr
Risk factors via First Street. Map © Google.
Why this score? — see what drove the B grade
The composite is a weighted blend of 9 inputs, each scored 0–100. Each bar is that input's sub-score; the figure is the points it added to the 100-point composite (weight × sub-score).
- Cash flow +30.0/30.0
- 1% rule +10.0/10.0
- DSCR +10.0/10.0
- ARV discount +7.5/15.0
- Appreciation +5.0/10.0
- Schools +3.4/10.0
- Rent growth +2.5/5.0
- Livability +2.5/5.0
- Condition / age +2.5/5.0
$64,500
🖨 Deal sheet 📄 Offer letter ✓ Due diligence
Listing remarks MLS
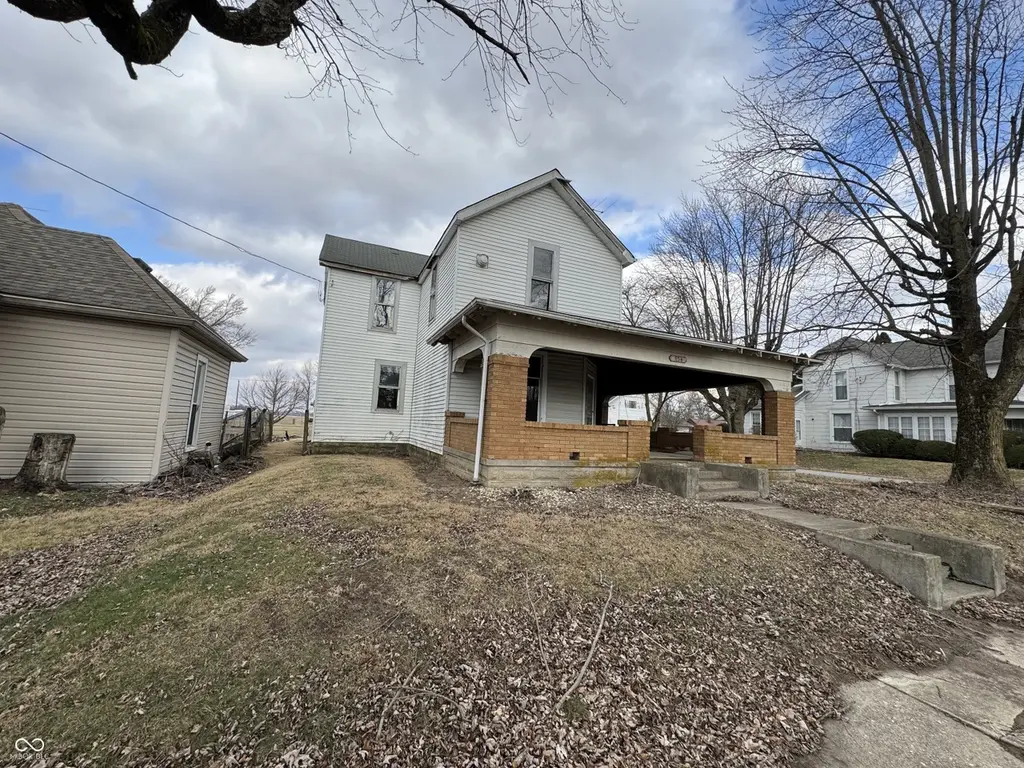
Opportunity awaits in this spacious 4-bedroom, 1.5-bath home built in 1900, full of character and potential. Situated on a corner lot, this property offers generously sized rooms and a layout ready for restoration or renovation to match your vision. The home features a two-car garage and wraparound porch, providing flexibility for future improvements. Located near Mays Academy, a well-regarded elementary school, this property is ideal for investors or buyers looking to bring new life to a classic home. With solid bones and a prime location, this is your chance to create something truly special.
Key facts
- Wraparound porch
- Two-car garage
- Corner lot
Tags
Neighborhood map
What this means for you Summary
Snapshot
- This is a 4-bed/1.5-bath single-family listed at $64k.
Deal economics
- At list price, monthly cash flow is $1k ($12k/yr) — positive.
- The deal already cash-flows at list — no discount required.
- Meets the 1% rule at list price ($2k rent vs $64k).
- Recommended offer: $57k (12.0% below list) — sets the bar for market timing.
Location & tenants
- Location reads: area grade B — affects rentability + tenant quality, not the cash-flow math above.
- Rush County Schools (town): math 38% / reading 41% proficiency, ranked #147 of 301 in IN (top 49%) — families likely to look elsewhere, expect single-tenant / working-renter base with shorter leases.
- Market conditions: 3 active listings in the ZIP; 1 comparable units currently listed for rent nearby; 59 units permitted in Rush County in 2024 (40 in 5+ unit buildings).
Forward outlook
- In year one you build about $2k of equity ($446 loan paydown + $2k appreciation (3.0% local appreciation)).
- Rush County population projected at -22% by 2050 — secular population decline; favor cash flow + early exit over multi-decade hold.
- At projected returns (3.0% appreciation + 3.0% rent growth), your $18k cash investment doubles in ~2 years — after that, you're playing with house money.
Negotiation context
- It's been on market 147 days — a 12% lower offer ($57k) is reasonable based on typical stale-listing flexibility.
- 2 sale attempts since 17y ago; this cycle's ask has dropped $5k (7%) from the opening price — seller is motivated, your offer sets the floor, not the list.
- Current owner paid $15k; list at $64k implies a 342% gain — meaningful room to come down on a strong offer.
Risks & watch-outs
- Watch-outs: built in 1900 — expect roof / HVAC / electrical / plumbing capex.
Questions for the listing agent
- It's been on market 147 days. Have you received any prior offers? Is the seller open to a 12% concession, seller financing, or rate buy-down credit?
- Built in 1900 — when were the roof, HVAC, electrical panel, plumbing, and water heater last replaced?
- Why hasn't it sold? Are there any deal-killer items the seller is aware of (foundation, flood, title, zoning, code violations)?
- Is there a deadline driving the sale (1031 exchange, divorce, estate, relocation)? That informs how much negotiation room exists.
- What's the average days-on-market for RENTAL listings here right now (not sales)? A rising rental-DOM trend means longer vacancies and softer asking-rent achievability than the comps imply.
- What's the recent tenant-quality profile in this submarket — average credit score on applications, eviction rate, late-payment / NSF rate, and stable-employment percentage? A property-management company in the area should have these aggregated.
- How much new for-sale + rental construction is in the pipeline within 1–3 miles? Heavy new supply typically softens prices + rents 12–24 months out; constrained supply supports both.
Investment metrics
- 1% rule
- 2.79% ✓
- Cap rate
- 25.18%
- Cash-on-cash
- 67.47%
- DSCR
- 4.00
- GRM
- 3.0
CMA / ARV
- ARV (median comp)
- $425,954
- List price
- $64,500
- Delta
- -84.86%
- Verdict
- UNDERPRICED
- Comps
- 3 within 2.0 mi
Projected returns pro-forma
3.0% appreciation · 3.0% rent growth · sell at horizon
- IRR
- 72.2%
- Equity multiple
- 5.01×
- Total profit
- $72,442
- Equity at exit
- $29,002
- IRR
- 71.7%
- Equity multiple
- 10.26×
- Total profit
- $167,270
- Equity at exit
- $44,696
Cash invested: $18,060 (down + closing). Projections, not guarantees.
Landlord ↔ Tenant lean methodology
- Overall (STATE)
- 90 Strongly Landlord-Friendly
- State Indiana
- 90 Strongly Landlord-Friendly · R+11
- County
- — inherits STATE
- City
- — inherits STATE
ZIP-level market 46155
- Active inventory
- 3
- Price-to-rent
- 3.0×
Monthly cashflow live
- Estimated rent
- $1,800 medium interval (Pro) →
- Mortgage (P&I)
- −$338
- Tax from tax record
- −$42 /mo · $498/yr
- Insurance
- −$27
- HOA
- −$0
- Vacancy / Maint / Mgmt
- −$378
- Net cashflow
- $1,015
Break-even live
UW: 25.0% down · 7.5% · 30yr · 1.5% tax · 5.0% vac · 8.0% maint · 8.0% mgmt
Financing live
Cash to close
- Down payment
- $16,125
- Closing costs
- $1,935
- Reserves months
- —
- Total cash needed
- —
Loan-product check · same deal, 3 products live
Conventional
25% down · 7.5% · 30yr
- Down + closing
- —
- Monthly P&I
- —
- Monthly cashflow
- —
- DSCR
- —
- Eligible?
- —
Personal DTI + credit; lowest rate.
DSCR
20% down · 8.5% · 30yr
- Down + closing
- —
- Monthly P&I
- —
- Monthly cashflow
- —
- DSCR
- —
- Eligible?
- —
No personal income docs; deal must DSCR.
Hard money
10% down · 12.0% · 12mo
- Down + closing
- —
- Monthly P&I
- —
- Monthly cashflow
- —
- DSCR
- —
- Eligible?
- —
Short-term bridge; refi at stabilization.
Rent comps 1 comps
| Address | Beds | Baths | Sqft | Rent | $/sqft | DOM | Units | Dist |
|---|---|---|---|---|---|---|---|---|
| 10201 N 150 E Lewisville, IN | 3.0 | 2.0 | 2160 | $1,800 | $0.83 | 3d | 1 | 1.20mi |
Listing history 20 events
-
2026-06-18days on market $64,500 Active 147 DOM
-
2026-06-17days on market $64,500 Active 146 DOM
-
2026-06-16days on market $64,500 Active 145 DOM
-
2026-06-15days on market $64,500 Active 144 DOM
-
2026-06-13days on market $64,500 Active 142 DOM
-
2026-06-13days on market $64,500 Active 141 DOM
-
2026-06-09days on market $64,500 Active 138 DOM
-
2026-06-08days on market $64,500 Active 137 DOM
-
2026-06-07days on market $64,500 Active 136 DOM
-
2026-06-05days on market $64,500 Active 133 DOM
-
2026-06-03days on market $64,500 Active 132 DOM
-
2026-06-02days on market $64,500 Active 131 DOM
-
2026-06-02remarks 651-char remark
-
2026-06-01days on market $64,500 Active 130 DOM
-
2026-05-31days on market $64,500 Active 129 DOM
-
2026-04-13price $64,500 601-char remark
Show marketing remark (601 chars)
Opportunity awaits in this spacious 4-bedroom, 1.5-bath home built in 1900, full of character and potential. Situated on a corner lot, this property offers generously sized rooms and a layout ready for restoration or renovation to match your vision. The home features a two-car garage and wraparound porch, providing flexibility for future improvements. Located near Mays Academy, a well-regarded elementary school, this property is ideal for investors or buyers looking to bring new life to a classic home. With solid bones and a prime location, this is your chance to create something truly special.
-
2026-01-22$69,500 Active 601-char remark
Show marketing remark (601 chars)
Opportunity awaits in this spacious 4-bedroom, 1.5-bath home built in 1900, full of character and potential. Situated on a corner lot, this property offers generously sized rooms and a layout ready for restoration or renovation to match your vision. The home features a two-car garage and wraparound porch, providing flexibility for future improvements. Located near Mays Academy, a well-regarded elementary school, this property is ideal for investors or buyers looking to bring new life to a classic home. With solid bones and a prime location, this is your chance to create something truly special.
-
2011-05-05soldstatus $14,600
-
2010-12-09historical
-
2009-09-09$25,000
ⓘ Source: listings_history table (triggers on properties + properties_extension) + one-shot
backfill from property_details.listing_events for pre-trigger history.
Tax reassessment forecast IN · Partial reset (capped growth)
- Current annual tax
- $498 · $42/mo
- Projected year-2 tax
- $523 · $44/mo
- Expected delta
- +$25/yr (+$2/mo · 5.0%)
ⓘ Screening estimate from a state-policy table — verify with the county assessor before closing.
Climate risk First Street
- Flood 1/10 Low FEMA zone X (unshaded) · 0% chance over 30 yrs
- Wildfire 1/10 Low
- Heat 3/10 Moderate 7 d/yr ≥99°F today · 19 d/yr by 30 yrs out
- Wind 2/10 Low 100% chance of damaging wind over 30 yrs
- Air quality 2/10 Low 1 unhealthy d/yr today · 2 by 30 yrs out
Nearby sold comps map
Loading sold comps map…
Walkable amenities ~0.75 mi
Loading nearby amenities…
Taxation est. · year 1
- Rental income
- $21,600
- − Mortgage interest
- −$3,613
- − Property taxes
- −$498
- − Insurance
- −$322
- − Repairs & maintenance
- −$1,728
- − Management
- −$1,728
- − Depreciation
- −$1,876
- Taxable income
- $11,834
- Est. tax owed @ 24.0%
- −$2,840
- After-tax cash flow
- $9,344/yr
For passive investors: Depreciation is non-cash, so a rental often shows a tax loss while cash-flowing — sheltering income. Rental losses are passive: they offset passive income freely, and up to $25,000/yr can offset ordinary (W-2) income if you actively participate and your MAGI is under $100k (phasing out to $0 by $150k); unused losses carry forward. On sale, claimed depreciation is recaptured at up to 25%, and gains may owe capital-gains tax (a 1031 exchange can defer both). Figures are a year-1 estimate at your 24.0% rate — not tax advice; consult a CPA.
Schools (NCES district)
- District
- Rush County Schools
- NCES district ID
- 1809750
- Math proficiency
- 38% ▼ -14.00%
- Reading proficiency
- 41% ▼ -14.00%
- Median HH income
- $46,237
- Composite
- 33.72/100
- National rank
- #5377
- State rank
- #147 of 301 in IN
Livability — Mays
No livability data for this city. (Only ~50 U.S. cities are tracked.)
Census & demographics
- Census place
- Mays, IN
- City population
- 71
- Population (ZIP)
- 71
Population outlook (Rush County) Hauer SSP2
- Today (2025)
- 15,654 people
- By 2030
- 15,036 · -3.9%
- By 2040
- 13,674 · -12.6%
- By 2050
- 12,239 · -21.8%
- By 2075
- 9,466 · -39.5%
- By 2100
- 7,104 · -54.6%
Race, ethnicity, and origin ACS 2023
- Neighborhood character
- Predominantly White (100%)
- Race & ethnicity
- White 100%
- Common ancestry
- Portuguese 15%
Political lean MEDSL · Rush
- 2024 margin
- Solid R (+54.0) · D 21.9% · R 75.9% · Other 2.2%
- 2008→2024 swing
- -40.4pp toward R · 2008: -13.7pp · 2024: -54.0pp
- All cycles
- 2024: R+54.0 2020: R+54.0 2016: R+52.2 2012: R+34.3 2008: R+13.7
Not yet ingested
- Civics
- —
Market trends
- HPI YoY
- —
- Current HPI
- —
- Rent YoY
- —
- Metro
- —
- State GDP YoY
- ▲ 2.90%
- F500 in state
- 18
Industry mix (Fortune 500 HQ in IN)
| Industry | F500 HQs | Revenue |
|---|---|---|
| Industrial Machinery | 2 | $37B |
|
||
| Healthcare | 1 | $177B |
|
||
| Pharmaceuticals | 1 | $45B |
|
||
| Metals / Steel | 1 | $18B |
|
||
| Agriculture | 1 | $17B |
|
||
| Packaging | 1 | $12B |
|
||
Price history
+158.0% since first listed5 events — show timeline
- 2026-04-13 Price Changed $64,500 MIBOR as Distributed by MLS Grid
- 2026-01-22 Listed $69,500 MIBOR as Distributed by MLS Grid
- 2011-05-05 Sold (Public Records) $14,600 Public Records
- 2010-12-09 Listing Removed — MIBOR as Distributed by MLS Grid
- 2009-09-09 Listed $25,000 MIBOR as Distributed by MLS Grid
Property tax history
+6.1%/yrLatest (2024): $498 · -1.7% YoY. Source: county tax records.
Cash-flow waterfall
monthlySold comps — $/sqft
last 12 mo · ≤1 miLoading sold comps…