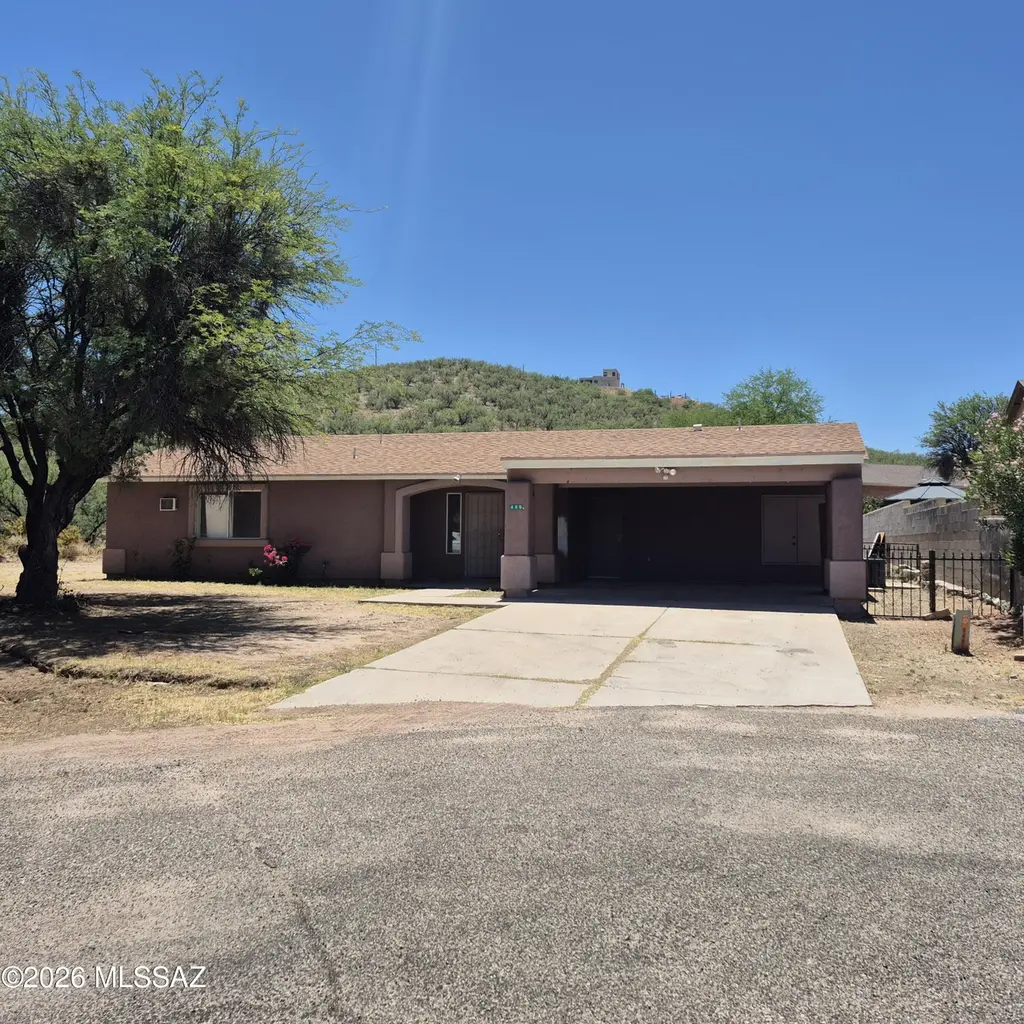
489 Alondra Ct · Rio Rico, AZ
Flood risk 6/10 · Moderate
- FEMA flood zone
- X (unshaded)
- Chance of flooding over 30 yrs
- 0.74%
- Est. flood insurance / yr
- $507 – $1,088
Fire risk 7/10 · Major
- Est. fire insurance / yr
- $610 – $1,132
Heat risk 7/10 · Major
- Hot days now (above 100°F)
- 7 days/yr
- Hot days in 30 yrs
- 21 days/yr
Wind risk 1/10 · Minimal
- Chance of severe wind over 30 yrs
- —
Air-quality risk 1/10 · Minimal
- Unhealthy air days now
- 0 days/yr
- Unhealthy air days in 30 yrs
- 0 days/yr
Risk factors via First Street. Map © Google.
Why this score? — see what drove the D- grade
The composite is a weighted blend of 9 inputs, each scored 0–100. Each bar is that input's sub-score; the figure is the points it added to the 100-point composite (weight × sub-score).
- Appreciation +10.0/10.0
- Cash flow +9.0/30.0
- ARV discount +4.3/15.0
- Livability +3.2/5.0
- DSCR +2.5/10.0
- Rent growth +2.5/5.0
- Condition / age +2.5/5.0
- Schools +1.7/10.0
- 1% rule +1.6/10.0
$229,000
🖨 Deal sheet (PDF) 📄 Offer letter ✓ Due diligence
Listing remarks MLS
Welcome to this inviting 3-bedroom, 2-bath home with a 2-car garage in Rio Rico, offering comfort, space, and everyday convenience in a peaceful setting. The functional layout provides practical living areas ready for your personal touch, while the location places you close to local parks, schools, shopping, and dining, with easy access to I-19 for commuting to Nogales or Tucson. A great opportunity to own a home with room to grow in a well-connected Southern Arizona community. To make an offer or for more information, visit MyNextBid.com
Key facts
- 0.35 acre lot
- 2 parking spots
- Built 1998
Property features AI
Finance
- Other: Lot is approximately 15,246 square feet with irregular dimensions; Zoned SCC - B-1
- HOA & community: Community features include paved streets, sidewalks, and walking trails
Exterior
- Parking: Covered parking for 2 vehicles; 2 carport spaces; Circular driveway
- Utilities: Water provided by a water company; Sewer connected; Electric-powered heating (heat pump)
- Home design: Single family residence; One story; Accessible (door levers, level access)
- Construction: Frame construction with stucco; Shingle roof; Built with frame/stucco materials
- Exterior features: Cul-de-sac lot; Paved road access; County-maintained road; Paved street, sidewalks, and walking trail nearby
Interior
- Kitchen: Electric range
- Flooring: Ceramic tile; Laminate
- Bathrooms: 2 full bathrooms
- Heating & cooling: Heat pump (electric); Central air; Wall unit(s); Ceiling fans
- Interior features: Electric range; Laundry closet; Door levers and level-access features
- Laundry & utility: Laundry closet
Neighborhood map
What this means for you Summary
Snapshot
- This is a 3-bed/2.0-bath single-family listed at $229k.
Deal economics
- At list price, monthly cash flow is $-181 ($-2k/yr) — negative.
- To cash-flow at today's rent, offer at most $197k (14.0% below list).
- To meet the 1% rule (rent ≥ 1% of price), the offer needs to be $151k (34.1% below list).
- Recommended offer: $151k (34.1% below list) — sets the bar for 1% rule.
- Cap rate 5.3% vs local median 4.1% in Rio Rico — top-decile yield for the area; either an underpriced asset or a hidden risk that comps aren't pricing in. Stress-test before assuming the spread holds.
Location & tenants
- Location reads 63/100 on livability (#115 in AZ) — a middle-class / working-renter tenant base. Strengths: cost of living A+, housing A+; Watch: health & safety C-, employment D+, crime F.
- Santa Cruz Valley Unified District (4458) (town): math 12% / reading 26% proficiency, ranked #184 of 249 in AZ (top 74%) — low school quality limits family demand, transient renter base, plan for 1-2y turnover; 62% free/reduced lunch — lower-income household profile, screen leases tightly.
- Zoned schools: Mountain View School (math 8% / reading 17%, grade F, #944 of 1,109 statewide, top 87%, 387 students, 83% FRL); Coatimundi Middle School (math 16% / reading 32%, grade F, #109 of 218 statewide, top 51%, 473 students, 69% FRL); Rio Rico High School (math 13% / reading 21%, grade F, #252 of 381 statewide, top 67%, 1,414 students, 72% FRL).
- Market conditions: 414 active listings in the ZIP; 8 comparable units currently listed for rent nearby; rentals at typical pace (median 23d on market — plan ~3-4 weeks tenant-placement turnaround); 340 units permitted in Santa Cruz County in 2024 (0 in 5+ unit buildings).
Forward outlook
- In year one you build about $24k of equity ($2k loan paydown + $23k appreciation (10.0% local appreciation)).
- Santa Cruz County population projected at -22% by 2050 — secular population decline; favor cash flow + early exit over multi-decade hold.
- By year 2, paydown + projected appreciation supports a ~$39k cash-out refi (75% LTV) — recoverable capital for the next deal without selling this one.
Negotiation context
- Only 13 days on market — expect competitive offers; lowballing is unlikely to land.
- 3 sale attempts since 4y ago with the ask held roughly flat each time — persistent listings suggest the price (not the market) is what's stuck; bring a comps-based counter.
- Current owner paid $142k; list at $229k implies a 62% gain — meaningful room to come down on a strong offer.
Risks & watch-outs
- Climate carrying-cost: major flood risk; major wildfire risk; extreme-heat days projected 7→21/yr by 2055 (HVAC capex compounding) — expect insurance premiums to compound above CPI over the hold.
Questions for the listing agent
- What do current leases actually rent for vs. the listed asking? Can we see a recent rent roll and the last 12 months of T-12 income?
- Is there a deadline driving the sale (1031 exchange, divorce, estate, relocation)? That informs how much negotiation room exists.
- Schools are F-rated, which usually means shorter tenancies and higher turnover. Who's the typical renter profile here, and what's been the actual vacancy rate?
- Crime grade is F in this area — have there been break-ins, vandalism, or insurance claims at this property in the last 3 years? What carrier currently insures it and at what premium?
- The area grade is low — what's the realistic commute time and amenity access for the typical tenant pool here? Any planned neighborhood developments (good or bad) we should know about?
- What's the average days-on-market for RENTAL listings here right now (not sales)? A rising rental-DOM trend means longer vacancies and softer asking-rent achievability than the comps imply.
- What's the recent tenant-quality profile in this submarket — average credit score on applications, eviction rate, late-payment / NSF rate, and stable-employment percentage? A property-management company in the area should have these aggregated.
- How much new for-sale + rental construction is in the pipeline within 1–3 miles? Heavy new supply typically softens prices + rents 12–24 months out; constrained supply supports both.
Investment metrics
- 1% rule
- 0.66% ✗
- Cap rate
- 5.34%
- Cash-on-cash
- -3.39%
- DSCR
- 0.85
- GRM
- 12.6
CMA / ARV
- ARV (on-the-fly)
- $213,672
- Comps found
- 7
Show comp detail 7 sales within ~0.75 mi
| Address | Dist | Beds/Ba | Sqft | Sold | Price | $/sf | Match |
|---|---|---|---|---|---|---|---|
| 489 Alondra Ct | 0.00mi | 3/2.0 | 1,228 (0%) | 2mo | $141,600 | $115 | 98 |
| 435 Calle Azulejo | 0.29mi | 3/2.0 | 1,235 (+1%) | 5mo | $215,000 | $174 | 81 |
| 435 Hongo Ct | 0.31mi | 3/2.0 | 1,164 (-5%) | 5mo | $220,000 | $189 | 72 |
| 427 Paseo Flamenco | 0.19mi | 3/2.0 | 1,351 (+10%) | 3mo | $249,000 | $184 | 72 |
| 438 Paseo Bocado -- | 0.25mi | 3/2.0 | 1,179 (-4%) | 19mo | $164,000 | $139 | 66 |
| 1240 Paseo Chubasco | 0.51mi | 3/2.0 | 1,150 (-6%) | 4mo | $205,000 | $178 | 62 |
| 428 Camino Agosto | 0.72mi | 3/2.0 | 1,288 (+5%) | 1mo | $222,000 | $172 | 57 |
Match score weights: distance 35% · size 25% · config 20% · recency 20%. Top-matched comps best support the ARV.
Projected returns pro-forma
10.0% appreciation · 3.0% rent growth · sell at horizon
- IRR
- 21.8%
- Equity multiple
- 2.76×
- Total profit
- $113,084
- Equity at exit
- $206,301
- IRR
- 19.7%
- Equity multiple
- 6.33×
- Total profit
- $341,870
- Equity at exit
- $444,897
Cash invested: $64,120 (down + closing). Projections, not guarantees.
Landlord ↔ Tenant lean methodology
- Overall (STATE)
- 87 Strongly Landlord-Friendly
- State Arizona
- 87 Strongly Landlord-Friendly · R+3
- County
- — inherits STATE
- City
- — inherits STATE
ZIP-level market 85648
- Home prices YoY
- 21.0%
- Active inventory
- 414
- Price-to-rent
- 12.6×
Monthly cashflow live
- Estimated rent
- $1,509 high interval (Pro) →
- Mortgage (P&I)
- −$1,201
- Tax from tax record
- −$77 /mo · $926/yr
- Insurance
- −$95
- HOA
- −$0
- Vacancy / Maint / Mgmt
- −$317
- Net cashflow
- $-181
Break-even live
Sensitivity live
| Price | -10% $-51 | -5% $-116 | +0% $-181 | +5% $-246 | +10% $-311 |
|---|---|---|---|---|---|
| Rent | -10% $-300 | -5% $-241 | +0% $-181 | +5% $-121 | +10% $-62 |
| Rate | -1.0pp $-66 | -0.5pp $-123 | base $-181 | +0.5pp $-240 | +1.0pp $-301 |
UW: 25.0% down · 7.5% · 30yr · 1.5% tax · 5.0% vac · 8.0% maint · 8.0% mgmt
Financing live
Cash to close
- Down payment
- $57,250
- Closing costs
- $6,870
- Reserves months
- —
- Total cash needed
- —
Loan-product check · same deal, 3 products live
Conventional
25% down · 7.5% · 30yr
- Down + closing
- —
- Monthly P&I
- —
- Monthly cashflow
- —
- DSCR
- —
- Eligible?
- —
Personal DTI + credit; lowest rate.
DSCR
20% down · 8.5% · 30yr
- Down + closing
- —
- Monthly P&I
- —
- Monthly cashflow
- —
- DSCR
- —
- Eligible?
- —
No personal income docs; deal must DSCR.
Hard money
10% down · 12.0% · 12mo
- Down + closing
- —
- Monthly P&I
- —
- Monthly cashflow
- —
- DSCR
- —
- Eligible?
- —
Short-term bridge; refi at stabilization.
Rent comps 8 comps
| Address | Beds | Baths | Sqft | Rent | $/sqft | DOM | Units | Dist |
|---|---|---|---|---|---|---|---|---|
| 426 Camino del Patio Rio Rico, AZ | 2.0 | 2.0 | 901 | $1,350 | $1.50 | 45d | 1 | 0.24mi |
| 422 Avenida Oriol Rio Rico, AZ | 2.0 | 1.5 | 1200 | $1,275 | $1.06 | 4d | 1 | 0.47mi |
| 1271 W Frontage Rd Rio Rico, AZ | 2.0 | 1.0 | 886 | $1,250 | $1.41 | 5d | 1 | 0.52mi |
| 1271 W Frontage Rd Rio Rico, AZ | 2.0 | 1.0 | 886 | $1,250 | $1.41 | 45d | 1 | 0.52mi |
| 1271 W Frontage Rd Rio Rico, AZ | 3.0 | 2.0 | 1331 | $1,550 | $1.16 | 23d | 1 | 0.52mi |
| 1271 W Frontage Rd Rio Rico, AZ | 2.0 | 1.0 | 886 | $1,250 | $1.41 | 25d | 1 | 0.52mi |
| 1271 W Frontage Rd Rio Rico, AZ | 2.0 | 1.0 | 886 | $1,250 | $1.41 | 16d | 1 | 0.52mi |
| 1271 W Frontage Rd Rio Rico, AZ | 2.0 | 1.0 | 886 | $1,250 | $1.41 | 22d | 1 | 0.52mi |
Listing history 9 events
-
2026-06-21days on market $229,000 Active 13 DOM
-
2026-06-18days on market $229,000 Active 10 DOM
-
2026-06-17days on market $229,000 Active 9 DOM
-
2026-06-16days on market $229,000 Active 8 DOM
-
2026-06-15days on market $229,000 Active 7 DOM
-
2026-06-13days on market $229,000 Active 5 DOM
-
2026-06-10days on market $229,000 Active 2 DOM
-
2026-06-08remarks 239-char remark
-
2026-06-08$229,000 Active 1 DOM
ⓘ Source: listings_history table (triggers on properties + properties_extension) + one-shot
backfill from property_details.listing_events for pre-trigger history.
Tax reassessment forecast AZ · Resets to sale price
- Current annual tax
- $926 · $77/mo
- Projected year-2 tax
- $1,511 · $126/mo
- Expected delta
- +$585/yr (+$49/mo · 63.2%)
ⓘ Screening estimate from a state-policy table — verify with the county assessor before closing.
Climate risk First Street
- Flood 6/10 Major FEMA zone X (unshaded) · 74% chance over 30 yrs
- Wildfire 7/10 Severe
- Heat 7/10 Severe 7 d/yr ≥100°F today · 21 d/yr by 30 yrs out
- Wind 1/10 Low
- Air quality 1/10 Low 0 unhealthy d/yr today · 0 by 30 yrs out
Nearby sold comps map
Loading sold comps map…
Walkable amenities ~0.75 mi
Loading nearby amenities…
Taxation est. · year 1
- Rental income
- $18,113
- − Mortgage interest
- −$12,828
- − Property taxes
- −$926
- − Insurance
- −$1,145
- − Repairs & maintenance
- −$1,449
- − Management
- −$1,449
- − Depreciation
- −$6,662
- Taxable loss
- −$6,345
- Est. tax savings @ 24.0%
- +$1,523
- After-tax cash flow
- $-650/yr
For passive investors: Depreciation is non-cash, so a rental often shows a tax loss while cash-flowing — sheltering income. Rental losses are passive: they offset passive income freely, and up to $25,000/yr can offset ordinary (W-2) income if you actively participate and your MAGI is under $100k (phasing out to $0 by $150k); unused losses carry forward. On sale, claimed depreciation is recaptured at up to 25%, and gains may owe capital-gains tax (a 1031 exchange can defer both). Figures are a year-1 estimate at your 24.0% rate — not tax advice; consult a CPA.
Schools (NCES district)
- District
- Santa Cruz Valley Unified District (4458)
- NCES district ID
- 0407520
- Math proficiency
- 12% ▼ -19.00%
- Reading proficiency
- 26% ▼ -9.00%
- Median HH income
- $48,019
- Composite
- 16.84/100
- National rank
- #9147
- State rank
- #184 of 249 in AZ
Livability — Rio Rico
- Score
- 63/100
- State rank
- #115
- US rank
- #15321
Category grades
Schools grade is shown separately in the Schools card above.
Census & demographics
- Census place
- Rio Rico, AZ
- County
- Santa Cruz County · 22,118 people
- City population
- 22,118
- Metro
- Nogales, AZ
- Population (ZIP)
- 22,118
- Household income
- $61,519
- Rent vs Own
- Severe rent burden
- 407.0
Population outlook (Santa Cruz County) Hauer SSP2
- Today (2025)
- 43,796 people
- By 2030
- 42,097 · -3.9%
- By 2040
- 38,235 · -12.7%
- By 2050
- 34,224 · -21.9%
- By 2075
- 26,014 · -40.6%
- By 2100
- 18,165 · -58.5%
Race, ethnicity, and origin ACS 2023
- Neighborhood character
- Predominantly Hispanic (86%)
- Race & ethnicity
- Hispanic / Latino 86% Two or more races 48% White 12%
- Hispanic origin (detail)
- Mexican 83%
- Common ancestry
- Lithuanian 1% Slovak 1% Iranian 1%
- Foreign-born
- 30% · Canada
- Languages at home
- 21% English-only · Spanish 79%
Political lean MEDSL · Santa Cruz
- 2024 margin
- D (+18.6) · D 58.9% · R 40.3%
- 2008→2024 swing
- -12.7pp toward R · 2008: 31.3pp · 2024: 18.6pp
- All cycles
- 2024: D+18.6 2020: D+35.5 2016: D+47.1 2012: D+37.8 2008: D+31.3
Not yet ingested
- Civics
- —
Market trends
- HPI YoY
- ▲ 72.18%
- Current HPI
- 415.2167
- Rent YoY
- —
- Metro
- Nogales, AZ
- State GDP YoY
- ▲ 4.54%
- F500 in state
- 20
Industry mix (Fortune 500 HQ in AZ)
| Industry | F500 HQs | Revenue |
|---|---|---|
| Technology | 2 | $13B |
|
||
| Mining / Metals | 1 | $23B |
|
||
| Environmental Services | 1 | $16B |
|
||
| Metals / Steel | 1 | $14B |
|
||
| Technology Distribution | 1 | $9B |
|
||
| Homebuilding | 1 | $8B |
|
||
Price history
+17.5% since first listed7 events — show timeline
- 2026-06-01 Listed $229,000 MLSSAZ
- 2026-04-26 Sold (MLS) $141,600 MLSSAZ
- 2026-04-01 Pending — MLSSAZ
- 2026-03-21 Price Changed $134,520 MLSSAZ
- 2026-02-19 Listed $141,600 MLSSAZ
- 2022-10-26 Listing Removed — MLSSAZ
- 2022-10-12 Listed $194,900 MLSSAZ
Property tax history
+3.5%/yrLatest (2025): $926 · +6.5% YoY. Source: county tax records.
Cash-flow waterfall
monthlySold comps — $/sqft
last 12 mo · ≤1 miLoading sold comps…