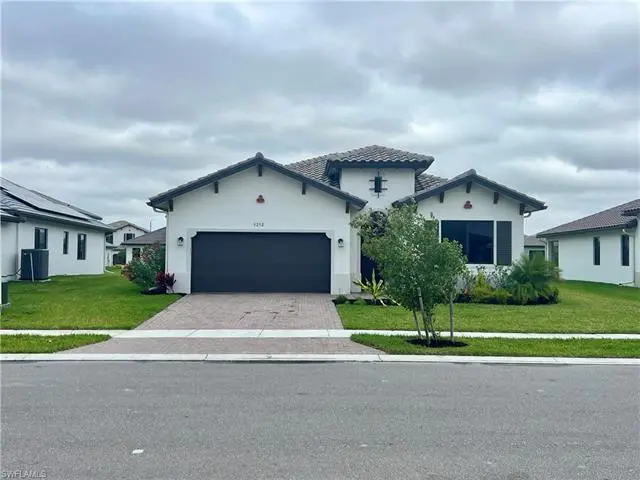
5252 Lamone Ln · Ave Maria, FL
Flood risk 1/10 · Minimal
- FEMA flood zone
- AH
- Chance of flooding over 30 yrs
- 0.0%
- Est. flood insurance / yr
- $1,142 – $2,507
Fire risk 5/10 · Moderate
- Est. fire insurance / yr
- $947 – $1,759
Heat risk 9/10 · Severe
- Hot days now (above 111°F)
- 7 days/yr
- Hot days in 30 yrs
- 26 days/yr
Wind risk 10/10 · Severe
- Chance of severe wind over 30 yrs
- 99.0%
Air-quality risk 2/10 · Minimal
- Unhealthy air days now
- 0 days/yr
- Unhealthy air days in 30 yrs
- 1 days/yr
Risk factors via First Street. Map © Google.
Why this score? — see what drove the C grade
The composite is a weighted blend of 9 inputs, each scored 0–100. Each bar is that input's sub-score; the figure is the points it added to the 100-point composite (weight × sub-score).
- Cash flow +20.1/30.0
- ARV discount +7.5/15.0
- 1% rule +6.4/10.0
- DSCR +6.4/10.0
- Schools +5.0/10.0
- Appreciation +4.5/10.0
- Condition / age +4.0/5.0
- Rent growth +3.2/5.0
- Livability +2.5/5.0
$399,000
🖨 Deal sheet 📄 Offer letter ✓ Due diligence
Listing remarks
* * * SHORT SALE * * * Welcome to 5252 Lamone Lane, a beautifully maintained newer-construction home in Ave Maria’s DESIRABLE MAPLE RIDGE COMMUNITY. BUILT IN 2024 and set on a GENEROUS 0.24-ACRE LOT, this spacious residence offers 2,256 SQFT of living space with 3 BR+DEN/2.5 BA, and a bright, open layout designed for comfortable everyday living and entertaining. Inside, the home features TILE FLOORING THROUGHOUT THE MAIN LIVING AREAS, carpet in the bedrooms and den, IMPACT WINDOWS & DOORS, UPGRADED QUARTZ COUNTERTOPS, MODERN APPLIANCES, WINDOW COVERINGS, LIGHTS FIXTURES, and CEILING FANS. The kitchen offers a clean, modern look with ample workspace and a seamless connecti
Key facts
- Modern appliances
- 0.24 acre lot
- 2 garage spots
Tags
Property features AI
Finance
- HOA & community: Mandatory HOA (non-gated community); Monthly HOA fee of $95; Quarterly master HOA fee of $203; One-time other fee of $160; Total annual recurring fees $1,952; Total one-time fees $410; HOA maintenance covers legal/accounting, recreation facilities, and street lights; Community amenities include clubhouse, community pool and spa, exercise room, tennis, pickleball, basketball, bocce, volleyball, putting green, golf course, dog park, playground, sidewalks, streetlights, library, restaurant, shopping, cabana, vehicle wash area, internet access and more; Community managed by developer
Exterior
- Parking: Attached 2-car garage; Automatic garage door
- Security: Impact resistant windows and doors
- Utilities: Central water; Central sewer; Cable available; Central electric power
- Home design: Single-family home; One-story / ranch; Rear exposure to the east; Residential property in Ave Maria
- Construction: Built in 2024; Concrete block construction; Stucco exterior; Tile roof; Impact resistant and single-hung windows
- Exterior features: Room for a pool; Automatic sprinkler system
Interior
- Kitchen: Electric cooktop; Self-cleaning oven; Microwave; Dishwasher; Disposal; Refrigerator / Refrigerator-Freezer; Pantry
- Bedrooms: 3 bedrooms plus den
- Flooring: Carpet; Tile
- Bathrooms: Two full bathrooms; One half bathroom; Master bathroom with dual sinks and shower (no tub)
- Heating & cooling: Central electric heat; Central electric air conditioning; Ceiling fans
- Interior features: French doors; High-speed internet available; Laundry tub; Pantry; Smoke detectors; Window coverings; Dining area in living room; Den/study; Open porch/lanai; Unfurnished; Great room floor plan; Split bedroom layout
- Laundry & utility: Washer and dryer included; Laundry in residence; Laundry tub
Neighborhood map
What this means for you Summary
Snapshot
- This is a 3-bed/2.5-bath single-family listed at $399k. Condition is rated good.
Deal economics
- At list price, monthly cash flow is $343 ($4k/yr) — positive.
- The deal already cash-flows at list — no discount required.
- Meets the 1% rule at list price ($5k rent vs $399k).
Location & tenants
- Location reads: area grade C — affects rentability + tenant quality, not the cash-flow math above.
- Collier (suburban): math 60% / reading 56% proficiency, ranked #16 of 73 in FL (top 22%) — acceptable for families but not a draw, mixed tenant base, ~2y average lease.
- Zoned schools: Avalon Elementary School (math 47% / reading 40%, grade F, #1,345 of 2,144 statewide, top 64%, 346 students, 74% FRL); Palmetto Ridge High School (math 43% / reading 51%, grade D-, #207 of 667 statewide, top 32%, 2,347 students, 38% FRL) — zoned schools at 56% FRL track the district average.
- Zoned-school proficiency averages 45% at this address vs 58% district-wide (-13 pts) — the specific schools serving this property underperform the Collier average; the district grade overstates school quality for this exact location.
- Market conditions: Rents rising (+3.0%/yr); 449 active listings in the ZIP; 40 comparable units currently listed for rent nearby; rentals at typical pace (median 21d on market — plan ~3-4 weeks tenant-placement turnaround); 3,520 units permitted in Collier County in 2024 (959 in 5+ unit buildings).
- At $4,538/mo this rent would consume 87% of the median local household income ($62k/yr) (locally 1093% of renters already pay >50% of income on rent) — very limited rent-growth headroom before tenants either downsize or default.
Forward outlook
- Local home prices are declining (-1.1%/yr); year-one equity from $3k of loan paydown is wiped out by about $4k of value loss. Plan a longer hold.
- Collier County population projected at +30% by 2050 — long-run rental-demand tailwind backs the buy-and-hold thesis.
Negotiation context
- Only 10 days on market — expect competitive offers; lowballing is unlikely to land.
- 2 sale attempts with the ask held roughly flat each time — persistent listings suggest the price (not the market) is what's stuck; bring a comps-based counter.
Risks & watch-outs
- Watch-outs: flood insurance adds $152/mo.
- Climate carrying-cost: in FEMA flood zone AH (mandatory federal flood insurance); severe wind risk, 99% chance of damaging wind over 30y; moderate wildfire risk; extreme-heat days projected 7→26/yr by 2055 (HVAC capex compounding) — expect insurance premiums to compound above CPI over the hold.
Questions for the listing agent
- What's the actual annual flood-insurance premium (NFIP or private), and is the property in a SFHA with mandatory coverage?
- What does the HOA fee cover, when was the last increase, and are there any pending special assessments or reserve-fund shortfalls?
- Is there a deadline driving the sale (1031 exchange, divorce, estate, relocation)? That informs how much negotiation room exists.
- What's the average days-on-market for RENTAL listings here right now (not sales)? A rising rental-DOM trend means longer vacancies and softer asking-rent achievability than the comps imply.
- What's the recent tenant-quality profile in this submarket — average credit score on applications, eviction rate, late-payment / NSF rate, and stable-employment percentage? A property-management company in the area should have these aggregated.
- How much new for-sale + rental construction is in the pipeline within 1–3 miles? Heavy new supply typically softens prices + rents 12–24 months out; constrained supply supports both.
Investment metrics
- 1% rule
- 1.14% ✓
- Cap rate
- 7.78%
- Cash-on-cash
- 5.32%
- DSCR
- 1.24
- GRM
- 7.3
CMA / ARV
No comps found within radius.
Projected returns pro-forma
-1.05% appreciation · 2.95% rent growth · sell at horizon
- IRR
- -1.8%
- Equity multiple
- 0.92×
- Total profit
- $-8,939
- Equity at exit
- $95,391
- IRR
- 4.9%
- Equity multiple
- 1.47×
- Total profit
- $52,490
- Equity at exit
- $99,383
Cash invested: $111,720 (down + closing). Projections, not guarantees.
Landlord ↔ Tenant lean methodology
- Overall (STATE)
- 87 Strongly Landlord-Friendly
- State Florida
- 87 Strongly Landlord-Friendly · R+3
- County
- — inherits STATE
- City
- — inherits STATE
ZIP-level market 34142
- Home prices YoY
- -0.5%
- Rents YoY
- 3.0%
- Active inventory
- 449
- Price-to-rent
- 7.3×
Monthly cashflow live
- Estimated rent
- $4,538 high interval (Pro) →
- Mortgage (P&I)
- −$2,092
- Tax from tax record
- −$670 /mo · $8,036/yr
- Insurance
- −$166
- Flood insurance flood zone
- −$152 /mo · $1,824/yr
- HOA
- −$162
- Vacancy / Maint / Mgmt
- −$953
- Net cashflow
- $343
Break-even live
UW: 25.0% down · 7.5% · 30yr · 1.5% tax · 5.0% vac · 8.0% maint · 8.0% mgmt
Financing live
Cash to close
- Down payment
- $99,750
- Closing costs
- $11,970
- Reserves months
- —
- Total cash needed
- —
Loan-product check · same deal, 3 products live
Conventional
25% down · 7.5% · 30yr
- Down + closing
- —
- Monthly P&I
- —
- Monthly cashflow
- —
- DSCR
- —
- Eligible?
- —
Personal DTI + credit; lowest rate.
DSCR
20% down · 8.5% · 30yr
- Down + closing
- —
- Monthly P&I
- —
- Monthly cashflow
- —
- DSCR
- —
- Eligible?
- —
No personal income docs; deal must DSCR.
Hard money
10% down · 12.0% · 12mo
- Down + closing
- —
- Monthly P&I
- —
- Monthly cashflow
- —
- DSCR
- —
- Eligible?
- —
Short-term bridge; refi at stabilization.
Rent comps 40 comps
| Address | Beds | Baths | Sqft | Rent | $/sqft | DOM | Units | Dist |
|---|---|---|---|---|---|---|---|---|
| 5077 Gambero Way Ave Maria, FL | 4.0 | 3.0 | 2256 | $3,950 | $1.75 | 23d | 1 | 0.16mi |
| 5285 Marano Dr Ave Maria, FL | 3.0 | 2.5 | 2256 | $2,600 | $1.15 | 23d | 1 | 0.18mi |
| 5293 Marano Dr Ave Maria, FL | 3.0 | 2.5 | 2256 | $3,400 | $1.51 | 21d | 1 | 0.19mi |
| 5414 Espada Ct Ave Maria, FL | 3.0 | 3.0 | 2799 | $10,995 | $3.93 | 21d | 1 | 0.19mi |
| 5065 Gambero Way Ave Maria, FL | 4.0 | 3.0 | 2557 | $3,250 | $1.27 | 21d | 1 | 0.20mi |
| 5322 Nevola Ave Ave Maria, FL | 3.0 | 3.0 | 1918 | $2,700 | $1.41 | 13d | 1 | 0.21mi |
| 5376 Fancourt Links Way Ave Maria, FL | 2.0 | 2.5 | 1850 | $6,850 | $3.70 | 21d | 1 | 0.21mi |
| 5187 Nevola Ave Ave Maria, FL | 3.0 | 2.5 | 1680 | $2,700 | $1.61 | 21d | 1 | 0.25mi |
| 5039 Frattina St Ave Maria, FL | 3.0 | 3.0 | 2341 | $5,995 | $2.56 | 23d | 1 | 0.29mi |
| 5412 Fancourt Links Way Ave Maria, FL | 4.0 | 3.0 | 2247 | $8,000 | $3.56 | 21d | 1 | 0.29mi |
| 5522 Hampton Links Ct Ave Maria, FL | 2.0 | 2.5 | 1850 | $3,995 | $2.16 | 23d | 1 | 0.31mi |
| 5013 Florence Dr Ave Maria, FL | 3.0 | 2.5 | 2256 | $2,900 | $1.29 | 23d | 1 | 0.32mi |
| 5089 Penella Ave Ave Maria, FL | 3.0 | 2.5 | 2028 | $2,300 | $1.13 | 13d | 1 | 0.32mi |
| 5545 Hampton Links Ct Ave Maria, FL | 4.0 | 3.0 | 2247 | $8,500 | $3.78 | 23d | 1 | 0.32mi |
| 5545 Hampton Links Ct #5545 Ave Maria, FL | 4.0 | 3.0 | 2400 | $9,000 | $3.75 | 23d | 1 | 0.32mi |
| 5428 Fancourt Links Way Ave Maria, FL | 3.0 | 3.0 | 2247 | $7,895 | $3.51 | 21d | 1 | 0.33mi |
| 5538 Hampton Links Ct Ave Maria, FL | 3.0 | 3.0 | 2247 | $6,295 | $2.80 | 21d | 1 | 0.34mi |
| 5114 Penella Ave Ave Maria, FL | 4.0 | 3.0 | 2599 | $3,195 | $1.23 | 21d | 1 | 0.36mi |
| 5444 Fancourt Links Way Ave Maria, FL | 3.0 | 3.0 | 2247 | $3,995 | $1.78 | 21d | 1 | 0.37mi |
| 5515 Whistling Straights Ct Ave Maria, FL | 3.0 | 2.5 | 2419 | $6,500 | $2.69 | 21d | 1 | 0.43mi |
| 5427 Double Eagle Cir #2815 Ave Maria, FL | 2.0 | 2.0 | 1400 | $2,700 | $1.93 | 23d | 1 | 0.43mi |
| 5427 Double Eagle Cir #2826 Ave Maria, FL | 2.0 | 2.0 | 1569 | $6,495 | $4.14 | 23d | 1 | 0.43mi |
| 5435 Pikewood Ct Ave Maria, FL | 2.0 | 2.5 | 1850 | $3,695 | $2.00 | 21d | 1 | 0.44mi |
| 5445 Double Eagle Cir #3026 Ave Maria, FL | 2.0 | 2.0 | 1569 | $2,350 | $1.50 | 21d | 1 | 0.45mi |
| 5120 Nevola Ave Ave Maria, FL | 4.0 | 3.0 | 2273 | $3,500 | $1.54 | 11d | 1 | 0.45mi |
| 5032 Arancia Ln Ave Maria, FL | 3.0 | 2.0 | 1525 | $2,595 | $1.70 | 13d | 1 | 0.47mi |
| 5265 Messina St Ave Maria, FL | 3.0 | 2.5 | 1929 | $4,995 | $2.59 | 23d | 1 | 0.47mi |
| 5104 Salerno St Ave Maria, FL | 4.0 | 3.0 | 2341 | $5,595 | $2.39 | 23d | 1 | 0.48mi |
| 5374 Ferris Ave Ave Maria, FL | 3.0 | 2.5 | 1933 | $2,350 | $1.22 | 23d | 1 | 0.50mi |
| 5478 Double Eagle Cir #3521 Ave Maria, FL | 2.0 | 2.0 | 1569 | $4,995 | $3.18 | 23d | 1 | 0.50mi |
| 5538 Useppa Dr Ave Maria, FL | 2.0 | 2.5 | 1850 | $10,995 | $5.94 | 23d | 1 | 0.51mi |
| 5661 Melbourne Ct #8011 Ave Maria, FL | 3.0 | 2.0 | 1741 | $7,295 | $4.19 | 11d | 1 | 0.53mi |
| 5667 Melbourne Ct #7812 Ave Maria, FL | 3.0 | 2.0 | 1741 | $6,250 | $3.59 | 11d | 1 | 0.53mi |
| 4919 Frattina St Ave Maria, FL | 4.0 | 3.0 | 2350 | $3,300 | $1.40 | 23d | 1 | 0.54mi |
| 4957 Gambero Way Unit 4957 Ave Maria, FL | 4.0 | 3.0 | 1500 | $3,400 | $2.27 | 11d | 1 | 0.54mi |
| 5674 Melbourne Ct Unit 7721 Ave Maria, FL | 3.0 | 2.0 | 2110 | $7,295 | $3.46 | 11d | 1 | 0.57mi |
| 4925 Gambero Way Ave Maria, FL | 2.0 | 2.0 | 1525 | $4,000 | $2.62 | 23d | 1 | 0.58mi |
| 5680 Melbourne Ct #7521 Ave Maria, FL | 3.0 | 2.0 | 2110 | $2,650 | $1.26 | 3d | 1 | 0.58mi |
| 5704 Melbourne Ct Ave Maria, FL | 3.0 | 2.0 | 1741 | $3,995 | $2.29 | 23d | 1 | 0.59mi |
| 5739 Oakmont Ct Ave Maria, FL | 3.0 | 2.0 | 1710 | $3,700 | $2.16 | 23d | 1 | 0.64mi |
HOA detail
- Monthly dues
- $162 · $1,944/yr
Listing history 8 events
-
2026-06-18days on market $399,000 Active 10 DOM
-
2026-06-17days on market $399,000 Active 9 DOM
-
2026-06-16days on market $399,000 Active 8 DOM
-
2026-06-15days on market $399,000 Active 7 DOM
-
2026-06-14days on market $399,000 Active 5 DOM
-
2026-06-10days on market $399,000 Active 2 DOM
-
2026-06-09remarks 689-char remark
-
2026-06-09$399,000 Active 1 DOM
ⓘ Source: listings_history table (triggers on properties + properties_extension) + one-shot
backfill from property_details.listing_events for pre-trigger history.
Tax reassessment forecast FL · Resets to sale price
- Current annual tax
- $8,036 · $670/mo
- Projected year-2 tax
- $8,036 · $670/mo
- Expected delta
- $0/yr ($0/mo · -0.0%)
ⓘ Screening estimate from a state-policy table — verify with the county assessor before closing.
Climate risk First Street
- Flood 1/10 Low FEMA zone AH · 0% chance over 30 yrs
- Wildfire 5/10 Major
- Heat 9/10 Extreme 7 d/yr ≥111°F today · 26 d/yr by 30 yrs out
- Wind 10/10 Extreme 99% chance of damaging wind over 30 yrs
- Air quality 2/10 Low 0 unhealthy d/yr today · 1 by 30 yrs out
Nearby sold comps map
Loading sold comps map…
Walkable amenities ~0.75 mi
Loading nearby amenities…
Taxation est. · year 1
- Rental income
- $54,459
- − Mortgage interest
- −$22,350
- − Property taxes
- −$8,036
- − Insurance
- −$3,819
- − Repairs & maintenance
- −$4,357
- − Management
- −$4,357
- − HOA
- −$1,944
- − Depreciation
- −$11,607
- Taxable loss
- −$2,012
- Est. tax savings @ 24.0%
- +$483
- After-tax cash flow
- $4,596/yr
For passive investors: Depreciation is non-cash, so a rental often shows a tax loss while cash-flowing — sheltering income. Rental losses are passive: they offset passive income freely, and up to $25,000/yr can offset ordinary (W-2) income if you actively participate and your MAGI is under $100k (phasing out to $0 by $150k); unused losses carry forward. On sale, claimed depreciation is recaptured at up to 25%, and gains may owe capital-gains tax (a 1031 exchange can defer both). Figures are a year-1 estimate at your 24.0% rate — not tax advice; consult a CPA.
Condition & rehab AI · 12 photos
This newer construction home in Ave Maria's desirable Maple Ridge community is in excellent condition with modern finishes and ample space. It's move-in ready with minimal maintenance required.
Value-add opportunities
- Both landscaping — enhances curb appeal and adds value
- Both smart home integration — increases convenience and marketability
- Both smart thermostat — improves energy efficiency and comfort
Renovation cost estimate screening
Value-add ROI direction
- Both landscaping — enhances curb appeal and adds value ↑
- Both smart home integration — increases convenience and marketability ↑
- Both smart thermostat — improves energy efficiency and comfort ↑
ⓘ Cost ranges are severity-bucket heuristics (US national rule-of-thumb). Get contractor quotes + a written scope before underwriting a rehab budget.
Schools (NCES district)
- District
- Collier
- NCES district ID
- 1200330
- Math proficiency
- 60% ▼ -4.00%
- Reading proficiency
- 56% ▼ -2.00%
- Median HH income
- $58,275
- Composite
- 50.23/100
- National rank
- #1892
- State rank
- #16 of 73 in FL
Livability — Ave Maria
No livability data for this city. (Only ~50 U.S. cities are tracked.)
Census & demographics
- Census place
- Ave Maria, FL
- County
- Collier County · 396,295 people
- Metro
- Naples-Marco Island, FL
- Population (ZIP)
- 35,149
- Household income
- $62,333
- Rent vs Own
- Severe rent burden
- 1093.0
Population outlook (Collier County) Hauer SSP2
- Today (2025)
- 420,858 people
- By 2030
- 450,054 · +6.9%
- By 2040
- 502,232 · +19.3%
- By 2050
- 544,932 · +29.5%
- By 2075
- 627,203 · +49.0%
- By 2100
- 659,015 · +56.6%
Race, ethnicity, and origin ACS 2023
- Neighborhood character
- Majority Hispanic (63%)
- Race & ethnicity
- Hispanic / Latino 63% Two or more races 39% Black 19% White 16% Native American 7%
- Hispanic origin (detail)
- Mexican 43% Puerto Rican 3% Cuban 2% Dominican 1%
- Common ancestry
- Hispanic 8% Slovak 1% Serbian 1%
- Foreign-born
- 32% · Canada, Jamaica
- Languages at home
- 34% English-only · Spanish 53% French/Haitian/Cajun 12%
Political lean MEDSL · Collier
- 2024 margin
- Solid R (+33.1) · D 33.1% · R 66.2%
- 2008→2024 swing
- -10.6pp toward R · 2008: -22.5pp · 2024: -33.1pp
- All cycles
- 2024: R+33.1 2020: R+24.7 2016: R+26.0 2012: R+30.1 2008: R+22.5
Not yet ingested
- Civics
- —
Market trends
- HPI YoY
- ▼ -1.05%
- Current HPI
- 226.9105
- Rent YoY
- ▲ 2.95%
- Metro
- Naples-Marco Island, FL
- State GDP YoY
- ▲ 3.28%
- F500 in state
- 36
Industry mix (Fortune 500 HQ in FL)
| Industry | F500 HQs | Revenue |
|---|---|---|
| Industrial Technology | 2 | $29B |
|
||
| Insurance | 2 | $17B |
|
||
| Retail | 1 | $60B |
|
||
| Technology Distribution | 1 | $58B |
|
||
| Homebuilding | 1 | $35B |
|
||
| Technology Manufacturing | 1 | $35B |
|
||
Price history
+14150.0% since first listed4 events — show timeline
- 2026-06-08 Listed $399,000 NAPLESMLS
- 2025-05-22 Rental Removed $2,600 NAPLESMLS
- 2025-05-06 Price Changed $2,600 NAPLESMLS
- 2025-03-29 Listed for Rent $2,800 NAPLESMLS
Property tax history
+202.8%/yrLatest (2025): $8,036 · +202.8% YoY. Source: county tax records.
Cash-flow waterfall
monthlySold comps — $/sqft
last 12 mo · ≤1 miLoading sold comps…