0 Clifty Creek Rd · Lewisburg, KY
Flood risk 1/10 · Minimal
- FEMA flood zone
- X (unshaded)
- Chance of flooding over 30 yrs
- 0.0%
- Est. flood insurance / yr
- $507 – $1,088
Fire risk 4/10 · Minor
- Est. fire insurance / yr
- $839 – $1,559
Heat risk 5/10 · Moderate
- Hot days now (above 108°F)
- 7 days/yr
- Hot days in 30 yrs
- 19 days/yr
Wind risk 4/10 · Minor
- Chance of severe wind over 30 yrs
- 9.0%
Air-quality risk 2/10 · Minimal
- Unhealthy air days now
- 0 days/yr
- Unhealthy air days in 30 yrs
- 1 days/yr
Risk factors via First Street. Map © Google.
Why this score? — see what drove the B grade
The composite is a weighted blend of 9 inputs, each scored 0–100. Each bar is that input's sub-score; the figure is the points it added to the 100-point composite (weight × sub-score).
- Cash flow +30.0/30.0
- 1% rule +10.0/10.0
- DSCR +10.0/10.0
- ARV discount +7.5/15.0
- Appreciation +5.0/10.0
- Schools +3.3/10.0
- Livability +3.2/5.0
- Rent growth +2.5/5.0
- Condition / age +1.0/5.0
$29,900
🖨 Deal sheet 📄 Offer letter ✓ Due diligence
Listing remarks MLS
Investment opportunity! This lot is being sold AS IS and is just minutes from Lake Malone. Ideal for investors or recreational use.
Key facts
- Built 1920
- Listed 111 days
Tags
Neighborhood map
What this means for you Summary
Snapshot
- This is a 2-bed/?-bath single-family listed at $30k. Condition is rated poor.
Deal economics
- At list price, monthly cash flow is $418 ($5k/yr) — positive.
- The deal already cash-flows at list — no discount required.
- Meets the 1% rule at list price ($790 rent vs $30k).
- Recommended offer: $27k (9.0% below list) — sets the bar for market timing.
Location & tenants
- Location reads 64/100 on livability (#295 in KY) — a middle-class / working-renter tenant base. Strengths: crime A+, cost of living A+, housing A+; Watch: schools D, amenities F, commute F.
- Logan County (rural): math 35% / reading 44% proficiency, ranked #32 of 165 in KY (top 19%) — families likely to look elsewhere, expect single-tenant / working-renter base with shorter leases.
- Market conditions: 62 active listings in the ZIP; 30 units permitted in Logan County in 2024 (0 in 5+ unit buildings).
Forward outlook
- In year one you build about $218 of equity ($207 loan paydown + $11 appreciation (0.0% local appreciation)).
- Logan County population projected at -13% by 2050 — secular population decline; favor cash flow + early exit over multi-decade hold.
- At projected returns (0.0% appreciation + 3.0% rent growth), your $8k cash investment doubles in ~2 years — after that, you're playing with house money.
Negotiation context
- It's been on market 111 days — a 9% lower offer ($27k) is reasonable based on typical stale-listing flexibility.
- 3 sale attempts with the ask held roughly flat each time — persistent listings suggest the price (not the market) is what's stuck; bring a comps-based counter.
Risks & watch-outs
- Watch-outs: built in 1920 — expect roof / HVAC / electrical / plumbing capex.
- Climate carrying-cost: extreme-heat days projected 7→19/yr by 2055 (HVAC capex compounding) — expect insurance premiums to compound above CPI over the hold.
Questions for the listing agent
- It's been on market 111 days. Have you received any prior offers? Is the seller open to a 9% concession, seller financing, or rate buy-down credit?
- Have any recent inspections been done? Can we get a copy of the seller's disclosures and any deferred-maintenance estimates?
- Built in 1920 — when were the roof, HVAC, electrical panel, plumbing, and water heater last replaced?
- Why hasn't it sold? Are there any deal-killer items the seller is aware of (foundation, flood, title, zoning, code violations)?
- Is there a deadline driving the sale (1031 exchange, divorce, estate, relocation)? That informs how much negotiation room exists.
- Schools are D-rated, which usually means shorter tenancies and higher turnover. Who's the typical renter profile here, and what's been the actual vacancy rate?
- What's the average days-on-market for RENTAL listings here right now (not sales)? A rising rental-DOM trend means longer vacancies and softer asking-rent achievability than the comps imply.
- What's the recent tenant-quality profile in this submarket — average credit score on applications, eviction rate, late-payment / NSF rate, and stable-employment percentage? A property-management company in the area should have these aggregated.
- How much new for-sale + rental construction is in the pipeline within 1–3 miles? Heavy new supply typically softens prices + rents 12–24 months out; constrained supply supports both.
Investment metrics
- 1% rule
- 2.64% ✓
- Cap rate
- 23.06%
- Cash-on-cash
- 59.89%
- DSCR
- 3.66
- GRM
- 3.2
CMA / ARV
No comps found within radius.
Projected returns pro-forma
0.04% appreciation · 3.0% rent growth · sell at horizon
- IRR
- 61.7%
- Equity multiple
- 4.08×
- Total profit
- $25,804
- Equity at exit
- $8,739
- IRR
- 63.8%
- Equity multiple
- 8.26×
- Total profit
- $60,769
- Equity at exit
- $10,551
Cash invested: $8,372 (down + closing). Projections, not guarantees.
Landlord ↔ Tenant lean methodology
- Overall (STATE)
- 83 Strongly Landlord-Friendly
- State Kentucky
- 83 Strongly Landlord-Friendly · R+16
- County
- — inherits STATE
- City
- — inherits STATE
ZIP-level market 42256
- Home prices YoY
- 0.0%
- Active inventory
- 62
- Price-to-rent
- 3.2×
Monthly cashflow live
- Estimated rent
- $790 medium interval (Pro) →
- Mortgage (P&I)
- −$157
- Tax est. 1.5%
- −$37 /mo · $448/yr
- Insurance
- −$12
- HOA
- −$0
- Vacancy / Maint / Mgmt
- −$166
- Net cashflow
- $418
Break-even live
UW: 25.0% down · 7.5% · 30yr · 1.5% tax · 5.0% vac · 8.0% maint · 8.0% mgmt
Financing live
Cash to close
- Down payment
- $7,475
- Closing costs
- $897
- Reserves months
- —
- Total cash needed
- —
Loan-product check · same deal, 3 products live
Conventional
25% down · 7.5% · 30yr
- Down + closing
- —
- Monthly P&I
- —
- Monthly cashflow
- —
- DSCR
- —
- Eligible?
- —
Personal DTI + credit; lowest rate.
DSCR
20% down · 8.5% · 30yr
- Down + closing
- —
- Monthly P&I
- —
- Monthly cashflow
- —
- DSCR
- —
- Eligible?
- —
No personal income docs; deal must DSCR.
Hard money
10% down · 12.0% · 12mo
- Down + closing
- —
- Monthly P&I
- —
- Monthly cashflow
- —
- DSCR
- —
- Eligible?
- —
Short-term bridge; refi at stabilization.
Listing history 18 events
-
2026-06-18days on market $29,900 Active 111 DOM
-
2026-06-17days on market $29,900 Active 110 DOM
-
2026-06-16days on market $29,900 Active 109 DOM
-
2026-06-15days on market $29,900 Active 108 DOM
-
2026-06-14days on market $29,900 Active 106 DOM
-
2026-06-13days on market $29,900 Active 105 DOM
-
2026-06-10days on market $29,900 Active 103 DOM
-
2026-06-09days on market $29,900 Active 102 DOM
-
2026-06-08days on market $29,900 Active 101 DOM
-
2026-06-07days on market $29,900 Active 100 DOM
-
2026-06-03days on market $29,900 Active 96 DOM
-
2026-06-02days on market $29,900 Active 95 DOM
-
2026-06-01days on market $29,900 Active 94 DOM
-
2026-05-31days on market $29,900 Active 93 DOM
-
2026-05-31days on market $29,900 Active 92 DOM
-
2026-02-28$29,900 Active 131-char remark
Show marketing remark (131 chars)
Investment opportunity! This lot is being sold AS IS and is just minutes from Lake Malone. Ideal for investors or recreational use.
-
2026-02-28status Active 131-char remark
Show marketing remark (131 chars)
Investment opportunity! This lot is being sold AS IS and is just minutes from Lake Malone. Ideal for investors or recreational use.
-
2026-02-27$29,900 Active 131-char remark
Show marketing remark (131 chars)
Investment opportunity! This lot is being sold AS IS and is just minutes from Lake Malone. Ideal for investors or recreational use.
ⓘ Source: listings_history table (triggers on properties + properties_extension) + one-shot
backfill from property_details.listing_events for pre-trigger history.
Climate risk First Street
- Flood 1/10 Low FEMA zone X (unshaded) · 0% chance over 30 yrs
- Wildfire 4/10 Moderate
- Heat 5/10 Major 7 d/yr ≥108°F today · 19 d/yr by 30 yrs out
- Wind 4/10 Moderate 9% chance of damaging wind over 30 yrs
- Air quality 2/10 Low 0 unhealthy d/yr today · 1 by 30 yrs out
Nearby sold comps map
Loading sold comps map…
Walkable amenities ~0.75 mi
Loading nearby amenities…
Taxation est. · year 1
- Rental income
- $9,486
- − Mortgage interest
- −$1,675
- − Property taxes
- −$448
- − Insurance
- −$150
- − Repairs & maintenance
- −$759
- − Management
- −$759
- − Depreciation
- −$870
- Taxable income
- $4,825
- Est. tax owed @ 24.0%
- −$1,158
- After-tax cash flow
- $3,856/yr
For passive investors: Depreciation is non-cash, so a rental often shows a tax loss while cash-flowing — sheltering income. Rental losses are passive: they offset passive income freely, and up to $25,000/yr can offset ordinary (W-2) income if you actively participate and your MAGI is under $100k (phasing out to $0 by $150k); unused losses carry forward. On sale, claimed depreciation is recaptured at up to 25%, and gains may owe capital-gains tax (a 1031 exchange can defer both). Figures are a year-1 estimate at your 24.0% rate — not tax advice; consult a CPA.
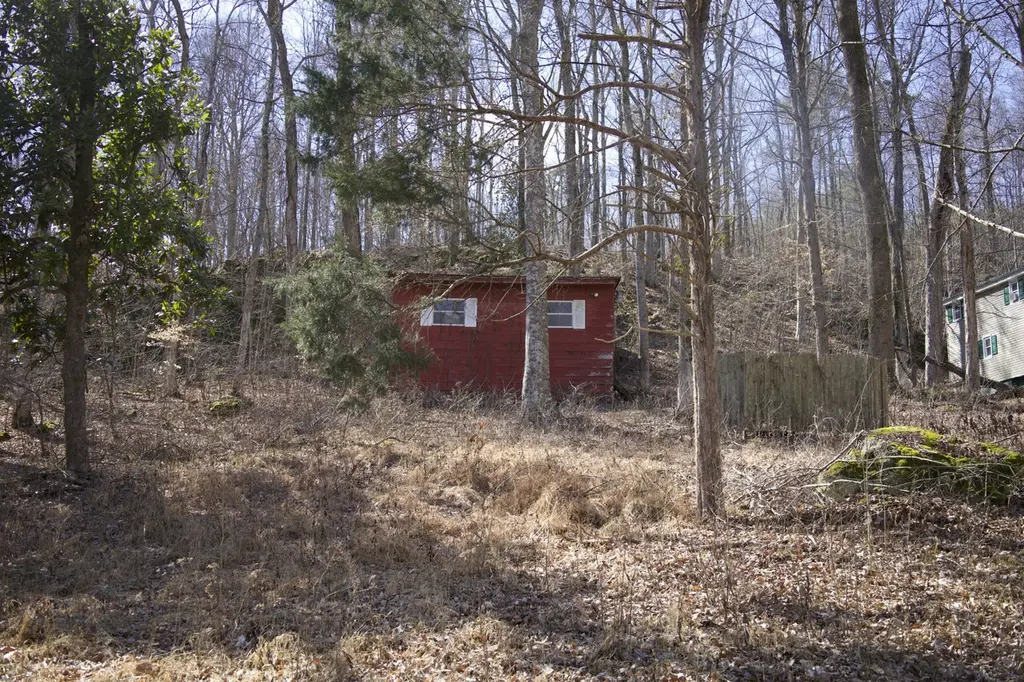
Condition & rehab AI · 7 photos
This property requires extensive repairs and maintenance, including roof replacement, exterior painting, and interior repairs. Landscaping and fencing would significantly improve its curb appeal and safety.
Repairs flagged
- Major roof — No visible roof in photos
- Major exterior siding — Red paint peeling
- Major interior flooring — Exposed subfloor, missing flooring
- Major interior walls — Structural damage, debris
Value-add opportunities
- Both Landscaping and fencing — Improves curb appeal and safety
- Both Roof replacement — Essential for structural integrity and safety
- Both Exterior painting — Enhances curb appeal and property value
- Both Interior repairs and flooring — Restores structural integrity and enhances living space
Renovation cost estimate screening
| Repair item | Severity | Est. cost |
|---|---|---|
| roof · No visible roof in photos | Major | $15,000–50,000 |
| exterior siding · Red paint peeling | Major | $15,000–50,000 |
| interior flooring · Exposed subfloor, missing flooring | Major | $15,000–50,000 |
| interior walls · Structural damage, debris | Major | $15,000–50,000 |
| Total estimated repair cost · 4 items | $60,000–200,000 |
Value-add ROI direction
- Both Landscaping and fencing — Improves curb appeal and safety ↑
- Both Roof replacement — Essential for structural integrity and safety ↑
- Both Exterior painting — Enhances curb appeal and property value ↑
- Both Interior repairs and flooring — Restores structural integrity and enhances living space ↑
ⓘ Cost ranges are severity-bucket heuristics (US national rule-of-thumb). Get contractor quotes + a written scope before underwriting a rehab budget.
Schools (NCES district)
- District
- Logan County
- NCES district ID
- 2103540
- Math proficiency
- 35% ▼ -17.00%
- Reading proficiency
- 44% ▼ -14.00%
- Median HH income
- $42,577
- Composite
- 33.34/100
- National rank
- #5492
- State rank
- #32 of 165 in KY
Livability — Lewisburg
- Score
- 64/100
- State rank
- #295
- US rank
- #14165
Category grades
Schools grade is shown separately in the Schools card above.
Census & demographics
- Census place
- Lewisburg, KY
- Population (ZIP)
- 5,052
Population outlook (Logan County) Hauer SSP2
- Today (2025)
- 26,133 people
- By 2030
- 25,572 · -2.1%
- By 2040
- 24,247 · -7.2%
- By 2050
- 22,849 · -12.6%
- By 2075
- 19,587 · -25.0%
- By 2100
- 15,927 · -39.1%
Race, ethnicity, and origin ACS 2023
- Neighborhood character
- Predominantly White (95%)
- Race & ethnicity
- White 95% Hispanic / Latino 3% Two or more races 2%
- Common ancestry
- Italian 2% Slovak 1% Romanian 1%
- Foreign-born
- 0%
- Languages at home
- 96% English-only · German/W. Germanic 2% Russian/Polish/Slavic 1% Other Indo-European 1%
Political lean MEDSL · Logan
- 2024 margin
- Solid R (+55.1) · D 21.9% · R 76.9% · Other 1.2%
- 2008→2024 swing
- -26.5pp toward R · 2008: -28.6pp · 2024: -55.1pp
- All cycles
- 2024: R+55.1 2020: R+48.4 2016: R+46.1 2012: R+32.6 2008: R+28.6
Not yet ingested
- Civics
- —
Market trends
- HPI YoY
- ▬ 0.04%
- Current HPI
- 265.4274
- Rent YoY
- —
- Metro
- —
- State GDP YoY
- ▲ 1.81%
- F500 in state
- 4
Industry mix (Fortune 500 HQ in KY)
| Industry | F500 HQs | Revenue |
|---|---|---|
| Healthcare | 1 | $118B |
|
||
| Food / Beverage | 1 | $7B |
|
||
Price history
+0.0% since first listed3 events — show timeline
- 2026-02-28 Listed $29,900 REALTRACS as Distributed by MLS Grid
- 2026-02-28 Relisted — RASKMLS
- 2026-02-27 Listed $29,900 RASKMLS
Cash-flow waterfall
monthlySold comps — $/sqft
last 12 mo · ≤1 miLoading sold comps…