 🏗️ New Construction
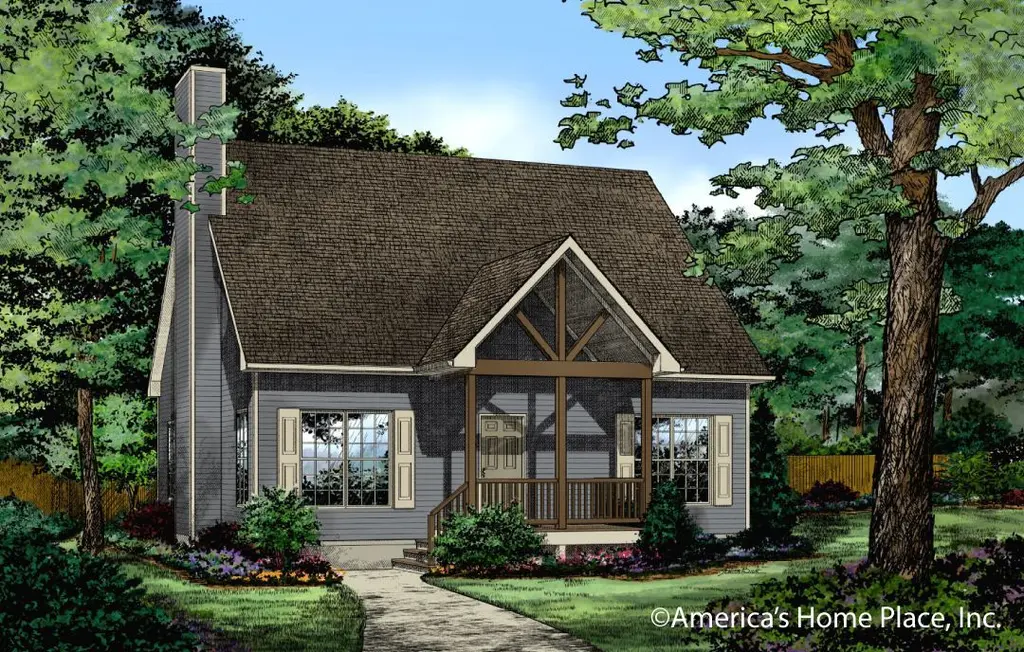
Timberhill A Plan · Woodfin, NC
Flood risk No data
- FEMA flood zone
- —
- Chance of flooding over 30 yrs
- —
- Est. flood insurance / yr
- —
Fire risk No data
- Est. fire insurance / yr
- —
Heat risk No data
- Hot days now (above threshold)
- —
- Hot days in 30 yrs
- —
Wind risk No data
- Chance of severe wind over 30 yrs
- —
Air-quality risk No data
- Unhealthy air days now
- —
- Unhealthy air days in 30 yrs
- —
Risk factors via First Street. Map © Google.
Why this score? — see what drove the F grade
The composite is a weighted blend of 9 inputs, each scored 0–100. Each bar is that input's sub-score; the figure is the points it added to the 100-point composite (weight × sub-score).
- ARV discount +7.5/15.0
- Condition / age +4.8/5.0
- Schools +4.0/10.0
- Livability +3.0/5.0
- Cash flow +2.7/30.0
- Rent growth +2.6/5.0
- 1% rule +0.0/10.0
- DSCR +0.0/10.0
- Appreciation +0.0/10.0
$269,522
🖨 Deal sheet (PDF) 📄 Offer letter ✓ Due diligence
Listing remarks MLS
Cozy cabin feel for the country or the mountains with a covered front deck to enjoy the scenery. You will love this 3 bedroom, 2.5 bath plan. You will find the master on the main floor and 2 bedrooms upstairs. The optional fireplace is sure to warm up the spacious great room.
Key facts
- Master on main floor
- Covered front deck
- Listed 671 days
Tags
Neighborhood map
What this means for you Summary
Snapshot
- This is a 3-bed/2.5-bath single-family listed at $270k. Condition is rated excellent.
Deal economics
- At list price, monthly cash flow is $-2k ($-20k/yr) — negative.
- To cash-flow at today's rent, offer at most $249k (7.5% below list).
- To meet the 1% rule (rent ≥ 1% of price), the offer needs to be $218k (19.1% below list).
- Recommended offer: $218k (19.1% below list) — sets the bar for 1% rule.
Location & tenants
- Location reads 59/100 on livability (#538 in NC) — a working-class tenant base; expect higher turnover. Strengths: housing A+, crime A-, cost of living B; Watch: amenities F, commute F, health & safety F.
- Buncombe County Schools (suburban): math 45% / reading 50% proficiency, ranked #72 of 178 in NC (top 40%) — families likely to look elsewhere, expect single-tenant / working-renter base with shorter leases.
- Zoned schools: Weaverville Elementary (math 57% / reading 67%, grade B, #179 of 1,410 statewide, top 14%, 303 students, 48% FRL); North Buncombe Middle (math 63% / reading 59%, grade B+, #40 of 475 statewide, top 9%, 504 students, 45% FRL); North Buncombe High (math 67% / reading 65%, grade B, #154 of 535 statewide, top 29%, 956 students, 42% FRL) — zoned schools at 45% FRL track the district average.
- Zoned-school proficiency averages 63% at this address vs 48% district-wide (+16 pts) — the actual schools serving this property are materially stronger than the Buncombe County Schools average implies; a family-tenant draw the district grade alone would hide.
- Market conditions: Rents flat; 374 active listings in the ZIP; 8 comparable units currently listed for rent nearby; rentals at typical pace (median 25d on market — plan ~3-4 weeks tenant-placement turnaround); solid renter incomes; 3,305 units permitted in Buncombe County in 2024 (1,855 in 5+ unit buildings).
Forward outlook
- Local home prices are declining (-3.0%/yr); year-one equity from $3k of loan paydown is wiped out by about $15k of value loss. Plan a longer hold.
- Buncombe County population projected at +24% by 2050 — long-run rental-demand tailwind backs the buy-and-hold thesis.
Negotiation context
- It's been on market 671 days — a 12% lower offer ($237k) is reasonable based on typical stale-listing flexibility.
Risks & watch-outs
- Watch-outs: property tax is 2.7% of price.
Questions for the listing agent
- What do current leases actually rent for vs. the listed asking? Can we see a recent rent roll and the last 12 months of T-12 income?
- It's been on market 671 days. Have you received any prior offers? Is the seller open to a 19% concession, seller financing, or rate buy-down credit?
- Property tax is high relative to price — has the assessment been appealed recently, and will the sale trigger a re-assessment?
- Why hasn't it sold? Are there any deal-killer items the seller is aware of (foundation, flood, title, zoning, code violations)?
- Is there a deadline driving the sale (1031 exchange, divorce, estate, relocation)? That informs how much negotiation room exists.
- Schools are F-rated, which usually means shorter tenancies and higher turnover. Who's the typical renter profile here, and what's been the actual vacancy rate?
- The area grade is low — what's the realistic commute time and amenity access for the typical tenant pool here? Any planned neighborhood developments (good or bad) we should know about?
- What's the average days-on-market for RENTAL listings here right now (not sales)? A rising rental-DOM trend means longer vacancies and softer asking-rent achievability than the comps imply.
- What's the recent tenant-quality profile in this submarket — average credit score on applications, eviction rate, late-payment / NSF rate, and stable-employment percentage? A property-management company in the area should have these aggregated.
- How much new for-sale + rental construction is in the pipeline within 1–3 miles? Heavy new supply typically softens prices + rents 12–24 months out; constrained supply supports both.
Investment metrics
- 1% rule
- 0.45% ✗
- Cap rate
- 2.23%
- Cash-on-cash
- -14.52%
- DSCR
- 0.35
- GRM
- 18.7
CMA / ARV
- ARV (median comp)
- $488,979
- List price
- $269,522
- Delta
- -44.88%
- Verdict
- UNDERPRICED
- Comps
- 20 within 1.0 mi
Show comp detail 12 sales within ~0.75 mi
| Address | Dist | Beds/Ba | Sqft | Sold | Price | $/sf | Match |
|---|---|---|---|---|---|---|---|
| 6 Chipmunk Cove Rd | 0.44mi | 3/2.0 | 1,700 (-1%) | 11mo | $455,000 | $268 | 68 |
| 2 Westminster Dr | 0.54mi | 3/2.5 | 1,683 (-2%) | 8mo | $395,000 | $235 | 66 |
| 4 Highlander Rd | 0.40mi | 3/2.0 | 1,812 (+6%) | 8mo | $452,500 | $250 | 62 |
| 338 Espen Rdg | 0.41mi | 3/2.5 | 1,945 (+14%) | 0mo | $495,000 | $254 | 58 |
| 447 Creekside Dr | 0.72mi | 3/2.0 | 1,645 (-4%) | 5mo | $438,000 | $266 | 54 |
| 101 Firwood Ct | 0.57mi | 3/2.0 | 1,622 (-5%) | 13mo | $540,000 | $333 | 52 |
| 93 Stoney Hill Ct | 0.58mi | 3/2.0 | 1,884 (+10%) | 3mo | $456,000 | $242 | 51 |
| 56 Knoll Ridge Dr | 0.63mi | 3/2.0 | 1,529 (-11%) | 1mo | $415,000 | $271 | 50 |
| 65 Knoll Ridge Dr | 0.67mi | 3/2.0 | 1,529 (-11%) | 5mo | $369,000 | $241 | 45 |
| 10 Knoll Ridge Dr | 0.49mi | 3/2.0 | 1,900 (+11%) | 14mo | $425,000 | $224 | 44 |
| 110 Leisure Mountain Rd #30 | 0.65mi | 2/2.5 (-1) | 1,488 (-13%) | 1mo | $357,000 | $240 | 43 |
| 138 Appalachian Village Rd | 0.67mi | 3/2.0 | 1,486 (-13%) | 10mo | $485,000 | $326 | 36 |
Match score weights: distance 35% · size 25% · config 20% · recency 20%. Top-matched comps best support the ARV.
Projected returns pro-forma
-3.0% appreciation · 0.46% rent growth · sell at horizon
- IRR
- -46.6%
- Equity multiple
- -0.39×
- Total profit
- $-190,142
- Equity at exit
- $72,908
- IRR
- —
- Equity multiple
- -1.36×
- Total profit
- $-322,489
- Equity at exit
- $42,278
Cash invested: $136,914 (down + closing). Projections, not guarantees.
Landlord ↔ Tenant lean methodology
- Overall (STATE)
- 85 Strongly Landlord-Friendly
- State North Carolina
- 85 Strongly Landlord-Friendly · R+3
- County
- — inherits STATE
- City
- — inherits STATE
ZIP-level market 28804
- Rents YoY
- 0.5%
- Active inventory
- 374
- Price-to-rent
- 10.3×
Monthly cashflow live
- Estimated rent
- $2,181 high interval (Pro) →
- Mortgage (P&I)
- −$2,564
- Tax est. 1.5%
- −$611 /mo · $7,335/yr
- Insurance
- −$204
- HOA
- −$0
- Vacancy / Maint / Mgmt
- −$458
- Net cashflow
- $-1,657
Break-even live
Sensitivity live
| Price | -10% $-1,319 | -5% $-1,488 | +0% $-1,657 | +5% $-1,825 | +10% $-1,994 |
|---|---|---|---|---|---|
| Rent | -10% $-1,829 | -5% $-1,743 | +0% $-1,657 | +5% $-1,570 | +10% $-1,484 |
| Rate | -1.0pp $-1,410 | -0.5pp $-1,532 | base $-1,657 | +0.5pp $-1,783 | +1.0pp $-1,912 |
UW: 25.0% down · 7.5% · 30yr · 1.5% tax · 5.0% vac · 8.0% maint · 8.0% mgmt
Financing live
Cash to close
- Down payment
- $122,245
- Closing costs
- $14,669
- Reserves months
- —
- Total cash needed
- —
Loan-product check · same deal, 3 products live
Conventional
25% down · 7.5% · 30yr
- Down + closing
- —
- Monthly P&I
- —
- Monthly cashflow
- —
- DSCR
- —
- Eligible?
- —
Personal DTI + credit; lowest rate.
DSCR
20% down · 8.5% · 30yr
- Down + closing
- —
- Monthly P&I
- —
- Monthly cashflow
- —
- DSCR
- —
- Eligible?
- —
No personal income docs; deal must DSCR.
Hard money
10% down · 12.0% · 12mo
- Down + closing
- —
- Monthly P&I
- —
- Monthly cashflow
- —
- DSCR
- —
- Eligible?
- —
Short-term bridge; refi at stabilization.
Rent comps 8 comps
| Address | Beds | Baths | Sqft | Rent | $/sqft | DOM | Units | Dist |
|---|---|---|---|---|---|---|---|---|
| 50 Barnwood Dr Asheville, NC | 1.0–3.0 | 1.0–2.0 | 955 | $1,995 | $2.09 | 15d | 15 | 0.15mi |
| 89 Black Locust Dr Asheville, NC | 3.0 | 2.0 | 1216 | $1,600 | $1.32 | 25d | 1 | 0.29mi |
| 602 Highline Dr Asheville, NC | 1.0–3.0 | 1.0–2.0 | 1070 | $2,195 | $2.05 | 15d | 18 | 0.90mi |
| 19 Barnett Shoals Dr Weaverville, NC | 3.0 | 2.5 | 1310 | $2,200 | $1.68 | 15d | 1 | 1.13mi |
| 14 Loftin St Weaverville, NC | 3.0 | 2.0 | 1800 | $2,700 | $1.50 | 15d | 1 | 1.15mi |
| 20 Sandstone Dr Weaverville, NC | 3.0 | 2.5 | 2135 | $3,200 | $1.50 | 45d | 1 | 1.23mi |
| 560 Country Oak Dr Asheville, NC | 4.0 | 2.5 | 1995 | $2,850 | $1.43 | 45d | 1 | 1.24mi |
| 1070 Cider Mill Loop Weaverville, NC | 3.0 | 2.0 | 1383 | $2,210 | $1.60 | 46d | 1 | 1.30mi |
Listing history 19 events
-
2026-06-22days on market $269,522 Active 671 DOM
-
2026-06-18days on market $269,522 Active 668 DOM
-
2026-06-17days on market $269,522 Active 667 DOM
-
2026-06-16days on market $269,522 Active 666 DOM
-
2026-06-15price $269,522 Active 665 DOM
-
2026-06-15days on market $263,565 Active 665 DOM
-
2026-06-14days on market $263,565 Active 663 DOM
-
2026-06-10days on market $263,565 Active 660 DOM
-
2026-06-09days on market $263,565 Active 659 DOM
-
2026-06-08days on market $263,565 Active 658 DOM
-
2026-06-07days on market $263,565 Active 657 DOM
-
2026-06-03days on market $263,565 Active 653 DOM
-
2026-06-02days on market $263,565 Active 652 DOM
-
2026-06-01days on market $263,565 Active 651 DOM
-
2026-05-31days on market $263,565 Active 650 DOM
-
2026-05-30days on market $263,565 Active 649 DOM
-
2025-10-20price $263,565 276-char remark
Show marketing remark (276 chars)
Cozy cabin feel for the country or the mountains with a covered front deck to enjoy the scenery. You will love this 3 bedroom, 2.5 bath plan. You will find the master on the main floor and 2 bedrooms upstairs. The optional fireplace is sure to warm up the spacious great room.
-
2025-06-11price $259,670 276-char remark
Show marketing remark (276 chars)
Cozy cabin feel for the country or the mountains with a covered front deck to enjoy the scenery. You will love this 3 bedroom, 2.5 bath plan. You will find the master on the main floor and 2 bedrooms upstairs. The optional fireplace is sure to warm up the spacious great room.
-
2024-08-19$273,567 Active 276-char remark
Show marketing remark (276 chars)
Cozy cabin feel for the country or the mountains with a covered front deck to enjoy the scenery. You will love this 3 bedroom, 2.5 bath plan. You will find the master on the main floor and 2 bedrooms upstairs. The optional fireplace is sure to warm up the spacious great room.
ⓘ Source: listings_history table (triggers on properties + properties_extension) + one-shot
backfill from property_details.listing_events for pre-trigger history.
Nearby sold comps map
Loading sold comps map…
Walkable amenities ~0.75 mi
Loading nearby amenities…
Taxation est. · year 1
- Rental income
- $26,168
- − Mortgage interest
- −$27,390
- − Property taxes
- −$7,335
- − Insurance
- −$2,445
- − Repairs & maintenance
- −$2,093
- − Management
- −$2,093
- − Depreciation
- −$14,225
- Taxable loss
- −$29,414
- Est. tax savings @ 24.0%
- +$7,059
- After-tax cash flow
- $-12,819/yr
For passive investors: Depreciation is non-cash, so a rental often shows a tax loss while cash-flowing — sheltering income. Rental losses are passive: they offset passive income freely, and up to $25,000/yr can offset ordinary (W-2) income if you actively participate and your MAGI is under $100k (phasing out to $0 by $150k); unused losses carry forward. On sale, claimed depreciation is recaptured at up to 25%, and gains may owe capital-gains tax (a 1031 exchange can defer both). Figures are a year-1 estimate at your 24.0% rate — not tax advice; consult a CPA.
Condition & rehab AI · 13 photos
This home is in excellent condition with modern updates and a well-maintained exterior. It is move-in ready and would be a great investment for both resale and rental markets.
Value-add opportunities
- Both landscaping — enhances curb appeal and adds value
- Both interior paint — fresh paint can make a home more appealing
- Both kitchen backsplash — adds a modern touch and can increase value
Renovation cost estimate screening
Value-add ROI direction
- Both landscaping — enhances curb appeal and adds value ↑
- Both interior paint — fresh paint can make a home more appealing ↑
- Both kitchen backsplash — adds a modern touch and can increase value ↑
ⓘ Cost ranges are severity-bucket heuristics (US national rule-of-thumb). Get contractor quotes + a written scope before underwriting a rehab budget.
Schools (NCES district)
- District
- Buncombe County Schools
- NCES district ID
- 3700450
- Math proficiency
- 45% ▬ 0.00%
- Reading proficiency
- 50% ▲ 2.00%
- Median HH income
- $45,981
- Composite
- 40.32/100
- National rank
- #3749
- State rank
- #72 of 178 in NC
Livability — Woodfin
- Score
- 59/100
- State rank
- #538
- US rank
- #19731
Category grades
Schools grade is shown separately in the Schools card above.
Census & demographics
- Census place
- Woodfin, NC
- County
- Buncombe County · 241,085 people
- Metro
- Asheville, NC
- Population (ZIP)
- 25,776
- Household income
- $88,312
- Rent vs Own
- Severe rent burden
- 396.0
Population outlook (Buncombe County) Hauer SSP2
- Today (2025)
- 286,475 people
- By 2030
- 302,237 · +5.5%
- By 2040
- 330,687 · +15.4%
- By 2050
- 356,370 · +24.4%
- By 2075
- 409,383 · +42.9%
- By 2100
- 437,270 · +52.6%
Race, ethnicity, and origin ACS 2023
- Neighborhood character
- Predominantly White (82%)
- Race & ethnicity
- White 82% Two or more races 9% Hispanic / Latino 8% Black 4% Asian 2%
- Hispanic origin (detail)
- Mexican 4%
- Common ancestry
- Slovak 5% Lithuanian 4% Serbian 3%
- Foreign-born
- 7% · Canada, Jamaica
- Languages at home
- 91% English-only · Spanish 6% French/Haitian/Cajun 1%
Political lean MEDSL · Buncombe
- 2024 margin
- Strong D (+24.8) · D 61.7% · R 36.9% · Other 1.4%
- 2008→2024 swing
- +10.9pp toward D · 2008: 13.9pp · 2024: 24.8pp
- All cycles
- 2024: D+24.8 2020: D+21.1 2016: D+14.6 2012: D+12.4 2008: D+13.9
Not yet ingested
- Civics
- —
Market trends
- HPI YoY
- ▼ -410.50%
- Current HPI
- 333.3821
- Rent YoY
- ▲ 0.46%
- Metro
- Asheville, NC
- State GDP YoY
- ▲ 3.28%
- F500 in state
- 26
Industry mix (Fortune 500 HQ in NC)
| Industry | F500 HQs | Revenue |
|---|---|---|
| Financial Services | 2 | $213B |
|
||
| Retail | 2 | $95B |
|
||
| Industrial Conglomerate | 1 | $38B |
|
||
| Metals / Steel | 1 | $35B |
|
||
| Utilities | 1 | $30B |
|
||
| Industrial Machinery | 1 | $19B |
|
||
Price history
-3.7% since first listed3 events — show timeline
- 2025-10-20 Price Changed $263,565 Zillow
- 2025-06-11 Price Changed $259,670 Zillow
- 2024-08-19 Listed $273,567 Zillow
Cash-flow waterfall
monthlySold comps — $/sqft
last 12 mo · ≤1 miLoading sold comps…