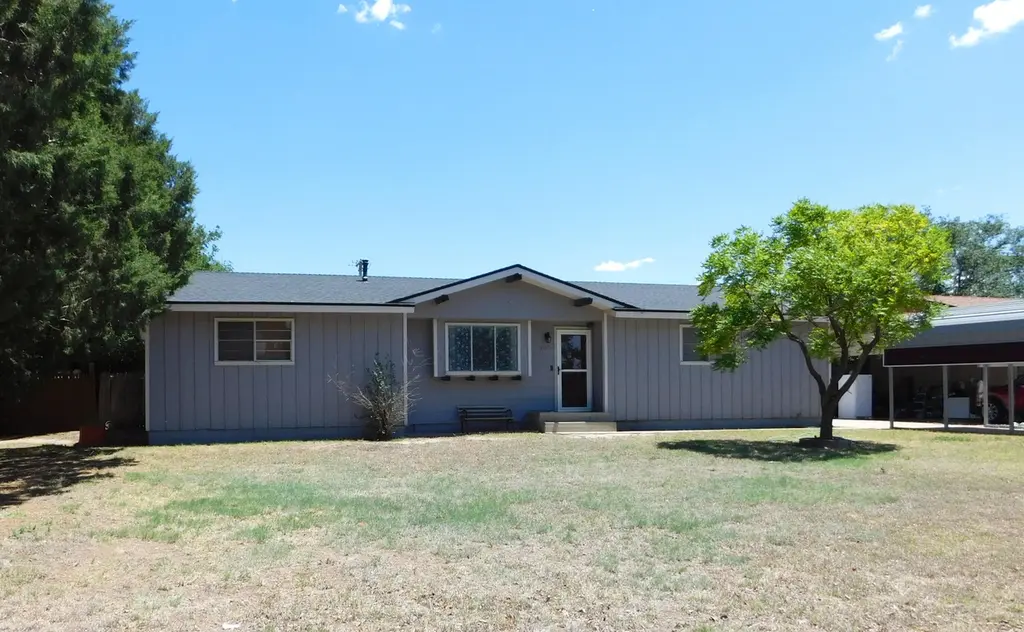
903 W 8th St · Muleshoe, TX
Flood risk No data
- FEMA flood zone
- —
- Chance of flooding over 30 yrs
- —
- Est. flood insurance / yr
- —
Fire risk No data
- Est. fire insurance / yr
- —
Heat risk No data
- Hot days now (above threshold)
- —
- Hot days in 30 yrs
- —
Wind risk No data
- Chance of severe wind over 30 yrs
- —
Air-quality risk No data
- Unhealthy air days now
- —
- Unhealthy air days in 30 yrs
- —
Risk factors via First Street. Map © Google.
Why this score? — see what drove the D grade
The composite is a weighted blend of 9 inputs, each scored 0–100. Each bar is that input's sub-score; the figure is the points it added to the 100-point composite (weight × sub-score).
- Cash flow +9.8/30.0
- ARV discount +7.5/15.0
- Appreciation +7.5/10.0
- Livability +3.6/5.0
- 1% rule +3.2/10.0
- DSCR +2.8/10.0
- Schools +2.8/10.0
- Rent growth +2.5/5.0
- Condition / age +2.5/5.0
$140,000
🖨 Deal sheet (PDF) 📄 Offer letter ✓ Due diligence
Listing remarks
Beautifully Remodeled 3 Bedroom, 2 Bath Home Near City Park - Muleshoe, TX This newly remodeled 3 bedroom, 2 bath home is move in ready and filled with updates that bring modern comfort, efficiency, and style to every space. Located just one block from the city park, walking trails, and baseball fields, this home offers convenience and charm in a fantastic neighborhood setting. Inside, you'll find all new flooring throughout, fresh interior paint, and a bright, welcoming layout. The isolated primary suite provides privacy and comfort, featuring a brand new walk in shower and updated finishes. The guest bath has also been fully remodeled with a new shower and modern touches. Major improvemen
Key facts
- New flooring
- Fresh interior paint
- Walk in shower
Tags
Property features AI
Exterior
- Parking: Carport (1 space); Driveway
- Utilities: Public water; Public sewer; Electricity connected; Natural gas connected; Natural gas available; Water connected; Sewer connected
- Home design: Single-family residence; Updated/remodeled
- Construction: Masonite construction; Pillar/post/pier foundation; Composition roof; Built on a 0.24-acre lot
- Exterior features: Private yard; Fenced backyard; Storage shed(s); Covered patio; Deck; French doors
Interior
- Kitchen: Dishwasher; Free-standing electric range; Microwave; Range hood; Gas water heater
- Flooring: Ceramic tile; Carpet; Linoleum; Vinyl
- Bathrooms: 2 full bathrooms
- Heating & cooling: Central heating (natural gas); Central air; Ceiling fans
- Interior features: Ceiling fans; Granite counters; His and hers closets; High-speed internet; Recessed lighting; Storage
- Laundry & utility: Electric and gas dryer hookups; Washer hookup; Dedicated laundry room
Neighborhood map
What this means for you Summary
Snapshot
- This is a 3-bed/2.0-bath single-family listed at $140k.
Deal economics
- At list price, monthly cash flow is $-89 ($-1k/yr) — negative.
- To cash-flow at today's rent, offer at most $124k (11.2% below list).
- To meet the 1% rule (rent ≥ 1% of price), the offer needs to be $115k (17.8% below list).
- Recommended offer: $115k (17.8% below list) — sets the bar for 1% rule.
Location & tenants
- Location reads 71/100 on livability (#331 in TX) — a middle-class / working-renter tenant base. Strengths: crime A+, cost of living A+, housing A+; Watch: employment C-, health & safety C-, amenities F.
- Muleshoe ISD (town): math 33% / reading 32% proficiency, ranked #580 of 826 in TX (top 70%) — families likely to look elsewhere, expect single-tenant / working-renter base with shorter leases; 73% free/reduced lunch — lower-income household profile, screen leases tightly.
- Zoned schools: Dillman El (403 students, 92% FRL); Watson J H (math 24% / reading 31%, grade F, #1,156 of 1,662 statewide, top 71%, 295 students, 90% FRL); Muleshoe H S (math 62% / reading 47%, grade C-, #379 of 1,632 statewide, top 26%, 359 students, 88% FRL) — zoned schools average 90% FRL vs 73% district-wide (17 pts higher); higher-poverty schools than district average — tighter screening recommended.
- Market conditions: 40 active listings in the ZIP; 1 units permitted in Bailey County in 2024 (0 in 5+ unit buildings).
Forward outlook
- In year one you build about $8k of equity ($968 loan paydown + $7k appreciation (5.0% local appreciation)).
- Bailey County population projected at +10% by 2050 — modest demand growth; plan on rents tracking national, not racing it.
- By year 5, paydown + projected appreciation supports a ~$35k cash-out refi (75% LTV) — recoverable capital for the next deal without selling this one.
Negotiation context
- It's been on market 17 days — a 2% lower offer ($138k) is reasonable based on typical stale-listing flexibility.
Questions for the listing agent
- What do current leases actually rent for vs. the listed asking? Can we see a recent rent roll and the last 12 months of T-12 income?
- Is there a deadline driving the sale (1031 exchange, divorce, estate, relocation)? That informs how much negotiation room exists.
- Schools are D-rated, which usually means shorter tenancies and higher turnover. Who's the typical renter profile here, and what's been the actual vacancy rate?
- The area grade is low — what's the realistic commute time and amenity access for the typical tenant pool here? Any planned neighborhood developments (good or bad) we should know about?
- What's the average days-on-market for RENTAL listings here right now (not sales)? A rising rental-DOM trend means longer vacancies and softer asking-rent achievability than the comps imply.
- What's the recent tenant-quality profile in this submarket — average credit score on applications, eviction rate, late-payment / NSF rate, and stable-employment percentage? A property-management company in the area should have these aggregated.
- How much new for-sale + rental construction is in the pipeline within 1–3 miles? Heavy new supply typically softens prices + rents 12–24 months out; constrained supply supports both.
Investment metrics
- 1% rule
- 0.82% ✗
- Cap rate
- 5.53%
- Cash-on-cash
- -2.72%
- DSCR
- 0.88
- GRM
- 10.1
CMA / ARV
No comps found within radius.
Projected returns pro-forma
4.98% appreciation · 3.0% rent growth · sell at horizon
- IRR
- 10.5%
- Equity multiple
- 1.67×
- Total profit
- $26,443
- Equity at exit
- $79,122
- IRR
- 11.9%
- Equity multiple
- 3.17×
- Total profit
- $85,025
- Equity at exit
- $136,377
Cash invested: $39,200 (down + closing). Projections, not guarantees.
Landlord ↔ Tenant lean methodology
- Overall (STATE)
- 87 Strongly Landlord-Friendly
- State Texas
- 87 Strongly Landlord-Friendly · R+5
- County
- — inherits STATE
- City
- — inherits STATE
ZIP-level market 79347
- Home prices YoY
- 3.7%
- Active inventory
- 40
- Price-to-rent
- 10.1×
Monthly cashflow live
- Estimated rent
- $1,151 medium interval (Pro) →
- Mortgage (P&I)
- −$734
- Tax from tax record
- −$206 /mo · $2,471/yr
- Insurance
- −$58
- HOA
- −$0
- Vacancy / Maint / Mgmt
- −$242
- Net cashflow
- $-89
Break-even live
Sensitivity live
| Price | -10% $-10 | -5% $-49 | +0% $-89 | +5% $-128 | +10% $-168 |
|---|---|---|---|---|---|
| Rent | -10% $-180 | -5% $-134 | +0% $-89 | +5% $-43 | +10% $2 |
| Rate | -1.0pp $-18 | -0.5pp $-53 | base $-89 | +0.5pp $-125 | +1.0pp $-162 |
UW: 25.0% down · 7.5% · 30yr · 1.5% tax · 5.0% vac · 8.0% maint · 8.0% mgmt
Financing live
Cash to close
- Down payment
- $35,000
- Closing costs
- $4,200
- Reserves months
- —
- Total cash needed
- —
Loan-product check · same deal, 3 products live
Conventional
25% down · 7.5% · 30yr
- Down + closing
- —
- Monthly P&I
- —
- Monthly cashflow
- —
- DSCR
- —
- Eligible?
- —
Personal DTI + credit; lowest rate.
DSCR
20% down · 8.5% · 30yr
- Down + closing
- —
- Monthly P&I
- —
- Monthly cashflow
- —
- DSCR
- —
- Eligible?
- —
No personal income docs; deal must DSCR.
Hard money
10% down · 12.0% · 12mo
- Down + closing
- —
- Monthly P&I
- —
- Monthly cashflow
- —
- DSCR
- —
- Eligible?
- —
Short-term bridge; refi at stabilization.
Listing history 13 events
-
2026-06-19days on market $140,000 Active 17 DOM
-
2026-06-18days on market $140,000 Active 16 DOM
-
2026-06-17days on market $140,000 Active 15 DOM
-
2026-06-16days on market $140,000 Active 14 DOM
-
2026-06-15days on market $140,000 Active 13 DOM
-
2026-06-14days on market $140,000 Active 11 DOM
-
2026-06-12days on market $140,000 Active 10 DOM
-
2026-06-09days on market $140,000 Active 7 DOM
-
2026-06-08days on market $140,000 Active 6 DOM
-
2026-06-07days on market $140,000 Active 5 DOM
-
2026-06-05days on market $140,000 Active 3 DOM
-
2026-06-03remarks 699-char remark
-
2026-06-03$140,000 Active 1 DOM
ⓘ Source: listings_history table (triggers on properties + properties_extension) + one-shot
backfill from property_details.listing_events for pre-trigger history.
Tax reassessment forecast TX · Resets to sale price
- Current annual tax
- $2,471 · $206/mo
- Projected year-2 tax
- $2,562 · $214/mo
- Expected delta
- +$91/yr (+$8/mo · 3.7%)
ⓘ Screening estimate from a state-policy table — verify with the county assessor before closing.
Nearby sold comps map
Loading sold comps map…
Walkable amenities ~0.75 mi
Loading nearby amenities…
Taxation est. · year 1
- Rental income
- $13,817
- − Mortgage interest
- −$7,842
- − Property taxes
- −$2,471
- − Insurance
- −$700
- − Repairs & maintenance
- −$1,105
- − Management
- −$1,105
- − Depreciation
- −$4,073
- Taxable loss
- −$3,480
- Est. tax savings @ 24.0%
- +$835
- After-tax cash flow
- $-231/yr
For passive investors: Depreciation is non-cash, so a rental often shows a tax loss while cash-flowing — sheltering income. Rental losses are passive: they offset passive income freely, and up to $25,000/yr can offset ordinary (W-2) income if you actively participate and your MAGI is under $100k (phasing out to $0 by $150k); unused losses carry forward. On sale, claimed depreciation is recaptured at up to 25%, and gains may owe capital-gains tax (a 1031 exchange can defer both). Figures are a year-1 estimate at your 24.0% rate — not tax advice; consult a CPA.
Schools (NCES district)
- District
- Muleshoe ISD
- NCES district ID
- 4831890
- Math proficiency
- 33% ▼ -3.00%
- Reading proficiency
- 32% ▲ 1.00%
- Median HH income
- $42,141
- Composite
- 27.54/100
- National rank
- #6950
- State rank
- #580 of 826 in TX
Livability — Muleshoe
- Score
- 71/100
- State rank
- #331
- US rank
- #7229
Category grades
Schools grade is shown separately in the Schools card above.
Census & demographics
- Census place
- Muleshoe, TX
- Population (ZIP)
- 7,264
Population outlook (Bailey County) Hauer SSP2
- Today (2025)
- 7,346 people
- By 2030
- 7,428 · +1.1%
- By 2040
- 7,706 · +4.9%
- By 2050
- 8,052 · +9.6%
- By 2075
- 8,963 · +22.0%
- By 2100
- 9,549 · +30.0%
Race, ethnicity, and origin ACS 2023
- Neighborhood character
- Majority Hispanic (64%)
- Race & ethnicity
- Hispanic / Latino 64% White 31% Two or more races 16%
- Hispanic origin (detail)
- Mexican 58%
- Common ancestry
- Slovak 2% Serbian 1%
- Foreign-born
- 16% · Canada
- Languages at home
- 49% English-only · Spanish 49% German/W. Germanic 1%
Political lean MEDSL · Bailey
- 2024 margin
- Solid R (+61.1) · D 19.1% · R 80.2%
- 2008→2024 swing
- -20.7pp toward R · 2008: -40.4pp · 2024: -61.1pp
- All cycles
- 2024: R+61.1 2020: R+55.1 2016: R+53.0 2012: R+48.0 2008: R+40.4
Not yet ingested
- Civics
- —
Market trends
- HPI YoY
- ▲ 4.98%
- Current HPI
- 138.9883
- Rent YoY
- —
- Metro
- —
- State GDP YoY
- ▲ 3.95%
- F500 in state
- 110
Industry mix (Fortune 500 HQ in TX)
| Industry | F500 HQs | Revenue |
|---|---|---|
| Energy | 16 | $1,198B |
|
||
| Technology | 5 | $198B |
|
||
| Engineering / Construction | 4 | $72B |
|
||
| Energy Services | 3 | $60B |
|
||
| Utilities | 3 | $41B |
|
||
| Healthcare | 2 | $330B |
|
||
Price history
2 events — show timeline
- 2026-06-01 Listed $140,000 LARMLS
- 2006-05-24 Sold (Public Records) — Public Records
Property tax history
+2.7%/yrLatest (2026): $2,471 · +7.9% YoY. Source: county tax records.
Cash-flow waterfall
monthlySold comps — $/sqft
last 12 mo · ≤1 miLoading sold comps…